0
U.S. (TOLL FREE)
+1 (315) 215-3225
Automative

0
U.S. (TOLL FREE)
+1 (315) 215-3225
Global Equine Healthcare Market Size, Manufacturers, Supply Chain, Sales Channel and Clients, 2024-2030
Published Date: June 2024
|
Report Code: QYRE-Auto-24D8911
Home | Market Reports | Pets & Animals| Pets| Horses
Global Equine Healthcare Market Size Status and Forecast 2022
BUY CHAPTERS

Global Equine Healthcare Market Size, Manufacturers, Supply Chain, Sales Channel and Clients, 2024-2030

Code: QYRE-Auto-24D8911
Report
June 2024
Pages:144
QYResearch
Buy Now with 15% Discount
DESCRIPTION
TABLE OF CONTENT
TABLES & FIGURES

Equine Healthcare Market Size

The global market for Equine Healthcare was estimated to be worth US$ 1282.1 million in 2023 and is forecast to a readjusted size of US$ 1454.8 million by 2030 with a CAGR of 1.8% during the forecast period 2024-2030.

Equine Healthcare Market

Equine Healthcare Market

Equine health refers to veterinary services intended to treat horses to enhance their quality of life. The equine healthcare market is an emerging field of pharmaceuticals.
The top 13 manufacturers held about 75.03% of the market share in 2019.

Report Scope

This report aims to provide a comprehensive presentation of the global market for Equine Healthcare, with both quantitative and qualitative analysis, to help readers develop business/growth strategies, assess the market competitive situation, analyse their position in the current marketplace, and make informed business decisions regarding Equine Healthcare.
The Equine Healthcare market size, estimations, and forecasts are provided in terms of and revenue ($ millions), considering 2023 as the base year, with history and forecast data for the period from 2019 to 2030. This report segments the global Equine Healthcare market comprehensively. Regional market sizes, concerning products by type, by application, and by players, are also provided.
For a more in-depth understanding of the market, the report provides profiles of the competitive landscape, key competitors, and their respective market ranks. The report also discusses technological trends and new product developments.
The report will help the Equine Healthcare companies, new entrants, and industry chain related companies in this market with information on the revenues for the overall market and the sub-segments across the different segments, by company, product type, application, and regions.
Market Segmentation

Scope of Equine Healthcare Market Report

Report Metric Details
Report Name Equine Healthcare Market
Forecasted market size in 2030 US$ 1454.8 million
CAGR 1.8%
Forecasted years 2024 - 2030
Segment by Type
  • Equine Diagnostic Products
  • Equine Therapeutic Products
  • Equine Supplement Products
Segment by Application
  • Veterinary Hospitals and Clinics
  • Retail Pharmacies and Drug Stores
  • Others
By Region
  • North America (United States, Canada)
  • Europe (Germany, France, UK, Italy, Russia) Rest of Europe
  • Nordic Countries
  • Asia-Pacific (China, Japan, South Korea)
  • Southeast Asia (India, Australia)
  • Rest of Asia
  • Latin America (Mexico, Brazil)
  • Rest of Latin America
  • Middle East & Africa (Turkey, Saudi Arabia, UAE, Rest of MEA)
By Company Boehringer Ingelheim, Merck Animal Health, Zoetis, Bayer Animal Health, Elanco Animal Health, Ceva Animal Health, Dechra Veterinary Products, Purina Mills, Norbrook Equine, Virbac, Kyoritsu Seiyaku, Vetoquinol, Protexin Healthcare
Forecast units USD million in value
Report coverage Revenue and volume forecast, company share, competitive landscape, growth factors and trends

Chapter Outline

  • Chapter 1: Introduces the report scope of the report, executive summary of different market segments (product type, application, etc), including the market size of each market segment, future development potential, and so on.
  • Chapter 2: Revenue of Equine Healthcare in global and regional level.
  • Chapter 3: Detailed analysis of Equine Healthcare company competitive landscape, revenue, market share and industry ranking, latest development plan, merger, and acquisition information, etc.
  • Chapter 4: Provides profiles of key companies, introducing the basic situation of the main companies in the market in detail, including product descriptions and specifications, Equine Healthcare revenue, gross margin, and recent development, etc.
  • Chapter 5: Provides the analysis of various market segments by Type, covering the revenue, and development potential of each market segment, to help readers find the blue ocean market in different market segments.
  • Chapter 6: Provides the analysis of various market segments by Application, covering the revenue, and development potential of each market segment, to help readers find the blue ocean market in different downstream markets.
  • Chapter 7: North America (US & Canada) by Type, by Application and by country, revenue for each segment.
  • Chapter 8: Europe by Type, by Application and by country, revenue for each segment.
  • Chapter 9: Asia Pacific by Type, by Application and by region, revenue for each segment.
  • Chapter 10: Latin America by Type, by Application and by country, revenue for each segment.
  • Chapter 11: Middle East and Africa, by Type, by Application and by country, revenue for each segment.
  • Chapter 12: Analysis of industrial chain, sales channel, key raw materials, distributors, and customers.
  • Chapter 13: Introduces the market dynamics, latest developments of the market, the driving factors and restrictive factors of the market, the challenges and risks faced by manufacturers in the industry, and the analysis of relevant policies in the industry.
  • Chapter 14: Research Findings and Conclusion

FAQ for this report

What is the Equine Healthcare Market size in 2030?

Ans: The Equine Healthcare Market size in 2030 will be US$ 1454.8 million.

Who are the main players in the Equine Healthcare Market report?

Ans: The main players in the Equine Healthcare Market are Boehringer Ingelheim, Merck Animal Health, Zoetis, Bayer Animal Health, Elanco Animal Health, Ceva Animal Health, Dechra Veterinary Products, Purina Mills, Norbrook Equine, Virbac, Kyoritsu Seiyaku, Vetoquinol, Protexin Healthcare

What are the Application segmentation covered in the Equine Healthcare Market report?

Ans: The Applications covered in the Equine Healthcare Market report are Veterinary Hospitals and Clinics, Retail Pharmacies and Drug Stores, Others

What are the Type segmentation covered in the Equine Healthcare Market report?

Ans: The Types covered in the Equine Healthcare Market report are Equine Diagnostic Products, Equine Therapeutic Products, Equine Supplement Products

1 Study Coverage
1.1 Equine Healthcare Product Introduction
1.2 Market by Type
1.2.1 Global Equine Healthcare Market Size Growth Rate by Type (2019 VS 2023 VS 2030)
1.2.2 Equine Diagnostic Products
1.2.3 Equine Therapeutic Products
1.2.4 Equine Supplement Products
1.3 Market by Application
1.3.1 Global Equine Healthcare Market Size Growth Rate by Application (2019 VS 2023 VS 2030)
1.3.2 Veterinary Hospitals and Clinics
1.3.3 Retail Pharmacies and Drug Stores
1.3.4 Others
1.4 Assumptions and Limitations
1.5 Study Objectives
1.6 Years Considered
2 Executive Summary
2.1 Global Equine Healthcare Market Size Estimates and Forecasts
2.2 Equine Healthcare Market Size by Region: 2023 Versus 2030
2.2.1 Global Equine Healthcare Revenue by Region: 2019-2024
2.2.2 Global Equine Healthcare Revenue Forecast by Region (2025-2030)
2.2.3 Global Equine Healthcare Revenue Market Share by Region (2019-2030)
3 Global Equine Healthcare by Company
3.1 Global Equine Healthcare Revenue by Company (2019-2024)
3.2 Global Equine Healthcare Revenue Share by Company (2019-2024)
3.3 Competitive Landscape
3.3.1 Key Equine Healthcare Companies around the World: Ranking by Revenue
3.3.2 Global Equine Healthcare Market Concentration Ratio (CR5 and HHI) & (2019-2024)
3.3.3 Global Equine Healthcare Market Share by Company Type (Tier 1, Tier 2 and Tier 3)
3.4 Global Equine Healthcare Companies Headquarters & Product Type
3.4.1 Equine Healthcare Companies Headquarters
3.4.2 Global Equine Healthcare Companies Product & Service
3.4.3 Date of International Companies Enter into Equine Healthcare Market
3.5 Global Equine Healthcare Mergers & Acquisitions, Expansion Plans
4 Company Profiles
4.1 Boehringer Ingelheim
4.1.1 Boehringer Ingelheim Company Information
4.1.2 Boehringer Ingelheim Description, Business Overview
4.1.3 Boehringer Ingelheim Equine Healthcare Products Offered
4.1.4 Boehringer Ingelheim Equine Healthcare Revenue and Gross Margin (2019-2024)
4.1.5 Boehringer Ingelheim Equine Healthcare Revenue by Product in 2023
4.1.6 Boehringer Ingelheim Equine Healthcare Revenue by Application in 2023
4.1.7 Boehringer Ingelheim Equine Healthcare Revenue by Geographic Area in 2023
4.1.8 Boehringer Ingelheim Recent Developments
4.2 Merck Animal Health
4.2.1 Merck Animal Health Company Information
4.2.2 Merck Animal Health Description, Business Overview
4.2.3 Merck Animal Health Equine Healthcare Products Offered
4.2.4 Merck Animal Health Equine Healthcare Revenue and Gross Margin (2019-2024)
4.2.5 Merck Animal Health Equine Healthcare Revenue by Product in 2023
4.2.6 Merck Animal Health Equine Healthcare Revenue by Application in 2023
4.2.7 Merck Animal Health Equine Healthcare Revenue by Geographic Area in 2023
4.2.8 Merck Animal Health Recent Developments
4.3 Zoetis
4.3.1 Zoetis Company Information
4.3.2 Zoetis Description, Business Overview
4.3.3 Zoetis Equine Healthcare Products Offered
4.3.4 Zoetis Equine Healthcare Revenue and Gross Margin (2019-2024)
4.3.5 Zoetis Equine Healthcare Revenue by Product in 2023
4.3.6 Zoetis Equine Healthcare Revenue by Application in 2023
4.3.7 Zoetis Equine Healthcare Revenue by Geographic Area in 2023
4.3.8 Zoetis Recent Developments
4.4 Bayer Animal Health
4.4.1 Bayer Animal Health Company Information
4.4.2 Bayer Animal Health Description, Business Overview
4.4.3 Bayer Animal Health Equine Healthcare Products Offered
4.4.4 Bayer Animal Health Equine Healthcare Revenue and Gross Margin (2019-2024)
4.4.5 Bayer Animal Health Equine Healthcare Revenue by Product in 2023
4.4.6 Bayer Animal Health Equine Healthcare Revenue by Application in 2023
4.4.7 Bayer Animal Health Equine Healthcare Revenue by Geographic Area in 2023
4.4.8 Bayer Animal Health Recent Developments
4.5 Elanco Animal Health
4.5.1 Elanco Animal Health Company Information
4.5.2 Elanco Animal Health Description, Business Overview
4.5.3 Elanco Animal Health Equine Healthcare Products Offered
4.5.4 Elanco Animal Health Equine Healthcare Revenue and Gross Margin (2019-2024)
4.5.5 Elanco Animal Health Equine Healthcare Revenue by Product in 2023
4.5.6 Elanco Animal Health Equine Healthcare Revenue by Application in 2023
4.5.7 Elanco Animal Health Equine Healthcare Revenue by Geographic Area in 2023
4.5.8 Elanco Animal Health Recent Developments
4.6 Ceva Animal Health
4.6.1 Ceva Animal Health Company Information
4.6.2 Ceva Animal Health Description, Business Overview
4.6.3 Ceva Animal Health Equine Healthcare Products Offered
4.6.4 Ceva Animal Health Equine Healthcare Revenue and Gross Margin (2019-2024)
4.6.5 Ceva Animal Health Equine Healthcare Revenue by Product in 2023
4.6.6 Ceva Animal Health Equine Healthcare Revenue by Application in 2023
4.6.7 Ceva Animal Health Equine Healthcare Revenue by Geographic Area in 2023
4.6.8 Ceva Animal Health Recent Development
4.7 Dechra Veterinary Products
4.7.1 Dechra Veterinary Products Company Information
4.7.2 Dechra Veterinary Products Description, Business Overview
4.7.3 Dechra Veterinary Products Equine Healthcare Products Offered
4.7.4 Dechra Veterinary Products Equine Healthcare Revenue and Gross Margin (2019-2024)
4.7.5 Dechra Veterinary Products Equine Healthcare Revenue by Product in 2023
4.7.6 Dechra Veterinary Products Equine Healthcare Revenue by Application in 2023
4.7.7 Dechra Veterinary Products Equine Healthcare Revenue by Geographic Area in 2023
4.7.8 Dechra Veterinary Products Recent Development
4.8 Purina Mills
4.8.1 Purina Mills Company Information
4.8.2 Purina Mills Description, Business Overview
4.8.3 Purina Mills Equine Healthcare Products Offered
4.8.4 Purina Mills Equine Healthcare Revenue and Gross Margin (2019-2024)
4.8.5 Purina Mills Equine Healthcare Revenue by Product in 2023
4.8.6 Purina Mills Equine Healthcare Revenue by Application in 2023
4.8.7 Purina Mills Equine Healthcare Revenue by Geographic Area in 2023
4.8.8 Purina Mills Recent Development
4.9 Norbrook Equine
4.9.1 Norbrook Equine Company Information
4.9.2 Norbrook Equine Description, Business Overview
4.9.3 Norbrook Equine Equine Healthcare Products Offered
4.9.4 Norbrook Equine Equine Healthcare Revenue and Gross Margin (2019-2024)
4.9.5 Norbrook Equine Equine Healthcare Revenue by Product in 2023
4.9.6 Norbrook Equine Equine Healthcare Revenue by Application in 2023
4.9.7 Norbrook Equine Equine Healthcare Revenue by Geographic Area in 2023
4.9.8 Norbrook Equine Recent Development
4.10 Virbac
4.10.1 Virbac Company Information
4.10.2 Virbac Description, Business Overview
4.10.3 Virbac Equine Healthcare Products Offered
4.10.4 Virbac Equine Healthcare Revenue and Gross Margin (2019-2024)
4.10.5 Virbac Equine Healthcare Revenue by Product in 2023
4.10.6 Virbac Equine Healthcare Revenue by Application in 2023
4.10.7 Virbac Equine Healthcare Revenue by Geographic Area in 2023
4.10.8 Virbac Recent Development
4.11 Kyoritsu Seiyaku
4.11.1 Kyoritsu Seiyaku Company Information
4.11.2 Kyoritsu Seiyaku Description, Business Overview
4.11.3 Kyoritsu Seiyaku Equine Healthcare Products Offered
4.11.4 Kyoritsu Seiyaku Equine Healthcare Revenue and Gross Margin (2019-2024)
4.11.5 Kyoritsu Seiyaku Equine Healthcare Revenue by Product in 2023
4.11.6 Kyoritsu Seiyaku Equine Healthcare Revenue by Application in 2023
4.11.7 Kyoritsu Seiyaku Equine Healthcare Revenue by Geographic Area in 2023
4.11.8 Kyoritsu Seiyaku Recent Development
4.12 Vetoquinol
4.12.1 Vetoquinol Company Information
4.12.2 Vetoquinol Description, Business Overview
4.12.3 Vetoquinol Equine Healthcare Products Offered
4.12.4 Vetoquinol Equine Healthcare Revenue and Gross Margin (2019-2024)
4.12.5 Vetoquinol Equine Healthcare Revenue by Product in 2023
4.12.6 Vetoquinol Equine Healthcare Revenue by Application in 2023
4.12.7 Vetoquinol Equine Healthcare Revenue by Geographic Area in 2023
4.12.8 Vetoquinol Recent Development
4.13 Protexin Healthcare
4.13.1 Protexin Healthcare Company Information
4.13.2 Protexin Healthcare Description, Business Overview
4.13.3 Protexin Healthcare Equine Healthcare Products Offered
4.13.4 Protexin Healthcare Equine Healthcare Revenue and Gross Margin (2019-2024)
4.13.5 Protexin Healthcare Equine Healthcare Revenue by Product in 2023
4.13.6 Protexin Healthcare Equine Healthcare Revenue by Application in 2023
4.13.7 Protexin Healthcare Equine Healthcare Revenue by Geographic Area in 2023
4.13.8 Protexin Healthcare Recent Development
5 Breakdown Data by Type
5.1 Global Equine Healthcare Revenue by Type (2019-2024)
5.2 Global Equine Healthcare Revenue Forecast by Type (2025-2030)
5.3 Equine Healthcare Revenue Market Share by Type (2019-2030)
6 Breakdown Data by Application
6.1 Global Equine Healthcare Revenue by Application (2019-2024)
6.2 Global Equine Healthcare Revenue Forecast by Application (2025-2030)
6.3 Equine Healthcare Revenue Market Share by Application (2019-2030)
7 North America
7.1 North America Equine Healthcare Market Size YoY Growth 2019-2030
7.2 North America Equine Healthcare Market Facts & Figures by Country (2019-2030)
7.3 North America Equine Healthcare Revenue by Type (2019-2024)
7.4 North America Equine Healthcare Revenue by Application (2019-2024)
8 Asia-Pacific
8.1 Asia-Pacific Equine Healthcare Market Size YoY Growth 2019-2030
8.2 Asia-Pacific Equine Healthcare Market Facts & Figures by Region (2019-2030)
8.3 Asia-Pacific Equine Healthcare Revenue by Type (2019-2024)
8.4 Asia-Pacific Equine Healthcare Revenue by Application (2019-2024)
9 Europe
9.1 Europe Equine Healthcare Market Size YoY Growth 2019-2030
9.2 Europe Equine Healthcare Market Facts & Figures by Country (2019-2030)
9.3 Europe Equine Healthcare Revenue by Type (2019-2024)
9.4 Europe Equine Healthcare Revenue by Application (2019-2024)
10 Latin America
10.1 Latin America Equine Healthcare Market Size YoY Growth 2019-2030
10.2 Latin America Equine Healthcare Market Facts & Figures by Country (2019-2030)
10.3 Latin America Equine Healthcare Revenue by Type (2019-2024)
10.4 Latin America Equine Healthcare Revenue by Application (2019-2024)
11 Middle East and Africa
11.1 Middle East and Africa Equine Healthcare Market Size YoY Growth 2019-2030
11.2 Middle East and Africa Equine Healthcare Market Facts & Figures by Country (2019-2030)
11.3 Middle East and Africa Equine Healthcare Revenue by Type (2019-2024)
11.4 Middle East and Africa Equine Healthcare Revenue by Application (2019-2024)
12 Supply Chain and Sales Channel Analysis
12.1 Equine Healthcare Supply Chain Analysis
12.2 Equine Healthcare Key Raw Materials and Upstream Suppliers
12.3 Equine Healthcare Clients Analysis
12.4 Equine Healthcare Sales Channel and Sales Model Analysis
12.4.1 Equine Healthcare Distribution Channel Analysis: Indirect Sales VS Direct Sales
12.4.2 Equine Healthcare Distribution Channel Analysis: Online Sales VS Offline Sales
12.4.3 Equine Healthcare Distributors
13 Market Dynamics
13.1 Equine Healthcare Industry Trends
13.2 Equine Healthcare Market Drivers
13.3 Equine Healthcare Market Challenges
13.4 Equine Healthcare Market Restraints
14 Research Findings and Conclusion
15 Appendix
15.1 Research Methodology
15.1.1 Methodology/Research Approach
15.1.2 Data Source
15.2 Author Details
15.3 Disclaimer
List of Tables
    Table 1. Global Equine Healthcare Market Size Growth Rate by Type (US$ Million): 2019 VS 2023 VS 2030
    Table 2. Major Companies of Equine Diagnostic Products
    Table 3. Major Companies of Equine Therapeutic Products
    Table 4. Major Companies of Equine Supplement Products
    Table 5. Global Equine Healthcare Market Size Growth by Application (US$ Million): 2019 VS 2023 VS 2030
    Table 6. Global Equine Healthcare Market Size by Region (US$ Million): 2023 VS 2030
    Table 7. Global Equine Healthcare Revenue by Region (2019-2024) & (US$ Million)
    Table 8. Global Equine Healthcare Revenue Forecast by Region (2025-2030) & (US$ Million)
    Table 9. Equine Healthcare Revenue by Company (2019-2024) & (US$ Million)
    Table 10. Equine Healthcare Revenue Share by Company (2019-2024)
    Table 11. Ranking of Global Top Equine Healthcare Players by Revenue (US$ Million) in 2023
    Table 12. Global Equine Healthcare Companies Market Concentration Ratio (CR5 and HHI) & (2019-2024)
    Table 13. Global Equine Healthcare by Company Type (Tier 1, Tier 2 and Tier 3) & (based on the Revenue in Equine Healthcare as of 2023)
    Table 14. Global Equine Healthcare Companies Headquarters
    Table 15. Global Equine Healthcare Companies Product & Service
    Table 16. Date of International Companies Enter into Equine Healthcare Market
    Table 17. Global Equine Healthcare Mergers & Acquisitions, Expansion Plans
    Table 18. Boehringer Ingelheim Company Information
    Table 19. Boehringer Ingelheim Description and Business Overview
    Table 20. Boehringer Ingelheim Equine Healthcare Product
    Table 21. Boehringer Ingelheim Equine Healthcare Revenue (US$ Million) and Gross Margin (2019-2024)
    Table 22. Boehringer Ingelheim Revenue Proportion of Equine Healthcare by Product in 2023
    Table 23. Boehringer Ingelheim Revenue Proportion of Equine Healthcare by Application in 2023
    Table 24. Boehringer Ingelheim Revenue Proportion of Equine Healthcare by Geographic Area in 2023
    Table 25. Boehringer Ingelheim Recent Development
    Table 26. Merck Animal Health Company Information
    Table 27. Merck Animal Health Description and Business Overview
    Table 28. Merck Animal Health Equine Healthcare Product
    Table 29. Merck Animal Health Equine Healthcare Revenue (US$ Million) and Gross Margin (2019-2024)
    Table 30. Merck Animal Health Revenue Proportion of Equine Healthcare by Product in 2023
    Table 31. Merck Animal Health Revenue Proportion of Equine Healthcare by Application in 2023
    Table 32. Merck Animal Health Revenue Proportion of Equine Healthcare by Geographic Area in 2023
    Table 33. Merck Animal Health Recent Development
    Table 34. Zoetis Company Information
    Table 35. Zoetis Description and Business Overview
    Table 36. Zoetis Equine Healthcare Product
    Table 37. Zoetis Equine Healthcare Revenue (US$ Million) and Gross Margin (2019-2024)
    Table 38. Zoetis Revenue Proportion of Equine Healthcare by Product in 2023
    Table 39. Zoetis Revenue Proportion of Equine Healthcare by Application in 2023
    Table 40. Zoetis Revenue Proportion of Equine Healthcare by Geographic Area in 2023
    Table 41. Zoetis Recent Development
    Table 42. Bayer Animal Health Company Information
    Table 43. Bayer Animal Health Description and Business Overview
    Table 44. Bayer Animal Health Equine Healthcare Product
    Table 45. Bayer Animal Health Equine Healthcare Revenue (US$ Million) and Gross Margin (2019-2024)
    Table 46. Bayer Animal Health Revenue Proportion of Equine Healthcare by Product in 2023
    Table 47. Bayer Animal Health Revenue Proportion of Equine Healthcare by Application in 2023
    Table 48. Bayer Animal Health Revenue Proportion of Equine Healthcare by Geographic Area in 2023
    Table 49. Bayer Animal Health Recent Development
    Table 50. Elanco Animal Health Company Information
    Table 51. Elanco Animal Health Description and Business Overview
    Table 52. Elanco Animal Health Equine Healthcare Product
    Table 53. Elanco Animal Health Equine Healthcare Revenue (US$ Million) and Gross Margin (2019-2024)
    Table 54. Elanco Animal Health Revenue Proportion of Equine Healthcare by Product in 2023
    Table 55. Elanco Animal Health Revenue Proportion of Equine Healthcare by Application in 2023
    Table 56. Elanco Animal Health Revenue Proportion of Equine Healthcare by Geographic Area in 2023
    Table 57. Elanco Animal Health Recent Development
    Table 58. Ceva Animal Health Company Information
    Table 59. Ceva Animal Health Description and Business Overview
    Table 60. Ceva Animal Health Equine Healthcare Product
    Table 61. Ceva Animal Health Equine Healthcare Revenue (US$ Million) and Gross Margin (2019-2024)
    Table 62. Ceva Animal Health Revenue Proportion of Equine Healthcare by Product in 2023
    Table 63. Ceva Animal Health Revenue Proportion of Equine Healthcare by Application in 2023
    Table 64. Ceva Animal Health Revenue Proportion of Equine Healthcare by Geographic Area in 2023
    Table 65. Ceva Animal Health Recent Development
    Table 66. Dechra Veterinary Products Company Information
    Table 67. Dechra Veterinary Products Description and Business Overview
    Table 68. Dechra Veterinary Products Equine Healthcare Product
    Table 69. Dechra Veterinary Products Equine Healthcare Revenue (US$ Million) and Gross Margin (2019-2024)
    Table 70. Dechra Veterinary Products Revenue Proportion of Equine Healthcare by Product in 2023
    Table 71. Dechra Veterinary Products Revenue Proportion of Equine Healthcare by Application in 2023
    Table 72. Dechra Veterinary Products Revenue Proportion of Equine Healthcare by Geographic Area in 2023
    Table 73. Dechra Veterinary Products Recent Development
    Table 74. Purina Mills Company Information
    Table 75. Purina Mills Description and Business Overview
    Table 76. Purina Mills Equine Healthcare Product
    Table 77. Purina Mills Equine Healthcare Revenue (US$ Million) and Gross Margin (2019-2024)
    Table 78. Purina Mills Revenue Proportion of Equine Healthcare by Product in 2023
    Table 79. Purina Mills Revenue Proportion of Equine Healthcare by Application in 2023
    Table 80. Purina Mills Revenue Proportion of Equine Healthcare by Geographic Area in 2023
    Table 81. Purina Mills Recent Development
    Table 82. Norbrook Equine Company Information
    Table 83. Norbrook Equine Description and Business Overview
    Table 84. Norbrook Equine Equine Healthcare Product
    Table 85. Norbrook Equine Equine Healthcare Revenue (US$ Million) and Gross Margin (2019-2024)
    Table 86. Norbrook Equine Revenue Proportion of Equine Healthcare by Product in 2023
    Table 87. Norbrook Equine Revenue Proportion of Equine Healthcare by Application in 2023
    Table 88. Norbrook Equine Revenue Proportion of Equine Healthcare by Geographic Area in 2023
    Table 89. Norbrook Equine Recent Development
    Table 90. Virbac Company Information
    Table 91. Virbac Description and Business Overview
    Table 92. Virbac Equine Healthcare Product
    Table 93. Virbac Equine Healthcare Revenue (US$ Million) and Gross Margin (2019-2024)
    Table 94. Virbac Revenue Proportion of Equine Healthcare by Product in 2023
    Table 95. Virbac Revenue Proportion of Equine Healthcare by Application in 2023
    Table 96. Virbac Revenue Proportion of Equine Healthcare by Geographic Area in 2023
    Table 97. Virbac Recent Development
    Table 98. Kyoritsu Seiyaku Company Information
    Table 99. Kyoritsu Seiyaku Description and Business Overview
    Table 100. Kyoritsu Seiyaku Equine Healthcare Product
    Table 101. Kyoritsu Seiyaku Equine Healthcare Revenue (US$ Million) and Gross Margin (2019-2024)
    Table 102. Kyoritsu Seiyaku Revenue Proportion of Equine Healthcare by Product in 2023
    Table 103. Kyoritsu Seiyaku Revenue Proportion of Equine Healthcare by Application in 2023
    Table 104. Kyoritsu Seiyaku Revenue Proportion of Equine Healthcare by Geographic Area in 2023
    Table 105. Kyoritsu Seiyaku Recent Development
    Table 106. Vetoquinol Company Information
    Table 107. Vetoquinol Description and Business Overview
    Table 108. Vetoquinol Equine Healthcare Product
    Table 109. Vetoquinol Equine Healthcare Revenue (US$ Million) and Gross Margin (2019-2024)
    Table 110. Vetoquinol Revenue Proportion of Equine Healthcare by Product in 2023
    Table 111. Vetoquinol Revenue Proportion of Equine Healthcare by Application in 2023
    Table 112. Vetoquinol Revenue Proportion of Equine Healthcare by Geographic Area in 2023
    Table 113. Vetoquinol Recent Development
    Table 114. Protexin Healthcare Company Information
    Table 115. Protexin Healthcare Description and Business Overview
    Table 116. Protexin Healthcare Equine Healthcare Product
    Table 117. Protexin Healthcare Equine Healthcare Revenue (US$ Million) and Gross Margin (2019-2024)
    Table 118. Protexin Healthcare Revenue Proportion of Equine Healthcare by Product in 2023
    Table 119. Protexin Healthcare Revenue Proportion of Equine Healthcare by Application in 2023
    Table 120. Protexin Healthcare Revenue Proportion of Equine Healthcare by Geographic Area in 2023
    Table 121. Protexin Healthcare Recent Development
    Table 122. Global Equine Healthcare Revenue by Type (2019-2024) & (US$ Million)
    Table 123. Global Equine Healthcare Revenue Forecast by Type (2025-2030) & (US$ Million)
    Table 124. Global Equine Healthcare Revenue by Application (2019-2024) & (US$ Million)
    Table 125. Global Equine Healthcare Revenue Forecast by Application (2025-2030) & (US$ Million)
    Table 126. North America Equine Healthcare Revenue by Country (2019-2024) & (US$ Million)
    Table 127. North America Equine Healthcare Revenue by Country (2025-2030) & (US$ Million)
    Table 128. North America Equine Healthcare Revenue by Type (2019-2024) & (US$ Million)
    Table 129. North America Equine Healthcare Revenue by Application (2019-2024) & (US$ Million)
    Table 130. Asia-Pacific Equine Healthcare Revenue by Region (2019-2030) & (US$ Million)
    Table 131. Asia-Pacific Equine Healthcare Revenue by Region (2025-2030) & (US$ Million)
    Table 132. Asia-Pacific Equine Healthcare Revenue by Type (2019-2024) & (US$ Million)
    Table 133. Asia-Pacific Equine Healthcare Revenue by Application (2019-2024) & (US$ Million)
    Table 134. Europe Equine Healthcare Revenue by Country (2019-2024) & (US$ Million)
    Table 135. Europe Equine Healthcare Revenue by Country (2025-2030) & (US$ Million)
    Table 136. Europe Equine Healthcare Revenue by Type (2019-2024) & (US$ Million)
    Table 137. Europe Equine Healthcare Revenue by Application (2019-2024) & (US$ Million)
    Table 138. Latin America Equine Healthcare Revenue by Country (2019-2024) & (US$ Million)
    Table 139. Latin America Equine Healthcare Revenue by Country (2025-2030) & (US$ Million)
    Table 140. Latin America Equine Healthcare Revenue by Type (2019-2024) & (US$ Million)
    Table 141. Latin America Equine Healthcare Revenue by Application (2019-2024) & (US$ Million)
    Table 142. Middle East and Africa Equine Healthcare Revenue by Country (2019-2024) & (US$ Million)
    Table 143. Middle East and Africa Equine Healthcare Revenue by Country (2025-2030) & (US$ Million)
    Table 144. Middle East and Africa Equine Healthcare Revenue by Type (2019-2024) & (US$ Million)
    Table 145. Middle East and Africa Equine Healthcare Revenue by Application (2019-2024) & (US$ Million)
    Table 146. Equine Healthcare Key Raw Materials, Industry Status and Trend
    Table 147. Equine Healthcare Key Raw Materials and Upstream Suppliers
    Table 148. Equine Healthcare Clients Status and Trend
    Table 149. Equine Healthcare Typical Clients
    Table 150. Equine Healthcare Distributors
    Table 151. Equine Healthcare Market Trends
    Table 152. Equine Healthcare Market Drivers
    Table 153. Equine Healthcare Market Challenges
    Table 154. Equine Healthcare Market Restraints
    Table 155. Research Programs/Design for This Report
    Table 156. Key Data Information from Secondary Sources
    Table 157. Key Data Information from Primary Sources
List of Figures
    Figure 1. Equine Healthcare Product Picture
    Figure 2. Global Equine Healthcare Revenue Market Share by Type in 2023 & 2030
    Figure 3. Equine Diagnostic Products Product Picture
    Figure 4. Equine Therapeutic Products Product Picture
    Figure 5. Equine Supplement Products Product Picture
    Figure 6. Global Equine Healthcare Revenue Market Share by Application in 2023 & 2030
    Figure 7. Veterinary Hospitals and Clinics
    Figure 8. Retail Pharmacies and Drug Stores
    Figure 9. Others
    Figure 10. Equine Healthcare Report Years Considered
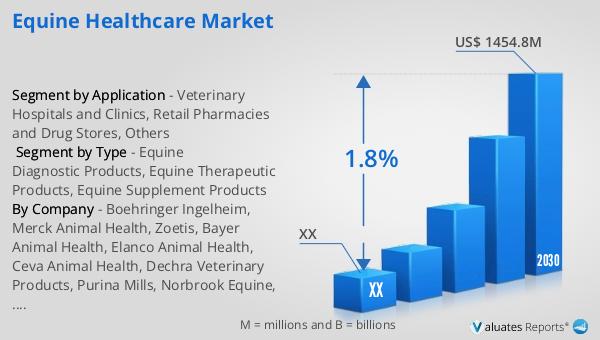
    Figure 11. Global Equine Healthcare Revenue, (US$ Million), 2019 VS 2023 VS 2030
    Figure 12. Global Equine Healthcare Market Size 2019-2030 (US$ Million)
    Figure 13. Global Equine Healthcare Market Size Market Share by Region: 2023 Versus 2030
    Figure 14. Global Equine Healthcare Revenue Market Share by Region (2019-2030)
    Figure 15. Equine Healthcare Market Share by Company Type (Tier 1, Tier 2 and Tier 3): 2019 VS 2023
    Figure 16. Global Equine Healthcare Revenue Market Share Forecast by Type (2019-2030)
    Figure 17. Global Equine Healthcare Revenue Market Share Forecast by Application (2019-2030)
    Figure 18. North America Equine Healthcare Revenue 2019-2030 (US$ Million)
    Figure 19. North America Equine Healthcare Revenue Market Share by Type (2019-2024)
    Figure 20. North America Equine Healthcare Revenue Market Share by Application (2019-2024)
    Figure 21. Asia-Pacific Equine Healthcare Revenue 2019-2030 (US$ Million)
    Figure 22. Asia-Pacific Equine Healthcare Revenue Market Share by Region (2019-2030)
    Figure 23. Asia-Pacific Equine Healthcare Revenue Market Share by Type (2019-2024)
    Figure 24. Asia-Pacific Equine Healthcare Revenue Market Share by Application (2019-2024)
    Figure 25. Europe Equine Healthcare Revenue Growth Rate 2019-2030 (US$ Million)
    Figure 26. Europe Equine Healthcare Revenue Market Share by Country (2019-2030)
    Figure 27. Europe Equine Healthcare Revenue Market Share by Type (2019-2024)
    Figure 28. Europe Equine Healthcare Revenue Market Share by Application (2019-2024)
    Figure 29. Latin America Equine Healthcare Revenue Growth Rate 2019-2030 (US$ Million)
    Figure 30. Latin America Equine Healthcare Revenue Market Share by Country (2019-2024)
    Figure 31. Latin America Equine Healthcare Revenue Market Share by Type (2019-2024)
    Figure 32. Latin America Equine Healthcare Revenue Market Share by Application (2019-2024)
    Figure 33. Middle East and Africa Equine Healthcare Revenue Growth Rate 2019-2030 (US$ Million)
    Figure 34. Middle East and Africa Equine Healthcare Revenue Market Share by Country (2019-2030)
    Figure 35. Middle East and Africa Equine Healthcare Revenue Market Share by Type (2019-2024)
    Figure 36. Middle East and Africa Equine Healthcare Revenue Market Share by Application (2019-2024)
    Figure 37. Equine Healthcare Supply Chain (Upstream and Downstream Market)
    Figure 38. Global Production Market Share of Equine Healthcare Raw Materials by Region in 2023
    Figure 39. Equine Healthcare Distribution Channels
    Figure 40. Global Equine Healthcare Percentage 2019-2030: Indirect Sales VS Direct Sales
    Figure 41. Global Equine Healthcare Percentage 2019-2030: Online Sales VS Offline Sales
    Figure 42. Bottom-up and Top-down Approaches for This Report
    Figure 43. Data Triangulation
    Figure 44. Key Executives Interviewed
    Figure 45. Global Equine Healthcare Percentage 2019-2030: Online Sales VS Offline Sales
    Figure 46. Bottom-up and Top-down Approaches for This Report
    Figure 47. Data Triangulation
    Figure 48. Key Executives Interviewed
SELECT A FORMAT
Added to Cart
Electronic (PDF)

$5900

This license allows only one user to access the PDF.
Electronic (PDF)

$8850

This license allows 1 - 5 user to access the PDF, license is suitable for small groups of 5 users working together
Electronic (PDF)

$11800

This license allows users/teams in a same Enterprise to use this report, various departments within an enterpise can use this report
Add to Cart
Buy Now (15% Discount)

OUR CUSTOMER

Nano String

SIMILAR REPORTS