0
  • Category
  • Region
U.S. (TOLL FREE)
+1 (315) 215-3225
0
U.S. (TOLL FREE)
+1 (315) 215-3225
Global Gas-to-liquid (GTL) Market Research Report 2025
Published Date: January 2025
|
Report Code: QYRE-Auto-29A9085
Home | Market Reports | Business & Industrial| Energy & Utilities| Oil & Gas
Global Gas to liquid GTL Market Insights and Forecast to 2028
BUY CHAPTERS

Global Gas-to-liquid (GTL) Market Research Report 2025

Code: QYRE-Auto-29A9085
Report
January 2025
Pages:80
QYResearch
Buy Now with 15% Discount
DESCRIPTION
TABLE OF CONTENT
TABLES & FIGURES

Gas-to-liquid (GTL) Market Size

The global market for Gas-to-liquid (GTL) was valued at US$ 60.2 million in the year 2024 and is projected to reach a revised size of US$ 77.3 million by 2031, growing at a CAGR of 3.7% during the forecast period.

Gas-to-liquid (GTL) Market

Gas-to-liquid (GTL) Market

Gas to liquids (GTL) is a refinery process to convert natural gas or other gaseous hydrocarbons into longer-chain hydrocarbons such as gasoline or diesel fuel. Methane-rich gases are converted into liquid synthetic fuels either via direct conversion using the new GasTechno® non-catalytic gas-to-liquids process that converts methane to methanol in one step. Or via syngas as an intermediate, for example using the Fischer Tropsch or Mobil processes.
GTL Diesel accounts for more than 68% of the market, and the market share has not changed a lot. GTL Naphtha is much fewer than GTL Diesel.

Report Scope

This report aims to provide a comprehensive presentation of the global market for Gas-to-liquid (GTL), with both quantitative and qualitative analysis, to help readers develop business/growth strategies, assess the market competitive situation, analyze their position in the current marketplace, and make informed business decisions regarding Gas-to-liquid (GTL).
The Gas-to-liquid (GTL) market size, estimations, and forecasts are provided in terms of output/shipments (K Barrels/day) and revenue ($ millions), considering 2024 as the base year, with history and forecast data for the period from 2020 to 2031. This report segments the global Gas-to-liquid (GTL) market comprehensively. Regional market sizes, concerning products by Type, by Application, and by players, are also provided.
For a more in-depth understanding of the market, the report provides profiles of the competitive landscape, key competitors, and their respective market ranks. The report also discusses technological trends and new product developments.
The report will help the Gas-to-liquid (GTL) manufacturers, new entrants, and industry chain related companies in this market with information on the revenues, production, and average price for the overall market and the sub-segments across the different segments, by company, by Type, by Application, and by regions.
Market Segmentation

Scope of Gas-to-liquid (GTL) Market Report

Report Metric Details
Report Name Gas-to-liquid (GTL) Market
Accounted market size in year US$ 60.2 million
Forecasted market size in 2031 US$ 77.3 million
CAGR 3.7%
Base Year year
Forecasted years 2025 - 2031
by Type
  • GTL Diesel
  • GTL Naphtha
  • Others
by Application
  • Fuel Oil
  • Lubricating Oil
  • Process Oils
  • Others
Production by Region
  • North America
  • Europe
  • China
  • Japan
Consumption by Region
  • North America (United States, Canada)
  • Europe (Germany, France, UK, Italy, Russia)
  • Asia-Pacific (China, Japan, South Korea, Taiwan)
  • Southeast Asia (India)
  • Latin America (Mexico, Brazil)
By Company Shell, Oryx GTL, PetroSA, OLTIN YO'L GTL, Chevron
Forecast units USD million in value
Report coverage Revenue and volume forecast, company share, competitive landscape, growth factors and trends

Chapter Outline

  • Chapter 1: Introduces the report scope of the report, executive summary of different market segments (by region, by Type, by Application, etc), including the market size of each market segment, future development potential, and so on. It offers a high-level view of the current state of the market and its likely evolution in the short to mid-term, and long term.
  • Chapter 2: Detailed analysis of Gas-to-liquid (GTL) manufacturers competitive landscape, price, production and value market share, latest development plan, merger, and acquisition information, etc.
  • Chapter 3: Production/output, value of Gas-to-liquid (GTL) by region/country. It provides a quantitative analysis of the market size and development potential of each region in the next six years.
  • Chapter 4: Consumption of Gas-to-liquid (GTL) in regional level and country level. It provides a quantitative analysis of the market size and development potential of each region and its main countries and introduces the market development, future development prospects, market space, and production of each country in the world.
  • Chapter 5: Provides the analysis of various market segments by Type, covering the market size and development potential of each market segment, to help readers find the blue ocean market in different market segments.
  • Chapter 6: Provides the analysis of various market segments by Application, covering the market size and development potential of each market segment, to help readers find the blue ocean market in different downstream markets.
  • Chapter 7: Provides profiles of key players, introducing the basic situation of the main companies in the market in detail, including product production/output, value, price, gross margin, product introduction, recent development, etc.
  • Chapter 8: Analysis of industrial chain, including the upstream and downstream of the industry.
  • Chapter 9: Introduces the market dynamics, latest developments of the market, the driving factors and restrictive factors of the market, the challenges and risks faced by manufacturers in the industry, and the analysis of relevant policies in the industry.
  • Chapter 10: The main points and conclusions of the report.

FAQ for this report

How fast is Gas-to-liquid (GTL) Market growing?

Ans: The Gas-to-liquid (GTL) Market witnessing a CAGR of 3.7% during the forecast period 2025-2031.

What is the Gas-to-liquid (GTL) Market size in 2031?

Ans: The Gas-to-liquid (GTL) Market size in 2031 will be US$ 77.3 million.

What is the Gas-to-liquid (GTL) Market share by type?

Ans: GTL Diesel accounts for more than 68% of the market, and the market share has not changed a lot.

Who are the main players in the Gas-to-liquid (GTL) Market report?

Ans: The main players in the Gas-to-liquid (GTL) Market are Shell, Oryx GTL, PetroSA, OLTIN YO'L GTL, Chevron

What are the Application segmentation covered in the Gas-to-liquid (GTL) Market report?

Ans: The Applications covered in the Gas-to-liquid (GTL) Market report are Fuel Oil, Lubricating Oil, Process Oils, Others

What are the Type segmentation covered in the Gas-to-liquid (GTL) Market report?

Ans: The Types covered in the Gas-to-liquid (GTL) Market report are GTL Diesel, GTL Naphtha, Others

1 Gas-to-liquid (GTL) Market Overview
1.1 Product Definition
1.2 Gas-to-liquid (GTL) by Type
1.2.1 Global Gas-to-liquid (GTL) Market Value Growth Rate Analysis by Type: 2024 VS 2031
1.2.2 GTL Diesel
1.2.3 GTL Naphtha
1.2.4 Others
1.3 Gas-to-liquid (GTL) by Application
1.3.1 Global Gas-to-liquid (GTL) Market Value Growth Rate Analysis by Application: 2024 VS 2031
1.3.2 Fuel Oil
1.3.3 Lubricating Oil
1.3.4 Process Oils
1.3.5 Others
1.4 Global Market Growth Prospects
1.4.1 Global Gas-to-liquid (GTL) Production Value Estimates and Forecasts (2020-2031)
1.4.2 Global Gas-to-liquid (GTL) Production Capacity Estimates and Forecasts (2020-2031)
1.4.3 Global Gas-to-liquid (GTL) Production Estimates and Forecasts (2020-2031)
1.4.4 Global Gas-to-liquid (GTL) Market Average Price Estimates and Forecasts (2020-2031)
1.5 Assumptions and Limitations
2 Market Competition by Manufacturers
2.1 Global Gas-to-liquid (GTL) Production Market Share by Manufacturers (2020-2025)
2.2 Global Gas-to-liquid (GTL) Production Value Market Share by Manufacturers (2020-2025)
2.3 Global Key Players of Gas-to-liquid (GTL), Industry Ranking, 2023 VS 2024
2.4 Global Gas-to-liquid (GTL) Market Share by Company Type (Tier 1, Tier 2, and Tier 3)
2.5 Global Gas-to-liquid (GTL) Average Price by Manufacturers (2020-2025)
2.6 Global Key Manufacturers of Gas-to-liquid (GTL), Manufacturing Base Distribution and Headquarters
2.7 Global Key Manufacturers of Gas-to-liquid (GTL), Product Offered and Application
2.8 Global Key Manufacturers of Gas-to-liquid (GTL), Date of Enter into This Industry
2.9 Gas-to-liquid (GTL) Market Competitive Situation and Trends
2.9.1 Gas-to-liquid (GTL) Market Concentration Rate
2.9.2 Global 5 and 10 Largest Gas-to-liquid (GTL) Players Market Share by Revenue
2.10 Mergers & Acquisitions, Expansion
3 Gas-to-liquid (GTL) Production by Region
3.1 Global Gas-to-liquid (GTL) Production Value Estimates and Forecasts by Region: 2020 VS 2024 VS 2031
3.2 Global Gas-to-liquid (GTL) Production Value by Region (2020-2031)
3.2.1 Global Gas-to-liquid (GTL) Production Value by Region (2020-2025)
3.2.2 Global Forecasted Production Value of Gas-to-liquid (GTL) by Region (2026-2031)
3.3 Global Gas-to-liquid (GTL) Production Estimates and Forecasts by Region: 2020 VS 2024 VS 2031
3.4 Global Gas-to-liquid (GTL) Production Volume by Region (2020-2031)
3.4.1 Global Gas-to-liquid (GTL) Production by Region (2020-2025)
3.4.2 Global Forecasted Production of Gas-to-liquid (GTL) by Region (2026-2031)
3.5 Global Gas-to-liquid (GTL) Market Price Analysis by Region (2020-2025)
3.6 Global Gas-to-liquid (GTL) Production and Value, Year-over-Year Growth
3.6.1 North America Gas-to-liquid (GTL) Production Value Estimates and Forecasts (2020-2031)
3.6.2 Europe Gas-to-liquid (GTL) Production Value Estimates and Forecasts (2020-2031)
3.6.3 China Gas-to-liquid (GTL) Production Value Estimates and Forecasts (2020-2031)
3.6.4 Japan Gas-to-liquid (GTL) Production Value Estimates and Forecasts (2020-2031)
4 Gas-to-liquid (GTL) Consumption by Region
4.1 Global Gas-to-liquid (GTL) Consumption Estimates and Forecasts by Region: 2020 VS 2024 VS 2031
4.2 Global Gas-to-liquid (GTL) Consumption by Region (2020-2031)
4.2.1 Global Gas-to-liquid (GTL) Consumption by Region (2020-2025)
4.2.2 Global Gas-to-liquid (GTL) Forecasted Consumption by Region (2026-2031)
4.3 North America
4.3.1 North America Gas-to-liquid (GTL) Consumption Growth Rate by Country: 2020 VS 2024 VS 2031
4.3.2 North America Gas-to-liquid (GTL) Consumption by Country (2020-2031)
4.3.3 U.S.
4.3.4 Canada
4.4 Europe
4.4.1 Europe Gas-to-liquid (GTL) Consumption Growth Rate by Country: 2020 VS 2024 VS 2031
4.4.2 Europe Gas-to-liquid (GTL) Consumption by Country (2020-2031)
4.4.3 Germany
4.4.4 France
4.4.5 U.K.
4.4.6 Italy
4.4.7 Netherlands
4.5 Asia Pacific
4.5.1 Asia Pacific Gas-to-liquid (GTL) Consumption Growth Rate by Region: 2020 VS 2024 VS 2031
4.5.2 Asia Pacific Gas-to-liquid (GTL) Consumption by Region (2020-2031)
4.5.3 China
4.5.4 Japan
4.5.5 South Korea
4.5.6 China Taiwan
4.5.7 Southeast Asia
4.5.8 India
4.6 Latin America, Middle East & Africa
4.6.1 Latin America, Middle East & Africa Gas-to-liquid (GTL) Consumption Growth Rate by Country: 2020 VS 2024 VS 2031
4.6.2 Latin America, Middle East & Africa Gas-to-liquid (GTL) Consumption by Country (2020-2031)
4.6.3 Mexico
4.6.4 Brazil
4.6.5 Turkey
4.6.6 GCC Countries
5 Segment by Type
5.1 Global Gas-to-liquid (GTL) Production by Type (2020-2031)
5.1.1 Global Gas-to-liquid (GTL) Production by Type (2020-2025)
5.1.2 Global Gas-to-liquid (GTL) Production by Type (2026-2031)
5.1.3 Global Gas-to-liquid (GTL) Production Market Share by Type (2020-2031)
5.2 Global Gas-to-liquid (GTL) Production Value by Type (2020-2031)
5.2.1 Global Gas-to-liquid (GTL) Production Value by Type (2020-2025)
5.2.2 Global Gas-to-liquid (GTL) Production Value by Type (2026-2031)
5.2.3 Global Gas-to-liquid (GTL) Production Value Market Share by Type (2020-2031)
5.3 Global Gas-to-liquid (GTL) Price by Type (2020-2031)
6 Segment by Application
6.1 Global Gas-to-liquid (GTL) Production by Application (2020-2031)
6.1.1 Global Gas-to-liquid (GTL) Production by Application (2020-2025)
6.1.2 Global Gas-to-liquid (GTL) Production by Application (2026-2031)
6.1.3 Global Gas-to-liquid (GTL) Production Market Share by Application (2020-2031)
6.2 Global Gas-to-liquid (GTL) Production Value by Application (2020-2031)
6.2.1 Global Gas-to-liquid (GTL) Production Value by Application (2020-2025)
6.2.2 Global Gas-to-liquid (GTL) Production Value by Application (2026-2031)
6.2.3 Global Gas-to-liquid (GTL) Production Value Market Share by Application (2020-2031)
6.3 Global Gas-to-liquid (GTL) Price by Application (2020-2031)
7 Key Companies Profiled
7.1 Shell
7.1.1 Shell Gas-to-liquid (GTL) Company Information
7.1.2 Shell Gas-to-liquid (GTL) Product Portfolio
7.1.3 Shell Gas-to-liquid (GTL) Production, Value, Price and Gross Margin (2020-2025)
7.1.4 Shell Main Business and Markets Served
7.1.5 Shell Recent Developments/Updates
7.2 Oryx GTL
7.2.1 Oryx GTL Gas-to-liquid (GTL) Company Information
7.2.2 Oryx GTL Gas-to-liquid (GTL) Product Portfolio
7.2.3 Oryx GTL Gas-to-liquid (GTL) Production, Value, Price and Gross Margin (2020-2025)
7.2.4 Oryx GTL Main Business and Markets Served
7.2.5 Oryx GTL Recent Developments/Updates
7.3 PetroSA
7.3.1 PetroSA Gas-to-liquid (GTL) Company Information
7.3.2 PetroSA Gas-to-liquid (GTL) Product Portfolio
7.3.3 PetroSA Gas-to-liquid (GTL) Production, Value, Price and Gross Margin (2020-2025)
7.3.4 PetroSA Main Business and Markets Served
7.3.5 PetroSA Recent Developments/Updates
7.4 OLTIN YO'L GTL
7.4.1 OLTIN YO'L GTL Gas-to-liquid (GTL) Company Information
7.4.2 OLTIN YO'L GTL Gas-to-liquid (GTL) Product Portfolio
7.4.3 OLTIN YO'L GTL Gas-to-liquid (GTL) Production, Value, Price and Gross Margin (2020-2025)
7.4.4 OLTIN YO'L GTL Main Business and Markets Served
7.4.5 OLTIN YO'L GTL Recent Developments/Updates
7.5 Chevron
7.5.1 Chevron Gas-to-liquid (GTL) Company Information
7.5.2 Chevron Gas-to-liquid (GTL) Product Portfolio
7.5.3 Chevron Gas-to-liquid (GTL) Production, Value, Price and Gross Margin (2020-2025)
7.5.4 Chevron Main Business and Markets Served
7.5.5 Chevron Recent Developments/Updates
8 Industry Chain and Sales Channels Analysis
8.1 Gas-to-liquid (GTL) Industry Chain Analysis
8.2 Gas-to-liquid (GTL) Raw Material Supply Analysis
8.2.1 Key Raw Materials
8.2.2 Raw Materials Key Suppliers
8.3 Gas-to-liquid (GTL) Production Mode & Process Analysis
8.4 Gas-to-liquid (GTL) Sales and Marketing
8.4.1 Gas-to-liquid (GTL) Sales Channels
8.4.2 Gas-to-liquid (GTL) Distributors
8.5 Gas-to-liquid (GTL) Customer Analysis
9 Gas-to-liquid (GTL) Market Dynamics
9.1 Gas-to-liquid (GTL) Industry Trends
9.2 Gas-to-liquid (GTL) Market Drivers
9.3 Gas-to-liquid (GTL) Market Challenges
9.4 Gas-to-liquid (GTL) Market Restraints
10 Research Findings and Conclusion
11 Methodology and Data Source
11.1 Methodology/Research Approach
11.1.1 Research Programs/Design
11.1.2 Market Size Estimation
11.1.3 Market Breakdown and Data Triangulation
11.2 Data Source
11.2.1 Secondary Sources
11.2.2 Primary Sources
11.3 Author List
11.4 Disclaimer
List of Tables
 Table 1. Global Gas-to-liquid (GTL) Market Value by Type, (US$ Million) & (2024 VS 2031)
 Table 2. Global Gas-to-liquid (GTL) Market Value by Application, (US$ Million) & (2024 VS 2031)
 Table 3. Global Gas-to-liquid (GTL) Production Capacity (K Barrels/day) by Manufacturers in 2024
 Table 4. Global Gas-to-liquid (GTL) Production by Manufacturers (2020-2025) & (K Barrels/day)
 Table 5. Global Gas-to-liquid (GTL) Production Market Share by Manufacturers (2020-2025)
 Table 6. Global Gas-to-liquid (GTL) Production Value by Manufacturers (2020-2025) & (US$ Million)
 Table 7. Global Gas-to-liquid (GTL) Production Value Share by Manufacturers (2020-2025)
 Table 8. Global Key Players of Gas-to-liquid (GTL), Industry Ranking, 2023 VS 2024
 Table 9. Company Type (Tier 1, Tier 2, and Tier 3) & (based on the Production Value in Gas-to-liquid (GTL) as of 2024)
 Table 10. Global Market Gas-to-liquid (GTL) Average Price by Manufacturers (USD/Barrel) & (2020-2025)
 Table 11. Global Key Manufacturers of Gas-to-liquid (GTL), Manufacturing Base Distribution and Headquarters
 Table 12. Global Key Manufacturers of Gas-to-liquid (GTL), Product Offered and Application
 Table 13. Global Key Manufacturers of Gas-to-liquid (GTL), Date of Enter into This Industry
 Table 14. Global Gas-to-liquid (GTL) Manufacturers Market Concentration Ratio (CR5 and HHI)
 Table 15. Mergers & Acquisitions, Expansion Plans
 Table 16. Global Gas-to-liquid (GTL) Production Value by Region: 2020 VS 2024 VS 2031 (US$ Million)
 Table 17. Global Gas-to-liquid (GTL) Production Value (US$ Million) by Region (2020-2025)
 Table 18. Global Gas-to-liquid (GTL) Production Value Market Share by Region (2020-2025)
 Table 19. Global Gas-to-liquid (GTL) Production Value (US$ Million) Forecast by Region (2026-2031)
 Table 20. Global Gas-to-liquid (GTL) Production Value Market Share Forecast by Region (2026-2031)
 Table 21. Global Gas-to-liquid (GTL) Production Comparison by Region: 2020 VS 2024 VS 2031 (K Barrels/day)
 Table 22. Global Gas-to-liquid (GTL) Production (K Barrels/day) by Region (2020-2025)
 Table 23. Global Gas-to-liquid (GTL) Production Market Share by Region (2020-2025)
 Table 24. Global Gas-to-liquid (GTL) Production (K Barrels/day) Forecast by Region (2026-2031)
 Table 25. Global Gas-to-liquid (GTL) Production Market Share Forecast by Region (2026-2031)
 Table 26. Global Gas-to-liquid (GTL) Market Average Price (USD/Barrel) by Region (2020-2025)
 Table 27. Global Gas-to-liquid (GTL) Market Average Price (USD/Barrel) by Region (2026-2031)
 Table 28. Global Gas-to-liquid (GTL) Consumption Growth Rate by Region: 2020 VS 2024 VS 2031 (K Barrels/day)
 Table 29. Global Gas-to-liquid (GTL) Consumption by Region (2020-2025) & (K Barrels/day)
 Table 30. Global Gas-to-liquid (GTL) Consumption Market Share by Region (2020-2025)
 Table 31. Global Gas-to-liquid (GTL) Forecasted Consumption by Region (2026-2031) & (K Barrels/day)
 Table 32. Global Gas-to-liquid (GTL) Forecasted Consumption Market Share by Region (2026-2031)
 Table 33. North America Gas-to-liquid (GTL) Consumption Growth Rate by Country: 2020 VS 2024 VS 2031 (K Barrels/day)
 Table 34. North America Gas-to-liquid (GTL) Consumption by Country (2020-2025) & (K Barrels/day)
 Table 35. North America Gas-to-liquid (GTL) Consumption by Country (2026-2031) & (K Barrels/day)
 Table 36. Europe Gas-to-liquid (GTL) Consumption Growth Rate by Country: 2020 VS 2024 VS 2031 (K Barrels/day)
 Table 37. Europe Gas-to-liquid (GTL) Consumption by Country (2020-2025) & (K Barrels/day)
 Table 38. Europe Gas-to-liquid (GTL) Consumption by Country (2026-2031) & (K Barrels/day)
 Table 39. Asia Pacific Gas-to-liquid (GTL) Consumption Growth Rate by Region: 2020 VS 2024 VS 2031 (K Barrels/day)
 Table 40. Asia Pacific Gas-to-liquid (GTL) Consumption by Region (2020-2025) & (K Barrels/day)
 Table 41. Asia Pacific Gas-to-liquid (GTL) Consumption by Region (2026-2031) & (K Barrels/day)
 Table 42. Latin America, Middle East & Africa Gas-to-liquid (GTL) Consumption Growth Rate by Country: 2020 VS 2024 VS 2031 (K Barrels/day)
 Table 43. Latin America, Middle East & Africa Gas-to-liquid (GTL) Consumption by Country (2020-2025) & (K Barrels/day)
 Table 44. Latin America, Middle East & Africa Gas-to-liquid (GTL) Consumption by Country (2026-2031) & (K Barrels/day)
 Table 45. Global Gas-to-liquid (GTL) Production (K Barrels/day) by Type (2020-2025)
 Table 46. Global Gas-to-liquid (GTL) Production (K Barrels/day) by Type (2026-2031)
 Table 47. Global Gas-to-liquid (GTL) Production Market Share by Type (2020-2025)
 Table 48. Global Gas-to-liquid (GTL) Production Market Share by Type (2026-2031)
 Table 49. Global Gas-to-liquid (GTL) Production Value (US$ Million) by Type (2020-2025)
 Table 50. Global Gas-to-liquid (GTL) Production Value (US$ Million) by Type (2026-2031)
 Table 51. Global Gas-to-liquid (GTL) Production Value Market Share by Type (2020-2025)
 Table 52. Global Gas-to-liquid (GTL) Production Value Market Share by Type (2026-2031)
 Table 53. Global Gas-to-liquid (GTL) Price (USD/Barrel) by Type (2020-2025)
 Table 54. Global Gas-to-liquid (GTL) Price (USD/Barrel) by Type (2026-2031)
 Table 55. Global Gas-to-liquid (GTL) Production (K Barrels/day) by Application (2020-2025)
 Table 56. Global Gas-to-liquid (GTL) Production (K Barrels/day) by Application (2026-2031)
 Table 57. Global Gas-to-liquid (GTL) Production Market Share by Application (2020-2025)
 Table 58. Global Gas-to-liquid (GTL) Production Market Share by Application (2026-2031)
 Table 59. Global Gas-to-liquid (GTL) Production Value (US$ Million) by Application (2020-2025)
 Table 60. Global Gas-to-liquid (GTL) Production Value (US$ Million) by Application (2026-2031)
 Table 61. Global Gas-to-liquid (GTL) Production Value Market Share by Application (2020-2025)
 Table 62. Global Gas-to-liquid (GTL) Production Value Market Share by Application (2026-2031)
 Table 63. Global Gas-to-liquid (GTL) Price (USD/Barrel) by Application (2020-2025)
 Table 64. Global Gas-to-liquid (GTL) Price (USD/Barrel) by Application (2026-2031)
 Table 65. Shell Gas-to-liquid (GTL) Company Information
 Table 66. Shell Gas-to-liquid (GTL) Specification and Application
 Table 67. Shell Gas-to-liquid (GTL) Production (K Barrels/day), Value (US$ Million), Price (USD/Barrel) and Gross Margin (2020-2025)
 Table 68. Shell Main Business and Markets Served
 Table 69. Shell Recent Developments/Updates
 Table 70. Oryx GTL Gas-to-liquid (GTL) Company Information
 Table 71. Oryx GTL Gas-to-liquid (GTL) Specification and Application
 Table 72. Oryx GTL Gas-to-liquid (GTL) Production (K Barrels/day), Value (US$ Million), Price (USD/Barrel) and Gross Margin (2020-2025)
 Table 73. Oryx GTL Main Business and Markets Served
 Table 74. Oryx GTL Recent Developments/Updates
 Table 75. PetroSA Gas-to-liquid (GTL) Company Information
 Table 76. PetroSA Gas-to-liquid (GTL) Specification and Application
 Table 77. PetroSA Gas-to-liquid (GTL) Production (K Barrels/day), Value (US$ Million), Price (USD/Barrel) and Gross Margin (2020-2025)
 Table 78. PetroSA Main Business and Markets Served
 Table 79. PetroSA Recent Developments/Updates
 Table 80. OLTIN YO'L GTL Gas-to-liquid (GTL) Company Information
 Table 81. OLTIN YO'L GTL Gas-to-liquid (GTL) Specification and Application
 Table 82. OLTIN YO'L GTL Gas-to-liquid (GTL) Production (K Barrels/day), Value (US$ Million), Price (USD/Barrel) and Gross Margin (2020-2025)
 Table 83. OLTIN YO'L GTL Main Business and Markets Served
 Table 84. OLTIN YO'L GTL Recent Developments/Updates
 Table 85. Chevron Gas-to-liquid (GTL) Company Information
 Table 86. Chevron Gas-to-liquid (GTL) Specification and Application
 Table 87. Chevron Gas-to-liquid (GTL) Production (K Barrels/day), Value (US$ Million), Price (USD/Barrel) and Gross Margin (2020-2025)
 Table 88. Chevron Main Business and Markets Served
 Table 89. Chevron Recent Developments/Updates
 Table 90. Key Raw Materials Lists
 Table 91. Raw Materials Key Suppliers Lists
 Table 92. Gas-to-liquid (GTL) Distributors List
 Table 93. Gas-to-liquid (GTL) Customers List
 Table 94. Gas-to-liquid (GTL) Market Trends
 Table 95. Gas-to-liquid (GTL) Market Drivers
 Table 96. Gas-to-liquid (GTL) Market Challenges
 Table 97. Gas-to-liquid (GTL) Market Restraints
 Table 98. Research Programs/Design for This Report
 Table 99. Key Data Information from Secondary Sources
 Table 100. Key Data Information from Primary Sources
 Table 101. Authors List of This Report


List of Figures
 Figure 1. Product Picture of Gas-to-liquid (GTL)
 Figure 2. Global Gas-to-liquid (GTL) Market Value by Type, (US$ Million) & (2020-2031)
 Figure 3. Global Gas-to-liquid (GTL) Market Share by Type: 2024 VS 2031
 Figure 4. GTL Diesel Product Picture
 Figure 5. GTL Naphtha Product Picture
 Figure 6. Others Product Picture
 Figure 7. Global Gas-to-liquid (GTL) Market Value by Application, (US$ Million) & (2020-2031)
 Figure 8. Global Gas-to-liquid (GTL) Market Share by Application: 2024 VS 2031
 Figure 9. Fuel Oil
 Figure 10. Lubricating Oil
 Figure 11. Process Oils
 Figure 12. Others
 Figure 13. Global Gas-to-liquid (GTL) Production Value (US$ Million), 2020 VS 2024 VS 2031
 Figure 14. Global Gas-to-liquid (GTL) Production Value (US$ Million) & (2020-2031)
 Figure 15. Global Gas-to-liquid (GTL) Production Capacity (K Barrels/day) & (2020-2031)
 Figure 16. Global Gas-to-liquid (GTL) Production (K Barrels/day) & (2020-2031)
 Figure 17. Global Gas-to-liquid (GTL) Average Price (USD/Barrel) & (2020-2031)
 Figure 18. Gas-to-liquid (GTL) Report Years Considered
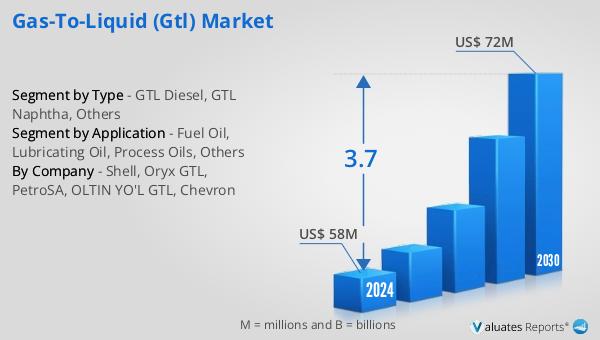
 Figure 19. Gas-to-liquid (GTL) Production Share by Manufacturers in 2024
 Figure 20. Global Gas-to-liquid (GTL) Production Value Share by Manufacturers (2024)
 Figure 21. Gas-to-liquid (GTL) Market Share by Company Type (Tier 1, Tier 2, and Tier 3): 2020 VS 2024
 Figure 22. The Global 5 and 10 Largest Players: Market Share by Gas-to-liquid (GTL) Revenue in 2024
 Figure 23. Global Gas-to-liquid (GTL) Production Value by Region: 2020 VS 2024 VS 2031 (US$ Million)
 Figure 24. Global Gas-to-liquid (GTL) Production Value Market Share by Region: 2020 VS 2024 VS 2031
 Figure 25. Global Gas-to-liquid (GTL) Production Comparison by Region: 2020 VS 2024 VS 2031 (K Barrels/day)
 Figure 26. Global Gas-to-liquid (GTL) Production Market Share by Region: 2020 VS 2024 VS 2031
 Figure 27. North America Gas-to-liquid (GTL) Production Value (US$ Million) Growth Rate (2020-2031)
 Figure 28. Europe Gas-to-liquid (GTL) Production Value (US$ Million) Growth Rate (2020-2031)
 Figure 29. China Gas-to-liquid (GTL) Production Value (US$ Million) Growth Rate (2020-2031)
 Figure 30. Japan Gas-to-liquid (GTL) Production Value (US$ Million) Growth Rate (2020-2031)
 Figure 31. Global Gas-to-liquid (GTL) Consumption by Region: 2020 VS 2024 VS 2031 (K Barrels/day)
 Figure 32. Global Gas-to-liquid (GTL) Consumption Market Share by Region: 2020 VS 2024 VS 2031
 Figure 33. North America Gas-to-liquid (GTL) Consumption and Growth Rate (2020-2031) & (K Barrels/day)
 Figure 34. North America Gas-to-liquid (GTL) Consumption Market Share by Country (2020-2031)
 Figure 35. U.S. Gas-to-liquid (GTL) Consumption and Growth Rate (2020-2031) & (K Barrels/day)
 Figure 36. Canada Gas-to-liquid (GTL) Consumption and Growth Rate (2020-2031) & (K Barrels/day)
 Figure 37. Europe Gas-to-liquid (GTL) Consumption and Growth Rate (2020-2031) & (K Barrels/day)
 Figure 38. Europe Gas-to-liquid (GTL) Consumption Market Share by Country (2020-2031)
 Figure 39. Germany Gas-to-liquid (GTL) Consumption and Growth Rate (2020-2031) & (K Barrels/day)
 Figure 40. France Gas-to-liquid (GTL) Consumption and Growth Rate (2020-2031) & (K Barrels/day)
 Figure 41. U.K. Gas-to-liquid (GTL) Consumption and Growth Rate (2020-2031) & (K Barrels/day)
 Figure 42. Italy Gas-to-liquid (GTL) Consumption and Growth Rate (2020-2031) & (K Barrels/day)
 Figure 43. Netherlands Gas-to-liquid (GTL) Consumption and Growth Rate (2020-2031) & (K Barrels/day)
 Figure 44. Asia Pacific Gas-to-liquid (GTL) Consumption and Growth Rate (2020-2031) & (K Barrels/day)
 Figure 45. Asia Pacific Gas-to-liquid (GTL) Consumption Market Share by Region (2020-2031)
 Figure 46. China Gas-to-liquid (GTL) Consumption and Growth Rate (2020-2031) & (K Barrels/day)
 Figure 47. Japan Gas-to-liquid (GTL) Consumption and Growth Rate (2020-2031) & (K Barrels/day)
 Figure 48. South Korea Gas-to-liquid (GTL) Consumption and Growth Rate (2020-2031) & (K Barrels/day)
 Figure 49. China Taiwan Gas-to-liquid (GTL) Consumption and Growth Rate (2020-2031) & (K Barrels/day)
 Figure 50. Southeast Asia Gas-to-liquid (GTL) Consumption and Growth Rate (2020-2031) & (K Barrels/day)
 Figure 51. India Gas-to-liquid (GTL) Consumption and Growth Rate (2020-2031) & (K Barrels/day)
 Figure 52. Latin America, Middle East & Africa Gas-to-liquid (GTL) Consumption and Growth Rate (2020-2031) & (K Barrels/day)
 Figure 53. Latin America, Middle East & Africa Gas-to-liquid (GTL) Consumption Market Share by Country (2020-2031)
 Figure 54. Mexico Gas-to-liquid (GTL) Consumption and Growth Rate (2020-2031) & (K Barrels/day)
 Figure 55. Brazil Gas-to-liquid (GTL) Consumption and Growth Rate (2020-2031) & (K Barrels/day)
 Figure 56. Turkey Gas-to-liquid (GTL) Consumption and Growth Rate (2020-2031) & (K Barrels/day)
 Figure 57. GCC Countries Gas-to-liquid (GTL) Consumption and Growth Rate (2020-2031) & (K Barrels/day)
 Figure 58. Global Production Market Share of Gas-to-liquid (GTL) by Type (2020-2031)
 Figure 59. Global Production Value Market Share of Gas-to-liquid (GTL) by Type (2020-2031)
 Figure 60. Global Gas-to-liquid (GTL) Price (USD/Barrel) by Type (2020-2031)
 Figure 61. Global Production Market Share of Gas-to-liquid (GTL) by Application (2020-2031)
 Figure 62. Global Production Value Market Share of Gas-to-liquid (GTL) by Application (2020-2031)
 Figure 63. Global Gas-to-liquid (GTL) Price (USD/Barrel) by Application (2020-2031)
 Figure 64. Gas-to-liquid (GTL) Value Chain
 Figure 65. Channels of Distribution (Direct Vs Distribution)
 Figure 66. Bottom-up and Top-down Approaches for This Report
 Figure 67. Data Triangulation
SELECT A FORMAT
Added to Cart
Electronic (PDF)

$2900

This license allows only one user to access the PDF.
Electronic (PDF)

$4350

This license allows 1 - 5 user to access the PDF, license is suitable for small groups of 5 users working together
Electronic (PDF)

$5800

This license allows users/teams in a same Enterprise to use this report, various departments within an enterpise can use this report
Add to Cart
Buy Now (15% Discount)

OUR CUSTOMER

Strategic Venue Partners

SIMILAR REPORTS


RELATED REPORTS

Global Liquid Cooled Fuel Cell Market Research Report 2025

120 Pages
Type: Report
Code: QYRE-Auto-11X12042
Fri Feb 07 00:00:00 UTC 2025

Add to Cart

Global Octofluoropropane Market Research Report 2025

120 Pages
Type: Report
Code: QYRE-Auto-27Q12077
Fri Feb 07 00:00:00 UTC 2025

Add to Cart

Global Diesel Fuel Lubricants Market Research Report 2025

120 Pages
Type: Report
Code: QYRE-Auto-28M14981
Fri Feb 07 00:00:00 UTC 2025

Add to Cart

Global Multifunctional Rotary Drilling Rig Market Research Report 2025

120 Pages
Type: Report
Code: QYRE-Auto-17K13771
Fri Feb 07 00:00:00 UTC 2025

Add to Cart