
The growth of the graphene market report is expected to be powered by the increased adoption of renewable energy across different sectors across the globe. Furthermore, strict regulations imposed by different governments to minimize carbon emissions are expected to fuel the growth of the graphene market report.
It is anticipated that ongoing R&D activities around the globe and large-scale development of graphene from renewable sources, especially the use of value-added chemicals, will give enormous growth for the graphene market size.
|
Report Metric |
Details |
|
Report Name |
Graphene Market |
|
Market size value in 2019 |
87.5 Million |
|
Revenue forecast in 2027 |
876.8 Million |
|
Forecast Period 2019 to 2026 CAGR |
40.2% |
|
Base year considered |
2019 |
|
Historical Data for |
2020-2027 |
|
Forecast units |
Value (USD) |
|
Segments covered |
Type, End-User, Offerings, and Region |
|
Market by Type |
Mono-layer & Bi-layer Graphene, Few Layer Graphene, Graphene Oxide, and Graphene Nano Platelets |
|
Market by Application/End-User |
RFID, Composites, Sensors, Research & Development, Energy storage, Functional ink, and Polymer additives, Tire, Coatings, and Others |
|
Report coverage |
Revenue & volume forecast, company share, competitive landscape, growth factors, and trends |
|
Geographic regions covered |
North America, Europe, Asia Pacific, Latin America, Middle East & Africa |
|
Companies covered |
CVD Equipment Corporation, Graphene Nanochem PLC, Vorbrck Materials, XG Sciences, Haydale Limited, Graphenea, Graphene Laboratories, Bluestone Global Tech, Angstron Material, Inc. and ACS Material, LLC.
|
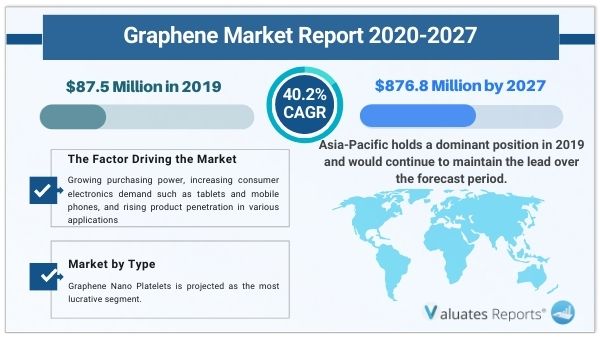
Ans. The global graphene market is estimated to grow with a CAGR of 40.2% during the forecast period.
Ans. The global graphene market size valued at $87.5 million in 2019, and is projected to reach $876.8 million by 2027.
Ans. Factors that are expected to fuel the growth of the graphene market are growing purchasing power and increasing consumer electronics demand such as tablets and mobile phones
Ans. Asia-Pacific holds a dominant position in 2019 and would continue to maintain the lead over the forecast period.
Ans. Yes, the report includes a COVID-19 impact analysis. Also, it is further extended into every individual segment of the report.
Ans. The top companies operating in the graphene market include CVD Equipment Corporation, Graphene Nanochem PLC, Vorbrck Materials, XG Sciences, Haydale Limited, Graphenea, Graphene Laboratories, Bluestone Global Tech, Angstron Material, Inc. and ACS Material, LLC.
CHAPTER 1:INTRODUCTION
1.1.Report description
1.2.Key benefits for stakeholders
1.3.Key market segments
1.4.Research methodology
1.4.1.Secondary research
1.4.2.Primary research
1.5.Analyst tools and models
CHAPTER 2:EXECUTIVE SUMMARY
2.1.Key findings of the study
2.2.CXO perspective
CHAPTER 3:MARKET OVERVIEW
3.1.Market definition and scope
3.2.Key findings
3.2.1.Top investment pockets
3.3.Porter’s five forces analysis
3.4.Market dynamics
3.4.1.Drivers
3.4.1.1.Rapid Increase in Graphene Producers
3.4.1.2.High Demand for Graphene in Electronics Application
3.4.1.3.Use of Graphene in Composites & Coatings
3.4.2.Restraint
3.4.2.1.Impact on environment
3.4.3.Opportunity
3.4.3.1.Increasing key developments
3.5.Parent peer market overview
3.6.Patent analysis, 2015–2018
3.6.1.Patent analysis by country
3.6.2.Patent analysis by applicant, 2015–2018
3.6.3.Patent analysis by inventors, 2015–2018
3.7.Impact of government rules and regulations
CHAPTER 4:GRAPHENE MARKET, BY TYPE
4.1.Overview
4.1.1.Market size and forecast
4.2.Mono-layer & Bi-layer Graphene
4.2.1.Key market trends, growth factors, and opportunities
4.2.2.Market size and forecast, by region
4.2.3.Market share analysis, by country
4.3.Few Layer Graphene (FLG)
4.3.1.Key market trends, growth factors, and opportunities
4.3.2.Market size and forecast, by region
4.3.3.Market share analysis, by country
4.4.Graphene Oxide (GO)
4.4.1.Key market trends, growth factors, and opportunities
4.4.2.Market size and forecast, by region
4.4.3.Market share analysis, by country
4.5.Graphene Nano Platelets (GNP)
4.5.1.Key market trends, growth factors, and opportunities
4.5.2.Market size and forecast, by region
4.5.3.Market share analysis, by country
CHAPTER 5:GRAPHENE MARKET, BY APPLICATION
5.1.Overview
5.1.1.Market size and forecast
5.2.Radio Frequency Identification (RFID)
5.2.1.Key market trends, growth factors, and opportunities
5.2.2.Market size and forecast, by region
5.2.3.Market share analysis, by country
5.3.Composites
5.3.1.Key market trends, growth factors, and opportunities
5.3.2.Market size and forecast, by region
5.3.3.Market share analysis, by country
5.4.Sensors
5.4.1.Key market trends, growth factors, and opportunities
5.4.2.Market size and forecast, by region
5.4.3.Market share analysis, by country
5.5.Research & Development
5.5.1.Key market trends, growth factors, and opportunities
5.5.2.Market size and forecast, by region
5.5.3.Market share analysis, by country
5.6.Energy storage
5.6.1.Key market trends, growth factors, and opportunities
5.6.2.Market size and forecast, by region
5.6.3.Market share analysis, by country
5.7.Functional ink
5.7.1.Key market trends, growth factors, and opportunities
5.7.2.Market size and forecast, by region
5.7.3.Market share analysis, by country
5.8.Polymer additives
5.8.1.Key market trends, growth factors, and opportunities
5.8.2.Market size and forecast, by region
5.8.3.Market share analysis, by country
CHAPTER 6:GRAPHENE MARKET, BY REGION
6.1.Overview
6.1.1.Market size and forecast, by region
6.2.North America
6.2.1.Key market trends, growth factors, and opportunities
6.2.2.Market size and forecast, by type
6.2.3.Market size and forecast, by application
6.2.4.Market size and forecast by country
6.2.5.U.S.
6.2.5.1.Market size and forecast, by type
6.2.5.2.Market size and forecast, by application
6.2.6.Canada
6.2.6.1.Market size and forecast, by type
6.2.6.2.Market size and forecast, by application
6.2.7.Mexico
6.2.7.1.Market size and forecast, by type
6.2.7.2.Market size and forecast, by application
6.3.Europe
6.3.1.Key market trends, growth factors, and opportunities
6.3.2.Market size and forecast, by type
6.3.3.Market size and forecast, by application
6.3.4.Market size and forecast by country
6.3.5.Germany
6.3.5.1.Market size and forecast, by type
6.3.5.2.Market size and forecast, by application
6.3.6.UK
6.3.6.1.Market size and forecast, by type
6.3.6.2.Market size and forecast, by application
6.3.7.France
6.3.7.1.Market size and forecast, by type
6.3.7.2.Market size and forecast, by application
6.3.8.Italy
6.3.8.1.Market size and forecast, by type
6.3.8.2.Market size and forecast, by application
6.3.9.Spain
6.3.9.1.Market size and forecast, by type
6.3.9.2.Market size and forecast, by application
6.3.10.Rest of Europe
6.3.10.1.Market size and forecast, by type
6.3.10.2.Market size and forecast, by application
6.4.Asia-Pacific
6.4.1.Key market trends, growth factors, and opportunities
6.4.2.Market size and forecast, by type
6.4.3.Market size and forecast, by application
6.4.4.Market size and forecast by country
6.4.5.China
6.4.5.1.Market size and forecast, by type
6.4.5.2.Market size and forecast, by application
6.4.6.Japan
6.4.6.1.Market size and forecast, by type
6.4.6.2.Market size and forecast, by application
6.4.7.India
6.4.7.1.Market size and forecast, by type
6.4.7.2.Market size and forecast, by application
6.4.8.South Korea
6.4.8.1.Market size and forecast, by type
6.4.8.2.Market size and forecast, by application
6.4.9.Australia
6.4.9.1.Market size and forecast, by type
6.4.9.2.Market size and forecast, by application
6.4.10.Rest of Asia-Pacific
6.4.10.1.Market size and forecast, by type
6.4.10.2.Market size and forecast, by application
6.5.LAMEA
6.5.1.Key market trends, growth factors, and opportunities
6.5.2.Market size and forecast, by type
6.5.3.Market size and forecast, by application
6.5.4.Market size and forecast by country
6.5.5.Brazil
6.5.5.1.Market size and forecast, by type
6.5.5.2.Market size and forecast, by application
6.5.6.Saudi Arabia
6.5.6.1.Market size and forecast, by type
6.5.6.2.Market size and forecast, by application
6.5.7.South Africa
6.5.7.1.Market size and forecast, by type
6.5.7.2.Market size and forecast, by application
6.5.8.Rest of LAMEA
6.5.8.1.Market size and forecast, by type
6.5.8.2.Market size and forecast, by application
CHAPTER 7:COMPETITIVE LANDSCAPE
7.1.INTRODUCTION
7.1.1.MARKET PLAYER POSITIONING, 2018
7.2.TOP WINNING STRATEGIES
7.2.1.Top winning strategies, by year
7.2.2.Top winning strategies, by development
7.2.3.Top winning strategies, by company
7.3.PRODUCT MAPPING OF TOP 10 PLAYER
7.4.COMPETITIVE DASHBOARD
7.5.COMPETITIVE HEATMAP
7.6.KEY DEVELOPMENTS
7.6.1.New product launches
7.6.2.Expansions
7.6.3.Mergers and acquisition
CHAPTER 8:COMPANY PROFILES:
8.1.ACS Material LLC
8.1.1.Company overview
8.1.2.Company snapshot
8.1.3.Product portfolio
8.1.4.Key strategic moves and developments
8.2.Bluestone Global Tech
8.2.1.Company overview
8.2.2.Company snapshot
8.2.3.Product portfolio
8.3.CVD Equipment Corporation
8.3.1.Company overview
8.3.2.Company snapshot
8.3.3.Operating business segments
8.3.4.Product portfolio
8.3.5.Business performance
8.4.Graphene Nanochem PLC
8.4.1.Company overview
8.4.2.Company snapshot
8.4.3.Operating business segments
8.4.4.Product portfolio
8.5.Graphenea S.A.
8.5.1.Company overview
8.5.2.Company snapshot
8.5.3.Product portfolio
8.5.4.Key strategic moves and developments
8.6.G6 Materials
8.6.1.Company overview
8.6.2.Company snapshot
8.6.3.Product portfolio
8.6.4.Business performance
8.7.Haydale Limited
8.7.1.Company overview
8.7.2.Company snapshot
8.7.3.Operating business segments
8.7.4.Product portfolio
8.7.5.Business performance
8.7.6.Key strategic moves and developments
8.8.Nanotek Instruments, Inc.
8.8.1.Company overview
8.8.2.Company snapshot
8.8.3.Product portfolio
8.9.Vorbeck Materials
8.9.1.Company overview
8.9.2.Company snapshot
8.9.3.Product portfolio
8.9.4.Key strategic moves and developments
8.10.XG Sciences
8.10.1.Company overview
8.10.2.Company snapshot
8.10.3.Product portfolio
8.10.4.Business performance
8.10.5.Key strategic moves and developments
Table 01.Global Graphene Market Revenue, By Type 2019–2027, ($Thousand)
Table 02.Global Graphene Market, By Type, 2019–2027 ($Thousand)
Table 03.Global Graphene Market For Mono-layer & Bi-layer Graphene, By Region, 2019–2027 ($Thousand)
Table 04.Global Graphene Market For Few Layer Graphene (Flg), By Region, 2019–2027 ($Thousand)
Table 05.Global Graphene Market For Graphene Oxide (Go), By Region, 2019–2027 ($Thousand)
Table 06.Global Graphene Market For Graphene Nano Platelets (Gnp), By Region, 2019–2027 ($Thousand)
Table 07.Global Graphene Market Revenue, By Application 2019–2027, ($Thousand)
Table 08.Global Graphene Market, By Application, 2019–2027 ($Thousand)
Table 09.Global Graphene Market For Rfid, By Region, 2019–2027 ($Thousand)
Table 10.Global Graphene Market For Composites, By Region, 2019–2027 ($Thousand)
Table 11.Global Graphene Market For Sensors, By Region, 2019–2027 ($Thousand)
Table 12.Global Graphene Market For Research & Development, By Region, 2019–2027 ($Thousand)
Table 13.Global Graphene Market For Energy Storage, By Region, 2019–2027 ($Thousand)
Table 14.Global Graphene Market For Functional Ink, By Region, 2019–2027 ($Thousand)
Table 15.Global Graphene Market For Polymer Additives, By Region, 2019–2027 ($Thousand)
Table 16.Global Graphene Market, By Region 2019–2027 ($Thousand)
Table 17.North America Graphene Market, By Type, 2019–2027 ($Thousand)
Table 18.North America Graphene Market, By Application, 2019–2027 ($Thousand)
Table 19.North America Graphene Market, By Country 2019–2027 ($Thousand)
Table 20.U.S. Graphene Market, By Type, 2019–2027 ($Thousand)
Table 21.U.S. Graphene Market, By Application, 2019–2027 ($Thousand)
Table 22.Canada Graphene Market, By Type, 2019–2027 ($Thousand)
Table 23.Canada Graphene Market, By Application, 2019–2027 ($Thousand)
Table 24.Mexico Graphene Market, By Type, 2019–2027 ($Thousand)
Table 25.Mexico Graphene Market, By Application, 2019–2027 ($Thousand)
Table 26.Europe Graphene Market, By Type, 2019–2027 ($Thousand)
Table 27.Europe Graphene Market, By Application, 2019–2027 ($Thousand)
Table 28.Europe Graphene Market, By Country 2019–2027 ($Thousand)
Table 29.Germany Graphene Market, By Type, 2019–2027 ($Thousand)
Table 30.Germany Graphene Market, By Application, 2019–2027 ($Thousand)
Table 31.Uk Graphene Market, By Type, 2019–2027 ($Thousand)
Table 32.Uk Graphene Market, By Application, 2019–2027 ($Thousand)
Table 33.France Graphene Market, By Type, 2019–2027 ($Thousand)
Table 34.France Graphene Market, By Application, 2019–2027 ($Thousand)
Table 35.Italy Graphene Market, By Type, 2019–2027 ($Thousand)
Table 36.Italy Graphene Market, By Application, 2019–2027 ($Thousand)
Table 37.Spain Graphene Market, By Type, 2019–2027 ($Thousand)
Table 38.Spain Graphene Market, By Application, 2019–2027 ($Thousand)
Table 39.Rest Of Europe Graphene Market, By Type, 2019–2027 ($Thousand)
Table 40.Rest Of Europe Graphene Market, By Application, 2019–2027 ($Thousand)
Table 41.Asia-pacific Graphene Market, By Type, 2019–2027 ($Thousand)
Table 42.Asia-pacific Graphene Market, By Application, 2019–2027 ($Thousand)
Table 43.Asia-pacific Graphene Market, By Country 2019–2027 ($Thousand)
Table 44.China Graphene Market, By Type, 2019–2027 ($Thousand)
Table 45.China Graphene Market, By Application, 2019–2027 ($Thousand)
Table 46.Japan Graphene Market, By Type, 2019–2027 ($Thousand)
Table 47.Japan Graphene Market, By Application, 2019–2027 ($Thousand)
Table 48.India Graphene Market, By Type, 2019–2027 ($Thousand)
Table 49.India Graphene Market, By Application, 2019–2027 ($Thousand)
Table 50.South Korea Graphene Market, By Type, 2019–2027 ($Thousand)
Table 51.South Korea Graphene Market, By Application, 2019–2027 ($Thousand)
Table 52.Australia Graphene Market, By Type, 2019–2027 ($Thousand)
Table 53.Australia Graphene Market, By Application, 2019–2027 ($Thousand)
Table 54.Rest Of Asia-pacific Graphene Market, By Type, 2019–2027 ($Thousand)
Table 55.Rest Of Asia-pacific Graphene Market, By Application, 2019–2027 ($Thousand)
Table 56.Lamea Graphene Market, By Type, 2019–2027 ($Thousand)
Table 57.Lamea Graphene Market, By Application, 2019–2027 ($Thousand)
Table 58.Lamea Graphene Market, By Country 2019–2027 ($Thousand)
Table 59.Brazil Graphene Market, By Type, 2019–2027 ($Thousand)
Table 60.Brazil Graphene Market, By Application, 2019–2027 ($Thousand)
Table 61.Saudi Arabia Graphene Market, By Type, 2019–2027 ($Thousand)
Table 62.Saudi Arabia Graphene Market, By Application, 2019–2027 ($Thousand)
Table 63.South Africa Graphene Market, By Type, 2019–2027 ($Thousand)
Table 64.South Africa Graphene Market, By Application, 2019–2027 ($Thousand)
Table 65.Rest Of Lamea Graphene Market, By Type, 2019–2027 ($Thousand)
Table 66.Rest Of Lamea Graphene Market, By Application, 2019–2027 ($Thousand)
Table 67.Key New Product Launches (2016-2020)
Table 68.Key Expansions (2016-2020)
Table 69.Key Mergers And Acquisition (2016-2020)
Table 70.Acs: Company Snapshot
Table 71.Acs: Product Portfolio
Table 72.Acs: Key Strategic Moves And Developments
Table 73.Bgt: Company Snapshot
Table 74.Bgt: Product Portfolio
Table 75.Cvd: Company Snapshot
Table 76.Cvd: Operating Segments
Table 77.Cvd: Product Portfolio
Table 78.Overall Financial Status ($Million)
Table 79.Graphene Nanochem: Company Snapshot
Table 80.Graphene Nanochem: Operating Segments
Table 81.Graphene Nanochem: Product Portfolio
Table 82.Graphenea: Company Snapshot
Table 83.Graphenea: Product Portfolio
Table 84.Graphenea: Key Strategic Moves And Developments
Table 85.G6 Materials: Company Snapshot
Table 86.G6 Materials: Product Portfolio
Table 87.Overall Financial Status ($Million)
Table 88.Haydale: Company Snapshot
Table 89.Haydale: Operating Segments
Table 90.Haydale: Product Portfolio
Table 91.Overall Financial Status ($Million)
Table 92.Haydale: Key Strategic Moves And Developments
Table 93.Nanotek: Company Snapshot
Table 94.Nanotek: Product Portfolio
Table 95.Vorbeck: Company Snapshot
Table 96.Vorbeck: Product Portfolio
Table 97.Vorbeck: Key Strategic Moves And Developments
Table 98.Xg Sciences: Company Snapshot
Table 99.Xg Sciences: Product Portfolio
Table 100.Overall Financial Status ($Million)
Table 101.Xg Sciences: Key Strategic Moves And Developments
List Of Figures
Figure 01.Global Graphene Market Segmentation
Figure 02.Top Investment Pockets, By Country (2018)
Figure 03.Moderate Bargaining Power Of Suppliers
Figure 04.Low Bargaining Power Of Buyers
Figure 05.Low Threat Of New Entrants
Figure 06.Low Threat Of Substitutes
Figure 07.High Intensity Of Competitive Rivalry
Figure 08.Graphene Market Dynamics
Figure 09.Biodegradable Plastic Market Overview
Figure 10.Patent Analysis, By Country
Figure 11.Patent Analysis, By Applicant
Figure 12.Patent Analysis, By Inventors
Figure 13.Comparative Analysis Of Graphene Market For Mono-layer & Bi-layer Graphene, By Country, 2019& 2027 ($Thousand)
Figure 14.Comparative Analysis Of Graphene Market For Few Layer Graphene (Flg), By Country, 2019& 2027 ($Thousand)
Figure 15.Comparative Analysis Of Graphene Market For Graphene Oxide (Go), By Country, 2019& 2027 ($Thousand)
Figure 16.Comparative Analysis Of Graphene Market For Graphene Nano Platelets (Gnp), By Country, 2019& 2027 ($Thousand)
Figure 17.Comparative Analysis Of Graphene Market For Rfid, By Country, 2019& 2027 ($Thousand)
Figure 18.Comparative Analysis Of Graphene Market For Composites, By Country, 2019& 2027 ($Thousand)
Figure 19.Comparative Analysis Of Graphene Market For Sensors, By Country, 2019& 2027 ($Thousand)
Figure 20.Comparative Analysis Of Graphene Market For Research & Development, By Country, 2019& 2027 ($Thousand)
Figure 21.Comparative Analysis Of Graphene Market For Energy Storage, By Country, 2019& 2027 ($Thousand)
Figure 22.Comparative Analysis Of Graphene Market For Functional Ink, By Country, 2019& 2027 ($Thousand)
Figure 23.Comparative Analysis Of Graphene Market For Polymer Additives, By Country, 2019& 2027 ($Thousand)
Figure 24.Market Player Positioning, 2018
Figure 25.Top Winning Strategies, By Year, 2016–2020
Figure 26.Top Winning Strategies, By Development, 2016–2020 (%)
Figure 27.Top Winning Strategies, By Company, 2016–2020
Figure 28.Product Mapping Of Top 10 Players
Figure 29.Competitive Dashboard
Figure 30.Competitive Heatmap Of Key Players
Figure 31.Cvd: Net Sales, 2017–2019 ($Million)
Figure 32.Cvd: Revenue Share By Segment, 2019 (%)
Figure 33.G6 Materials: Revenue, 2016–2018 ($Million)
Figure 34.Haydale: Revenue, 2017–2019 ($Million)
Figure 35.Haydale: Revenue Share By Segment, 2019 (%)
Figure 36.Haydale: Revenue Share By Region, 2019 (%)
Figure 37.Xg Sciences: Revenue, 2016–2018 ($Million)
$4904
$5160
$6746
HAVE A QUERY?
OUR CUSTOMER

SIMILAR REPORTS