0
U.S. (TOLL FREE)
+1 (315) 215-3225
Automative

0
U.S. (TOLL FREE)
+1 (315) 215-3225
Micro Inverter Market By Type (Single phase, Three phase), By Connection (Stand Alone, Grid Connected), By End User (Residential, Commercial): Global Opportunity Analysis and Industry Forecast, 2020-2030
Published Date: April 2022
|
Report Code: ALLI-Auto-1F88
Home | Market Reports | Business & Industrial| Energy & Utilities| Renewable & Alternative Energy
Micro Inverter Market By Type Single Phase Three Phase Connection Standalone Grid Connected Global Opportunity Analysis and Industry Forecast 2014 2022
BUY CHAPTERS

Micro Inverter Market By Type (Single phase, Three phase), By Connection (Stand Alone, Grid Connected), By End User (Residential, Commercial): Global Opportunity Analysis and Industry Forecast, 2020-2030

Code: ALLI-Auto-1F88
Report
April 2022
Pages:240
Allied Market Research
Buy Now with 15% Discount
DESCRIPTION
TABLE OF CONTENT
TABLES & FIGURES

Global Micro Inverter Market 

The global micro inverter market was valued at $2.43 billion in 2020, and is projected to reach $13.51 billion by 2030, registering a CAGR of 19.7% from 2021 to 2030.

Micro Inverter Market

 Micro inverter is basically a solar inverter that converts DC electrical energy generated from solar photovoltaic systems into AC electrical energy. In addition, it boosts the energy output of the system, increases the safety measures, and reduces future costs. Increase in demand for renewable energy and growth in the residential segment photovoltaic (PV) systems allows the users to switch to microinverters from traditional central and string inverters.

Growth of the global micro inverter market is driven by factors, such as technical advantages over other conventional solar inverter, design flexibility, and capabilities like producing maximum power from solar panels. In addition, surge in need for sustainable & clean energy on account of growing concerns regarding damaging greenhouse gases emissions boosts the market growth. However, increase in installation and maintenance costs restraints the market growth. On the contrary, rise in the number of solar PV installations for various applications across the globe fuels the market growth during the forecast period.

Micro Inverter Market By Type

The micro inverter market is segmented on the basis of type, connection, end user, and region. By type, it is classified into fan in single phase and three phase. Depending on connection, it is categorized into stand alone and grid connected. On the basis of end user, it is divided into residential and commercial.

Region wise, it is analyzed across North America (the U.S., Canada, and Mexico), Europe (the UK, Germany, France, and rest of Europe), Asia-Pacific (China, Japan, India, Australia, and rest of Asia-Pacific), and LAMEA (Latin America, the Middle East, and Africa). Asia-Pacific dominated the micro inverter market in 2020, and is projected to register significant growth rate during the forecast period, owing to growth in the grid connected segment. In addition, Asia-Pacific is expected to witnesses significant growth by the end of the forecast period, followed by North America. The key players operating in the market include ABB Group, Delta Energy Systems GmbH, Enphase Energy Inc., Involar, P & P Energy Technology Co Limited, ReneSola, Siemens AG, SMA Solar Technology AG, SolarEdge Technologies Inc., and SunPower Corporation.

Micro Inverter Market By End User

KEY BENEFITS FOR STAKEHOLDERS

  • This study comprises analytical depiction of the global micro inverter market size along with current trends and future estimations to depict imminent investment pockets.
  • The overall micro inverter market analysis is determined to understand the profitable trends to gain a stronger foothold.
  • The report presents information related to key drivers, restraints, and opportunities with a detailed impact analysis.
  • The current micro inverter market forecast is quantitatively analyzed from 2020 to 2030 to benchmark the financial competency.
  • Porter’s five forces analysis illustrates the potency of the buyers and the micro inverter market share of key vendors.
  • The report includes the market trends and the market share of key vendors.

Micro Inverter Market Segmentation

By Type

  • Single phase
  • Three phase

By Connection

  • Stand Alone
  • Grid Connected

By End User

  • Residential
  • Commercial

By Region

  • North America
  • Europe
  • Asia-Pacific
  • LAMEA

Key Market Players 

  • Involar
  • P and P Energy Technology Co Limited
  • Enphase Energy, Inc
  • ABB Group
  • SunPower Corporation
  • SMA Solar Technology AG
  • Delta Energy Systems GmbH
  • SolarEdge Technologies Inc.
  • ReneSola
  • Siemens A

 Scope of Micro Inverter Market Report

Report Metric

Details

Report Name

Micro Inverter Market

Market size value in 2020

USD 2.43 Billion

Revenue forecast in 2030

USD 13.51 billion

Growth Rate

19.7%

Base year considered

2020

Forecast Period

2021-2030

By Type

 
Single phase, Three phase

By Connection

 
Stand Alone, Grid Connected

Report Coverage

Revenue & volume forecast, company share, competitive landscape, growth factors, and trends

Segments Covered

By Type, Connection,  and Region

Geographic Regions Covered

North America, Europe, Asia Pacific, Latin America, Middle East & Africa

Frequently Asked Questions About This Report 

1. Do you provide chapter-wise report data?

Ans. Yes, we do provide the option to buy chapters in a report. We also can customize the report based on your specific requirements.

2. How big is the Micro Inverter Market?

Ans. Due to the COVID-19 pandemic, The global micro inverter market was valued at $2.43 billion in 2020, and is projected to reach $13.51 billion by 2030, registering a CAGR of 19.7% from 2021 to 2030.

3. Who are the key players available in the Micro Inverter Industry?

Ans. Some of the Major companies are ABB Group, Delta Energy Systems GmbH, Enphase Energy Inc., Involar, P & P Energy Technology Co Limited, ReneSola, Siemens AG, SMA Solar Technology AG, SolarEdge Technologies Inc., and SunPower Corporation.

4. Does the report provides covid-19 impact analysis?

Ans. Yes, the report includes a COVID-19 impact analysis. Also, it is further extended into every individual segment of the report.

CHAPTER 1:INTRODUCTION
1.1.Report description
1.2.Key market segments
1.3.Key benefits to the stakeholders
1.4.Research Methodology
1.4.1.Secondary research
1.4.2.Primary research
1.4.3.Analyst tools and models
CHAPTER 2:EXECUTIVE SUMMARY
2.1.Key findings of the study
2.2.CXO Perspective
CHAPTER 3:MARKET OVERVIEW
3.1.Market definition and scope
3.2.Key findings
3.2.1.Top investment pockets
3.3.Porter’s five forces analysis
3.4.Top player positioning
3.5.Market dynamics
3.5.1.Drivers
3.5.2.Restraints
3.5.3.Opportunities
3.6.COVID-19 Impact Analysis on the market
CHAPTER 4: MICRO INVERTER MARKET, BY TYPE
4.1 Overview
4.1.1 Market size and forecast
4.2 Single phase
4.2.1 Key market trends, growth factors and opportunities
4.2.2 Market size and forecast, by region
4.2.3 Market analysis by country
4.3 Three phase
4.3.1 Key market trends, growth factors and opportunities
4.3.2 Market size and forecast, by region
4.3.3 Market analysis by country
CHAPTER 5: MICRO INVERTER MARKET, BY CONNECTION
5.1 Overview
5.1.1 Market size and forecast
5.2 Stand Alone
5.2.1 Key market trends, growth factors and opportunities
5.2.2 Market size and forecast, by region
5.2.3 Market analysis by country
5.3 Grid Connected
5.3.1 Key market trends, growth factors and opportunities
5.3.2 Market size and forecast, by region
5.3.3 Market analysis by country
CHAPTER 6: MICRO INVERTER MARKET, BY END USER
6.1 Overview
6.1.1 Market size and forecast
6.2 Residential
6.2.1 Key market trends, growth factors and opportunities
6.2.2 Market size and forecast, by region
6.2.3 Market analysis by country
6.3 Commercial
6.3.1 Key market trends, growth factors and opportunities
6.3.2 Market size and forecast, by region
6.3.3 Market analysis by country
CHAPTER 7: MICRO INVERTER MARKET, BY REGION
7.1 Overview
7.1.1 Market size and forecast
7.2 North America
7.2.1 Key trends and opportunities
7.2.2 North America Market size and forecast, by Type
7.2.3 North America Market size and forecast, by Connection
7.2.4 North America Market size and forecast, by End User
7.2.5 North America Market size and forecast, by country
7.2.5.1 U.S.
7.2.5.1.1 Market size and forecast, by Type
7.2.5.1.2 Market size and forecast, by Connection
7.2.5.1.3 Market size and forecast, by End User
7.2.5.2 Canada
7.2.5.2.1 Market size and forecast, by Type
7.2.5.2.2 Market size and forecast, by Connection
7.2.5.2.3 Market size and forecast, by End User
7.2.5.3 Mexico
7.2.5.3.1 Market size and forecast, by Type
7.2.5.3.2 Market size and forecast, by Connection
7.2.5.3.3 Market size and forecast, by End User
7.3 Europe
7.3.1 Key trends and opportunities
7.3.2 Europe Market size and forecast, by Type
7.3.3 Europe Market size and forecast, by Connection
7.3.4 Europe Market size and forecast, by End User
7.3.5 Europe Market size and forecast, by country
7.3.5.1 U.K.
7.3.5.1.1 Market size and forecast, by Type
7.3.5.1.2 Market size and forecast, by Connection
7.3.5.1.3 Market size and forecast, by End User
7.3.5.2 Germany
7.3.5.2.1 Market size and forecast, by Type
7.3.5.2.2 Market size and forecast, by Connection
7.3.5.2.3 Market size and forecast, by End User
7.3.5.3 France
7.3.5.3.1 Market size and forecast, by Type
7.3.5.3.2 Market size and forecast, by Connection
7.3.5.3.3 Market size and forecast, by End User
7.3.5.4 Rest of Europe
7.3.5.4.1 Market size and forecast, by Type
7.3.5.4.2 Market size and forecast, by Connection
7.3.5.4.3 Market size and forecast, by End User
7.4 Asia-Pacific
7.4.1 Key trends and opportunities
7.4.2 Asia-Pacific Market size and forecast, by Type
7.4.3 Asia-Pacific Market size and forecast, by Connection
7.4.4 Asia-Pacific Market size and forecast, by End User
7.4.5 Asia-Pacific Market size and forecast, by country
7.4.5.1 China
7.4.5.1.1 Market size and forecast, by Type
7.4.5.1.2 Market size and forecast, by Connection
7.4.5.1.3 Market size and forecast, by End User
7.4.5.2 Japan
7.4.5.2.1 Market size and forecast, by Type
7.4.5.2.2 Market size and forecast, by Connection
7.4.5.2.3 Market size and forecast, by End User
7.4.5.3 India
7.4.5.3.1 Market size and forecast, by Type
7.4.5.3.2 Market size and forecast, by Connection
7.4.5.3.3 Market size and forecast, by End User
7.4.5.4 Australia
7.4.5.4.1 Market size and forecast, by Type
7.4.5.4.2 Market size and forecast, by Connection
7.4.5.4.3 Market size and forecast, by End User
7.4.5.5 Rest Of Asia Pacific
7.4.5.5.1 Market size and forecast, by Type
7.4.5.5.2 Market size and forecast, by Connection
7.4.5.5.3 Market size and forecast, by End User
7.5 LAMEA
7.5.1 Key trends and opportunities
7.5.2 LAMEA Market size and forecast, by Type
7.5.3 LAMEA Market size and forecast, by Connection
7.5.4 LAMEA Market size and forecast, by End User
7.5.5 LAMEA Market size and forecast, by country
7.5.5.1 Latin America
7.5.5.1.1 Market size and forecast, by Type
7.5.5.1.2 Market size and forecast, by Connection
7.5.5.1.3 Market size and forecast, by End User
7.5.5.2 Middle East
7.5.5.2.1 Market size and forecast, by Type
7.5.5.2.2 Market size and forecast, by Connection
7.5.5.2.3 Market size and forecast, by End User
7.5.5.3 Africa
7.5.5.3.1 Market size and forecast, by Type
7.5.5.3.2 Market size and forecast, by Connection
7.5.5.3.3 Market size and forecast, by End User
CHAPTER 8: COMPANY LANDSCAPE
8.1. Introduction
8.2. Top winning strategies
8.3. Product Mapping of Top 10 Player
8.4. Competitive Dashboard
8.5. Competitive Heatmap
8.6. Key developments
CHAPTER 9: COMPANY PROFILES
9.1 Involar
9.1.1 Company overview
9.1.2 Company snapshot
9.1.3 Operating business segments
9.1.4 Product portfolio
9.1.5 Business performance
9.1.6 Key strategic moves and developments
9.2 P and P Energy Technology Co Limited
9.2.1 Company overview
9.2.2 Company snapshot
9.2.3 Operating business segments
9.2.4 Product portfolio
9.2.5 Business performance
9.2.6 Key strategic moves and developments
9.3 Enphase Energy, Inc
9.3.1 Company overview
9.3.2 Company snapshot
9.3.3 Operating business segments
9.3.4 Product portfolio
9.3.5 Business performance
9.3.6 Key strategic moves and developments
9.4 ABB Group
9.4.1 Company overview
9.4.2 Company snapshot
9.4.3 Operating business segments
9.4.4 Product portfolio
9.4.5 Business performance
9.4.6 Key strategic moves and developments
9.5 SunPower Corporation
9.5.1 Company overview
9.5.2 Company snapshot
9.5.3 Operating business segments
9.5.4 Product portfolio
9.5.5 Business performance
9.5.6 Key strategic moves and developments
9.6 SMA Solar Technology AG
9.6.1 Company overview
9.6.2 Company snapshot
9.6.3 Operating business segments
9.6.4 Product portfolio
9.6.5 Business performance
9.6.6 Key strategic moves and developments
9.7 Delta Energy Systems GmbH
9.7.1 Company overview
9.7.2 Company snapshot
9.7.3 Operating business segments
9.7.4 Product portfolio
9.7.5 Business performance
9.7.6 Key strategic moves and developments
9.8 SolarEdge Technologies Inc.
9.8.1 Company overview
9.8.2 Company snapshot
9.8.3 Operating business segments
9.8.4 Product portfolio
9.8.5 Business performance
9.8.6 Key strategic moves and developments
9.9 ReneSola
9.9.1 Company overview
9.9.2 Company snapshot
9.9.3 Operating business segments
9.9.4 Product portfolio
9.9.5 Business performance
9.9.6 Key strategic moves and developments
9.10 Siemens AG
9.10.1 Company overview
9.10.2 Company snapshot
9.10.3 Operating business segments
9.10.4 Product portfolio
9.10.5 Business performance
9.10.6 Key strategic moves and development
LIST OF TABLES
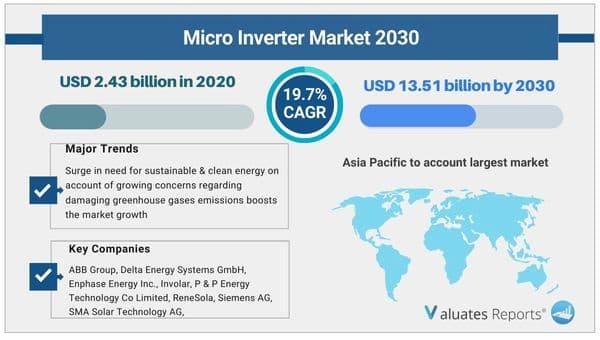
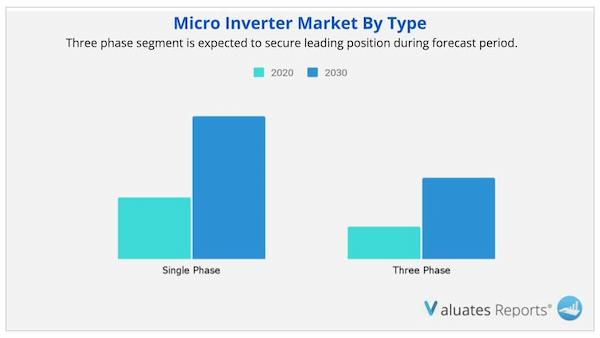
TABLE 1. GLOBAL MICRO INVERTER MARKET, BY TYPE, 2020-2030,($MILLION)
TABLE 2. MICRO INVERTER MARKET REVENUE, FOR SINGLE PHASE, BY REGION , 2020-2030,($MILLION)
TABLE 3. MICRO INVERTER MARKET SINGLE PHASE BY COUNTRY, 2020-2030,($MILLION)
TABLE 4. MICRO INVERTER MARKET REVENUE, FOR THREE PHASE, BY REGION , 2020-2030,($MILLION)
TABLE 5. MICRO INVERTER MARKET THREE PHASE BY COUNTRY, 2020-2030,($MILLION)
TABLE 6. GLOBAL MICRO INVERTER MARKET, BY CONNECTION, 2020-2030,($MILLION)
TABLE 7. MICRO INVERTER MARKET REVENUE, FOR STAND ALONE, BY REGION , 2020-2030,($MILLION)
TABLE 8. MICRO INVERTER MARKET STAND ALONE BY COUNTRY, 2020-2030,($MILLION)
TABLE 9. MICRO INVERTER MARKET REVENUE, FOR GRID CONNECTED, BY REGION , 2020-2030,($MILLION)
TABLE 10. MICRO INVERTER MARKET GRID CONNECTED BY COUNTRY, 2020-2030,($MILLION)
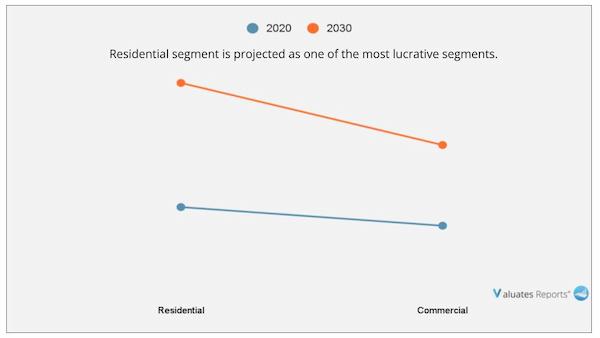
TABLE 11. GLOBAL MICRO INVERTER MARKET, BY END USER, 2020-2030,($MILLION)
TABLE 12. MICRO INVERTER MARKET REVENUE, FOR RESIDENTIAL, BY REGION , 2020-2030,($MILLION)
TABLE 13. MICRO INVERTER MARKET RESIDENTIAL BY COUNTRY, 2020-2030,($MILLION)
TABLE 14. MICRO INVERTER MARKET REVENUE, FOR COMMERCIAL, BY REGION , 2020-2030,($MILLION)
TABLE 15. MICRO INVERTER MARKET COMMERCIAL BY COUNTRY, 2020-2030,($MILLION)
TABLE 16. MICRO INVERTER MARKET, BY REGION, 2020-2030,($MILLION)
TABLE 17. NORTH AMERICA MICRO INVERTER MARKET, BY TYPE, 2020-2030,($MILLION)
TABLE 18. NORTH AMERICA MICRO INVERTER MARKET, BY CONNECTION, 2020-2030,($MILLION)
TABLE 19. NORTH AMERICA MICRO INVERTER MARKET, BY END USER, 2020-2030,($MILLION)
TABLE 20. NORTH AMERICA MICRO INVERTER MARKET, BY COUNTRY, 2020-2030,($MILLION)
TABLE 21. U.S. MICRO INVERTER MARKET BY TYPE 2020-2030,($MILLION)
TABLE 22. U.S. MICRO INVERTER MARKET BY CONNECTION 2020-2030,($MILLION)
TABLE 23. U.S. MICRO INVERTER MARKET BY END USER 2020-2030,($MILLION)
TABLE 24. CANADA MICRO INVERTER MARKET BY TYPE 2020-2030,($MILLION)
TABLE 25. CANADA MICRO INVERTER MARKET BY CONNECTION 2020-2030,($MILLION)
TABLE 26. CANADA MICRO INVERTER MARKET BY END USER 2020-2030,($MILLION)
TABLE 27. MEXICO MICRO INVERTER MARKET BY TYPE 2020-2030,($MILLION)
TABLE 28. MEXICO MICRO INVERTER MARKET BY CONNECTION 2020-2030,($MILLION)
TABLE 29. MEXICO MICRO INVERTER MARKET BY END USER 2020-2030,($MILLION)
TABLE 30. EUROPE MICRO INVERTER MARKET, BY TYPE, 2020-2030,($MILLION)
TABLE 31. EUROPE MICRO INVERTER MARKET, BY CONNECTION, 2020-2030,($MILLION)
TABLE 32. EUROPE MICRO INVERTER MARKET, BY END USER, 2020-2030,($MILLION)
TABLE 33. EUROPE MICRO INVERTER MARKET, BY COUNTRY, 2020-2030,($MILLION)
TABLE 34. U.K. MICRO INVERTER MARKET BY TYPE 2020-2030,($MILLION)
TABLE 35. U.K. MICRO INVERTER MARKET BY CONNECTION 2020-2030,($MILLION)
TABLE 36. U.K. MICRO INVERTER MARKET BY END USER 2020-2030,($MILLION)
TABLE 37. GERMANY MICRO INVERTER MARKET BY TYPE 2020-2030,($MILLION)
TABLE 38. GERMANY MICRO INVERTER MARKET BY CONNECTION 2020-2030,($MILLION)
TABLE 39. GERMANY MICRO INVERTER MARKET BY END USER 2020-2030,($MILLION)
TABLE 40. FRANCE MICRO INVERTER MARKET BY TYPE 2020-2030,($MILLION)
TABLE 41. FRANCE MICRO INVERTER MARKET BY CONNECTION 2020-2030,($MILLION)
TABLE 42. FRANCE MICRO INVERTER MARKET BY END USER 2020-2030,($MILLION)
TABLE 43. REST OF EUROPE MICRO INVERTER MARKET BY TYPE 2020-2030,($MILLION)
TABLE 44. REST OF EUROPE MICRO INVERTER MARKET BY CONNECTION 2020-2030,($MILLION)
TABLE 45. REST OF EUROPE MICRO INVERTER MARKET BY END USER 2020-2030,($MILLION)
TABLE 46. ASIA-PACIFIC MICRO INVERTER MARKET, BY TYPE, 2020-2030,($MILLION)
TABLE 47. ASIA-PACIFIC MICRO INVERTER MARKET, BY CONNECTION, 2020-2030,($MILLION)
TABLE 48. ASIA-PACIFIC MICRO INVERTER MARKET, BY END USER, 2020-2030,($MILLION)
TABLE 49. ASIA-PACIFIC MICRO INVERTER MARKET, BY COUNTRY, 2020-2030,($MILLION)
TABLE 50. CHINA MICRO INVERTER MARKET BY TYPE 2020-2030,($MILLION)
TABLE 51. CHINA MICRO INVERTER MARKET BY CONNECTION 2020-2030,($MILLION)
TABLE 52. CHINA MICRO INVERTER MARKET BY END USER 2020-2030,($MILLION)
TABLE 53. JAPAN MICRO INVERTER MARKET BY TYPE 2020-2030,($MILLION)
TABLE 54. JAPAN MICRO INVERTER MARKET BY CONNECTION 2020-2030,($MILLION)
TABLE 55. JAPAN MICRO INVERTER MARKET BY END USER 2020-2030,($MILLION)
TABLE 56. INDIA MICRO INVERTER MARKET BY TYPE 2020-2030,($MILLION)
TABLE 57. INDIA MICRO INVERTER MARKET BY CONNECTION 2020-2030,($MILLION)
TABLE 58. INDIA MICRO INVERTER MARKET BY END USER 2020-2030,($MILLION)
TABLE 59. AUSTRALIA MICRO INVERTER MARKET BY TYPE 2020-2030,($MILLION)
TABLE 60. AUSTRALIA MICRO INVERTER MARKET BY CONNECTION 2020-2030,($MILLION)
TABLE 61. AUSTRALIA MICRO INVERTER MARKET BY END USER 2020-2030,($MILLION)
TABLE 62. REST OF ASIA PACIFIC MICRO INVERTER MARKET BY TYPE 2020-2030,($MILLION)
TABLE 63. REST OF ASIA PACIFIC MICRO INVERTER MARKET BY CONNECTION 2020-2030,($MILLION)
TABLE 64. REST OF ASIA PACIFIC MICRO INVERTER MARKET BY END USER 2020-2030,($MILLION)
TABLE 65. LAMEA MICRO INVERTER MARKET, BY TYPE, 2020-2030,($MILLION)
TABLE 66. LAMEA MICRO INVERTER MARKET, BY CONNECTION, 2020-2030,($MILLION)
TABLE 67. LAMEA MICRO INVERTER MARKET, BY END USER, 2020-2030,($MILLION)
TABLE 68. LAMEA MICRO INVERTER MARKET, BY COUNTRY, 2020-2030,($MILLION)
TABLE 69. LATIN AMERICA MICRO INVERTER MARKET BY TYPE 2020-2030,($MILLION)
TABLE 70. LATIN AMERICA MICRO INVERTER MARKET BY CONNECTION 2020-2030,($MILLION)
TABLE 71. LATIN AMERICA MICRO INVERTER MARKET BY END USER 2020-2030,($MILLION)
TABLE 72. MIDDLE EAST MICRO INVERTER MARKET BY TYPE 2020-2030,($MILLION)
TABLE 73. MIDDLE EAST MICRO INVERTER MARKET BY CONNECTION 2020-2030,($MILLION)
TABLE 74. MIDDLE EAST MICRO INVERTER MARKET BY END USER 2020-2030,($MILLION)
TABLE 75. AFRICA MICRO INVERTER MARKET BY TYPE 2020-2030,($MILLION)
TABLE 76. AFRICA MICRO INVERTER MARKET BY CONNECTION 2020-2030,($MILLION)
TABLE 77. AFRICA MICRO INVERTER MARKET BY END USER 2020-2030,($MILLION)
TABLE 78.INVOLAR: COMPANY SNAPSHOT
TABLE 79.INVOLAR: OPERATING SEGMENTS
TABLE 80.INVOLAR: PRODUCT PORTFOLIO
TABLE 81.INVOLAR: NET SALES,
TABLE 82.INVOLAR: KEY STRATERGIES
TABLE 83.P AND P ENERGY TECHNOLOGY CO LIMITED: COMPANY SNAPSHOT
TABLE 84.P AND P ENERGY TECHNOLOGY CO LIMITED: OPERATING SEGMENTS
TABLE 85.P AND P ENERGY TECHNOLOGY CO LIMITED: PRODUCT PORTFOLIO
TABLE 86.P AND P ENERGY TECHNOLOGY CO LIMITED: NET SALES,
TABLE 87.P AND P ENERGY TECHNOLOGY CO LIMITED: KEY STRATERGIES
TABLE 88.ENPHASE ENERGY, INC: COMPANY SNAPSHOT
TABLE 89.ENPHASE ENERGY, INC: OPERATING SEGMENTS
TABLE 90.ENPHASE ENERGY, INC: PRODUCT PORTFOLIO
TABLE 91.ENPHASE ENERGY, INC: NET SALES,
TABLE 92.ENPHASE ENERGY, INC: KEY STRATERGIES
TABLE 93.ABB GROUP: COMPANY SNAPSHOT
TABLE 94.ABB GROUP: OPERATING SEGMENTS
TABLE 95.ABB GROUP: PRODUCT PORTFOLIO
TABLE 96.ABB GROUP: NET SALES,
TABLE 97.ABB GROUP: KEY STRATERGIES
TABLE 98.SUNPOWER CORPORATION: COMPANY SNAPSHOT
TABLE 99.SUNPOWER CORPORATION: OPERATING SEGMENTS
TABLE 100.SUNPOWER CORPORATION: PRODUCT PORTFOLIO
TABLE 101.SUNPOWER CORPORATION: NET SALES,
TABLE 102.SUNPOWER CORPORATION: KEY STRATERGIES
TABLE 103.SMA SOLAR TECHNOLOGY AG: COMPANY SNAPSHOT
TABLE 104.SMA SOLAR TECHNOLOGY AG: OPERATING SEGMENTS
TABLE 105.SMA SOLAR TECHNOLOGY AG: PRODUCT PORTFOLIO
TABLE 106.SMA SOLAR TECHNOLOGY AG: NET SALES,
TABLE 107.SMA SOLAR TECHNOLOGY AG: KEY STRATERGIES
TABLE 108.DELTA ENERGY SYSTEMS GMBH: COMPANY SNAPSHOT
TABLE 109.DELTA ENERGY SYSTEMS GMBH: OPERATING SEGMENTS
TABLE 110.DELTA ENERGY SYSTEMS GMBH: PRODUCT PORTFOLIO
TABLE 111.DELTA ENERGY SYSTEMS GMBH: NET SALES,
TABLE 112.DELTA ENERGY SYSTEMS GMBH: KEY STRATERGIES
TABLE 113.SOLAREDGE TECHNOLOGIES INC.: COMPANY SNAPSHOT
TABLE 114.SOLAREDGE TECHNOLOGIES INC.: OPERATING SEGMENTS
TABLE 115.SOLAREDGE TECHNOLOGIES INC.: PRODUCT PORTFOLIO
TABLE 116.SOLAREDGE TECHNOLOGIES INC.: NET SALES,
TABLE 117.SOLAREDGE TECHNOLOGIES INC.: KEY STRATERGIES
TABLE 118.RENESOLA: COMPANY SNAPSHOT
TABLE 119.RENESOLA: OPERATING SEGMENTS
TABLE 120.RENESOLA: PRODUCT PORTFOLIO
TABLE 121.RENESOLA: NET SALES,
TABLE 122.RENESOLA: KEY STRATERGIES
TABLE 123.SIEMENS AG: COMPANY SNAPSHOT
TABLE 124.SIEMENS AG: OPERATING SEGMENTS
TABLE 125.SIEMENS AG: PRODUCT PORTFOLIO
TABLE 126.SIEMENS AG: NET SALES,
TABLE 127.SIEMENS AG: KEY STRATERGIES LIST OF FIGURES
FIGURE 1.MICRO INVERTER MARKET SEGMENTATION
FIGURE 2.MICRO INVERTER MARKET,2020-2030
FIGURE 3.MICRO INVERTER MARKET,2020-2030
FIGURE 4. TOP INVESTMENT POCKETS, BY REGION
FIGURE 5.PORTER FIVE-1
FIGURE 6.PORTER FIVE-2
FIGURE 7.PORTER FIVE-3
FIGURE 8.PORTER FIVE-4
FIGURE 9.PORTER FIVE-5
FIGURE 10.TOP PLAYER POSITIONING
FIGURE 11.MICRO INVERTER MARKET:DRIVERS, RESTRAINTS AND OPPORTUNITIES
FIGURE 12.MICRO INVERTER MARKET,BY TYPE,2020(%)
FIGURE 13.COMPARATIVE SHARE ANALYSIS OF SINGLE PHASE MICRO INVERTER MARKET,2020-2030(%)
FIGURE 14.COMPARATIVE SHARE ANALYSIS OF THREE PHASE MICRO INVERTER MARKET,2020-2030(%)
FIGURE 15.MICRO INVERTER MARKET,BY CONNECTION,2020(%)
FIGURE 16.COMPARATIVE SHARE ANALYSIS OF STAND ALONE MICRO INVERTER MARKET,2020-2030(%)
FIGURE 17.COMPARATIVE SHARE ANALYSIS OF GRID CONNECTED MICRO INVERTER MARKET,2020-2030(%)
FIGURE 18.MICRO INVERTER MARKET,BY END USER,2020(%)
FIGURE 19.COMPARATIVE SHARE ANALYSIS OF RESIDENTIAL MICRO INVERTER MARKET,2020-2030(%)
FIGURE 20.COMPARATIVE SHARE ANALYSIS OF COMMERCIAL MICRO INVERTER MARKET,2020-2030(%)
FIGURE 21.MICRO INVERTER MARKET BY REGION,2020
FIGURE 22.U.S. MICRO INVERTER MARKET,2020-2030($MILLION)
FIGURE 23.CANADA MICRO INVERTER MARKET,2020-2030($MILLION)
FIGURE 24.MEXICO MICRO INVERTER MARKET,2020-2030($MILLION)
FIGURE 25.U.K. MICRO INVERTER MARKET,2020-2030($MILLION)
FIGURE 26.GERMANY MICRO INVERTER MARKET,2020-2030($MILLION)
FIGURE 27.FRANCE MICRO INVERTER MARKET,2020-2030($MILLION)
FIGURE 28.REST OF EUROPE MICRO INVERTER MARKET,2020-2030($MILLION)
FIGURE 29.CHINA MICRO INVERTER MARKET,2020-2030($MILLION)
FIGURE 30.JAPAN MICRO INVERTER MARKET,2020-2030($MILLION)
FIGURE 31.INDIA MICRO INVERTER MARKET,2020-2030($MILLION)
FIGURE 32.AUSTRALIA MICRO INVERTER MARKET,2020-2030($MILLION)
FIGURE 33.REST OF ASIA PACIFIC MICRO INVERTER MARKET,2020-2030($MILLION)
FIGURE 34.LATIN AMERICA MICRO INVERTER MARKET,2020-2030($MILLION)
FIGURE 35.MIDDLE EAST MICRO INVERTER MARKET,2020-2030($MILLION)
FIGURE 36.AFRICA MICRO INVERTER MARKET,2020-2030($MILLION)
FIGURE 37. TOP WINNING STRATEGIES, BY YEAR
FIGURE 38. TOP WINNING STRATEGIES, BY DEVELOPMENT
FIGURE 39. TOP WINNING STRATEGIES, BY COMPANY
FIGURE 40.PRODUCT MAPPING OF TOP 10 PLAYERS
FIGURE 41.COMPETITIVE DASHBOARD
FIGURE 42.COMPETITIVE HEATMAP OF TOP 10 KEY PLAYERS
FIGURE 43.INVOLAR.: NET SALES ,($MILLION)
FIGURE 44.P AND P ENERGY TECHNOLOGY CO LIMITED.: NET SALES ,($MILLION)
FIGURE 45.ENPHASE ENERGY, INC.: NET SALES ,($MILLION)
FIGURE 46.ABB GROUP.: NET SALES ,($MILLION)
FIGURE 47.SUNPOWER CORPORATION.: NET SALES ,($MILLION)
FIGURE 48.SMA SOLAR TECHNOLOGY AG.: NET SALES ,($MILLION)
FIGURE 49.DELTA ENERGY SYSTEMS GMBH.: NET SALES ,($MILLION)
FIGURE 50.SOLAREDGE TECHNOLOGIES INC..: NET SALES ,($MILLION)
FIGURE 51.RENESOLA.: NET SALES ,($MILLION)
FIGURE 52.SIEMENS AG.: NET SALES ,($MILLION
SELECT A FORMAT
Added to Cart
Electronic (PDF)

$5770

This license allows only one user to access the PDF.
Electronic (PDF)

$6450

This license allows 1 - 5 user to access the PDF, license is suitable for small groups of 5 users working together
Electronic (PDF)

$10995

This license allows users/teams in a same Enterprise to use this report, various departments within an enterpise can use this report
Electronic (PDF)

$3574

This license just provides quantitative data in a excel sheet
Add to Cart
Buy Now (15% Discount)

OUR CUSTOMER

Novocure

SIMILAR REPORTS