
The augmented and virtual reality market size was valued at $14.84 billion in 2020 and is projected to reach $454.73 billion by 2030, registering a Compound Annual Growth Rate (CAGR) of 40.7%.
Growing potential in the gaming sector is one of the main market drivers. Throughout the projection period, the augmented and virtual reality market will be fueled by the media and entertainment sectors. In the upcoming years, the market will rise primarily due to the aerospace and defense industries. The extensive use of augmented and virtual reality in the healthcare market will boost the sector's growth prospects in the future years. In the following years, the industry will develop faster due to the rise of AR and VR marketing. In the coming years, the manufacturing industry will fuel the market's needs. The education industry will undergo significant change, which will help the market grow in the future years.
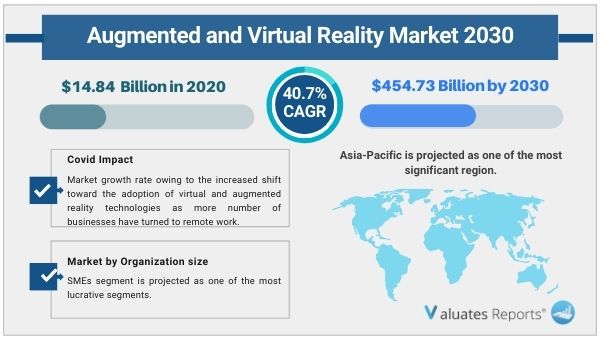
COVID-19 pandemic has significantly fostered the augmented and virtual reality market growth rate owing to the increased shift toward the adoption of virtual and augmented reality technologies as more businesses have turned to remote work. For instance, HTC announced to hold the 2021 developer conference online, and it is projected to still be conducted through VR.
Gamers now have access to a new level of immersion thanks to AR and VR technology. Due to the benefits of a real-world 3D experience that will alter users' gaming systems, the industry will develop significantly with the number of professional and amateur players on the rise. Since these technologies allow for seamless integration for real-time engagement, gamers are unable to distinguish between virtual and actual worlds. The ability to play as an online avatar and teleport to a gaming environment with virtual interactions with other players will cause the person's perception levels to increase. For the purpose of attracting more viewers and keeping them watching, developers are producing more specialized content. These elements collectively will fuel the market for augmented and virtual reality.
The way entertainment is delivered has significantly altered. Consumption patterns today differ significantly from those of the past. The position and speed of the balls, the weather, the history of the players, and other details may all be tracked in real time by Ar. While watching from the comfort of their homes, the audience will experience the game as if they were there. Using AR and VR-enabled apps, live music performances may be streamed and viewed from a distance. Print media can use 3D models, movies, and photographs for advertising. Customers will be able to scan AR billboards with their phones to get a really immersive experience. With seamless web connectivity, content can be altered to suit viewer preferences. This will boost the growth of the Augmented and Virtual Reality market during the forthcoming period.
The potential of AR and VR technologies in the creation of aerospace platforms and military systems has been recognized by engineers and designers. Virtual prototypes can be used by engineers to identify technical issues with wiring systems and aircraft bodies. The entire production process is impacted by the 3D design, which reduces costs and saves time. As a result, simpler designing processes, virtual assembly lines, and tighter integrations are produced. During the anticipated term, these variables will push the market for augmented and virtual reality.
The patient experience will be significantly enhanced by AR and VR by making it more enjoyable and interesting. By transporting them to a serene virtual setting during physical therapy sessions, virtual reality can help patients forget about uncomfortable treatment procedures. Better sleeping habits and psychological relief will result from this. Using wearables and tracking systems based on augmented reality, patients can also keep track of their vital signs. VR headsets can help people unwind and get over PTSD episodes. Complicated patient data will be visualized, improving understanding. Virtual figures that display the precise issue regions and identify flaws can be made directly from the patient's body. Virtual body mapping can help surgeons rehearse crucial surgical techniques in real-time by simulating them beforehand. In the upcoming years, the market for augmented and virtual reality will grow more rapidly as a result of all these causes.
Traditional advertising and marketing tactics become obsolete as urbanization, changing lifestyle preferences, and rising disposable income all increase. Because of the rising use of smartphones, the eCommerce sector is rapidly expanding. Retailers are now able to give customers a totally visual experience thanks to AR and VR-enabled digital signage. Customers may now view 3D live pictures of things that are in store, such as clothing and furniture, and immediately compare them based on their needs for their homes. Through virtual fits, customers can get a specialized response to their body measurements, sizes, and shapes. Moreover, embedded data analytics used in AR and VR collect massive amounts of user data and can offer comprehensive insights into each customer's complex purchasing process. These factors will drive the demand for the Augmented and Virtual Reality Market during the upcoming period.
Therefore, VR can be quite beneficial to the process of industrial manufacturing. Engineers and technicians can use a virtual representation of the created product to find the smallest variations that are typically invisible to the naked eye. By immediately directing a worker to the precise location of a specific inventory, AR can reduce the likelihood that they will become lost among the shelves' identical appearances. This boosts inventory management's effectiveness. VR can aid in the prediction of future risks and disruptions in the production processes, enhancing employee safety and security. The downtime and maintenance costs are decreased by real-time notifications. Better quality inspection and shorter time to market go hand in hand. By removing and detecting dangers ahead, AR/VR helps to prevent on-site mishaps.
Students will experience a fun, engaging, and interactive virtual reality simulation of a particular topic. Extended music, picture, and texts will be used to enrich existing realities. With the aid of virtual tours of historical landmarks and archaeological sites, teachers will be able to controllably convey complex subjects in the classroom. They will create a lasting impression on the minds of the students. Everything will be seen firsthand by students in the convenience of their homes or classrooms. The market for augmented and virtual reality will grow faster as a result in the next years.
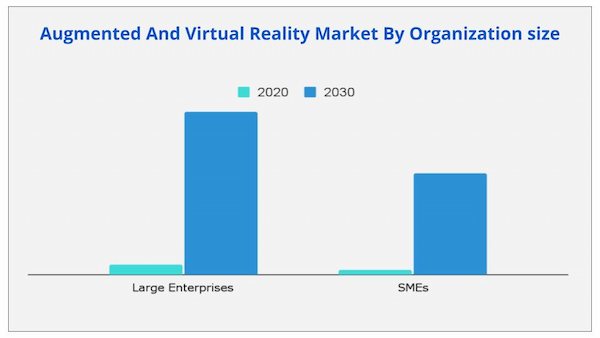
According to organization size, the major business segment in the augmented and virtual reality market had the largest growth in 2020, and it is anticipated that it would continue to hold sway in the years to come. This is a result of the expansion of augmented and virtual reality applications in the real estate, aerospace, construction, extractive industry, automotive, manufacturing, and healthcare sectors. However, due to the advantages of AR & VR technology including lower field staff training costs, quicker repairs, and higher customer satisfaction, the SME segment is anticipated to experience the largest growth.
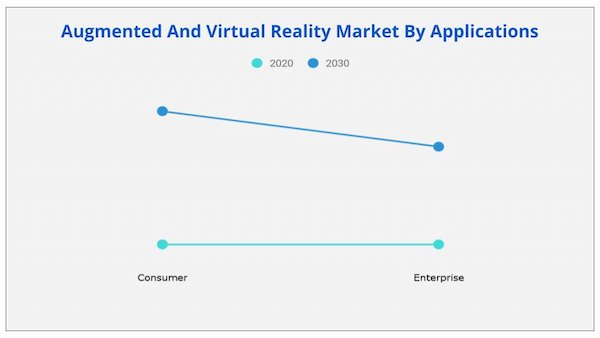
The consumer sector dominated the augmented and virtual reality market share by application in 2020, and it is anticipated that it will continue to do so in the years to come. However, aside from gaming and other consumer entertainment subsectors, the enterprise segment is anticipated to experience the strongest growth, as more businesses are implementing and testing AR and VR technology in a wide range of work-related applications.
Due to the demand from the gaming, entertainment & media, aerospace & defense, retail, and manufacturing industries, North America dominates the augmented and virtual reality market. Major players that provide cutting-edge solutions, such as Google, Facebook, DAQRI, and others, are also based in North America. Moreover, businesses in this area have made investments in simulation, AR, and VR. However, during the projection period, Asia-Pacific is anticipated to experience the fastest growth rate. The popularity of AR and VR in this region has been fueled by the introduction of 4G technology, high-speed communication, and an increase in smartphone users.
The global augmented and virtual reality market is segmented on the basis of organization size, application, industry vertical, and region. On the basis of organization size, the market is fragmented into large enterprises and small & medium-sized enterprises. In terms of application, the market is bifurcated into consumer and enterprise. Depending on industry vertical, it is segregated into gaming, entertainment & media, aerospace & defense, healthcare, education, manufacturing, retail, and others. Region wise, augmented and virtual reality industry is analyzed across North America, Europe, Asia-Pacific, and LAMEA.
The market for augmented and virtual reality was estimated to be worth $14.84 billion in 2020 and is anticipated to grow at a CAGR of 40.7% to reach $454.73 billion by 2030. It is anticipated that the current projection for 2030 will be greater than pre-COVID-19 forecasts. Due to an increased shift towards the adoption of virtual and augmented reality technology as more organizations have shifted to remote work, the COVID-19 pandemic has considerably accelerated the market growth rate for augmented and virtual reality. For instance, HTC declared that its 2021 developer conference would be hosted online and in virtual reality. On the other hand, the 2020 China Spring Cloud Car Show showcased cutting-edge technologies by combining augmented reality, big data, web 3D, panoramic content, and other technologies.
| Report Metric | Details |
| Report Name | Augmented and Virtual Reality Market |
| The market size in 2020 | USD 14.84 billion |
| The revenue forecast in 2030 | USD 454.73 billion |
| Growth Rate | CAGR 40.7% |
| Market size available for years | 2020-2030 |
| Forecast units | Value (USD) |
| Segments covered | Type, Application, Industry, Regions |
| Report coverage | Revenue & volume forecast, company share, competitive landscape, growth factors, and trends |
| Geographic regions covered | North America, Europe, Asia Pacific, Latin America, Middle East & Africa |
Ans. Growth of the mobile gaming industry and increase in internet connectivity act as the key drivers of the global AR and VR market.
Ans. By Organization size, SMEs segment is projected as one of the most lucrative segments.
Ans. The augmented and virtual reality market size was valued at $14.84 billion in 2020, and is projected to reach $454.73 billion by 2030
Ans. The global augmented and virtual reality market is estimated to grow with a Compound Annual Growth Rate (CAGR) of 40.7% during the forecast period.
Ans. North America dominates the augmented and virtual reality market due to the demand from gaming, entertainment & media, aerospace & defense, retail, and manufacturing industries
Ans. The forecast period for augmented and virtual reality market is 2021 to 2030
Ans. Major companies such as Alphabet (Google Inc.), DAQRI, Facebook, HTC, Magic Leap, Inc. Microsoft Corporation, Osterhout Design Group, Samsung Electronics, Co., Ltd. Sony Wikitude, Others
CHAPTER 1:INTRODUCTION
1.1.REPORT DESCRIPTION
1.2.KEY BENEFITS FOR STAKEHOLDERS
1.3.KEY MARKET SEGMENTS
1.3.1.Key market players
1.4.RESEARCH METHODOLOGY
1.4.1.Primary research
1.4.2.Secondary research
1.4.3.Analyst tools and models
CHAPTER 2:EXECUTIVE SUMMARY
2.1.CXO PERSPECTIVE
CHAPTER 3:MARKET OVERVIEW
3.1.MARKET DEFINITION AND SCOPE
3.2.KEY FINDINGS
3.2.1.Top impacting factors
3.2.2.Top investment pockets
3.3.PORTER’S FIVE FORCES ANALYSIS
3.4.MARKET DYNAMICS
3.4.1.Drivers
3.4.1.1.Expansion in gamer community
3.4.1.2.Increase in smartphone penetration
3.4.1.3.Cost-efficient benefits of augmented and virtual reality-based solutions
3.4.2.Restraints
3.4.2.1.Resistance to adopt the augmented and virtual reality technology in underdeveloped areas
3.4.2.2.Lack of good user experience design
3.4.3.Opportunities
3.4.3.1.Advancement of technology
3.4.3.2.Rising adoption of AR VR by enterprises
3.5.COVID-19 IMPACT ANALYSIS
3.5.1.Impact on market size
3.5.2.Consumer trends, preferences, and budget impact
3.5.3.Economic impact
3.5.4.Regulatory framework
3.5.5.Key player strategies to tackle negative impact
3.5.6.Opportunity window
CHAPTER 4:GLOBAL AUGMENTED AND VIRTUAL REALITY MARKET, BY ORGANIZATION SIZE
4.1.OVERVIEW
4.2.LARGE ENTERPRISES
4.2.1.Key market trends, growth factors, and opportunities
4.2.2.Market size and forecast, by region
4.2.3.Market analysis, by country
4.3.SMALL AND MEDIUM SIZED ENTERPRISES
4.3.1.Key market trends, growth factors, and opportunities
4.3.2.Market size and forecast, by region
4.3.3.Market analysis, by country
CHAPTER 5:GLOBAL AUGMENTED AND VIRTUAL REALITY MARKET, BY APPLICATION
5.1.OVERVIEW
5.2.CONSUMER
5.2.1.Key market trends, growth factors, and opportunities
5.2.2.Market size and forecast, by region
5.2.3.Market analysis, by country
5.3.ENTERPRISE
5.3.1.Key market trends, growth factors, and opportunities
5.3.2.Market size and forecast, by region
5.3.3.Market analysis, by country
CHAPTER 6:GLOBAL AUGMENTED AND VIRTUAL REALITY MARKET, BY INDUSTRY VERTICAL
6.1.OVERVIEW
6.2.GAMING
6.2.1.Key market trends, growth factors, and opportunities
6.2.2.Market size and forecast, by region
6.2.3.Market analysis, by country
6.3.ENTERTAINMENT & MEDIA
6.3.1.Key market trends, growth factors, and opportunities
6.3.2.Market size and forecast, by region
6.3.3.Market analysis, by country
6.4.AEROSPACE & DEFENSE
6.4.1.Key market trends, growth factors, and opportunities
6.4.2.Market size and forecast, by region
6.4.3.Market analysis, by country
6.5.HEALTHCARE
6.5.1.Key market trends, growth factors, and opportunities
6.5.2.Market size and forecast, by region
6.5.3.Market analysis, by country
6.6.EDUCATION
6.6.1.Key market trends, growth factors, and opportunities
6.6.2.Market size and forecast, by region
6.6.3.Market analysis, by country
6.7.MANUFACTURING
6.7.1.Key market trends, growth factors, and opportunities
6.7.2.Market size and forecast, by region
6.7.3.Market analysis, by country
6.8.RETAIL
6.8.1.Key market trends, growth factors, and opportunities
6.8.2.Market size and forecast, by region
6.8.3.Market analysis, by country
6.9.OTHERS
6.9.1.Key market trends, growth factors, and opportunities
6.9.2.Market size and forecast, by region
6.9.3.Market analysis, by country
CHAPTER 7:AUGMENTED AND VIRTUAL REALITY MARKET, BY REGION
7.1.OVERVIEW
7.2.NORTH AMERICA
7.2.1.Key market trends, growth factors, and opportunities
7.2.2.Market size and forecast, by organization size
7.2.3.Market size and forecast, by application
7.2.4.Market size and forecast, by industry vertical
7.2.5.Market analysis by country
7.2.5.1.U.S.
7.2.5.1.1.Market size and forecast, by organization size
7.2.5.1.2.Market size and forecast, by application
7.2.5.1.3.Market size and forecast, by industry vertical
7.2.5.2.Canada
7.2.5.2.1.Market size and forecast, by organization size
7.2.5.2.2.Market size and forecast, by application
7.2.5.2.3.Market size and forecast, by industry vertical
7.3.EUROPE
7.3.1.Key market trends, growth factors, and opportunities
7.3.2.Market size and forecast, by organization size
7.3.3.Market size and forecast, by application
7.3.4.Market size and forecast, by industry vertical
7.3.5.Market analysis by country
7.3.5.1.UK
7.3.5.1.1.Market size and forecast, by organization size
7.3.5.1.2.Market size and forecast, by application
7.3.5.1.3.Market size and forecast, by industry vertical
7.3.5.2.France
7.3.5.2.1.Market size and forecast, by organization size
7.3.5.2.2.Market size and forecast, by application
7.3.5.2.3.Market size and forecast, by industry vertical
7.3.5.3.Germany
7.3.5.3.1.Market size and forecast, by organization size
7.3.5.3.2.Market size and forecast, by application
7.3.5.3.3.Market size and forecast, by industry vertical
7.3.5.4.Russia
7.3.5.4.1.Market size and forecast, by organization size
7.3.5.4.2.Market size and forecast, by application
7.3.5.4.3.Market size and forecast, by industry vertical
7.3.5.5.Rest of Europe
7.3.5.5.1.Market size and forecast, by organization size
7.3.5.5.2.Market size and forecast, by application
7.3.5.5.3.Market size and forecast, by industry vertical
7.4.ASIA-PACIFIC
7.4.1.Key market trends, growth factors, and opportunities
7.4.2.Market size and forecast, by organization size
7.4.3.Market size and forecast, by application
7.4.4.Market size and forecast, by industry vertical
7.4.5.Market analysis by country
7.4.5.1.China
7.4.5.1.1.Market size and forecast, by organization size
7.4.5.1.2.Market size and forecast, by application
7.4.5.1.3.Market size and forecast, by industry vertical
7.4.5.2.India
7.4.5.2.1.Market size and forecast, by organization size
7.4.5.2.2.Market size and forecast, by application
7.4.5.2.3.Market size and forecast, by industry vertical
7.4.5.3.Japan
7.4.5.3.1.Market size and forecast, by organization size
7.4.5.3.2.Market size and forecast, by application
7.4.5.3.3.Market size and forecast, by industry vertical
7.4.5.4.South Korea
7.4.5.4.1.Market size and forecast, by organization size
7.4.5.4.2.Market size and forecast, by application
7.4.5.4.3.Market size and forecast, by industry vertical
7.4.5.5.Rest of Asia-Pacific
7.4.5.5.1.Market size and forecast, by organization size
7.4.5.5.2.Market size and forecast, by application
7.4.5.5.3.Market size and forecast, by industry vertical
7.5.LAMEA
7.5.1.Key market trends, growth factors, and opportunities
7.5.2.Market size and forecast, by organization size
7.5.3.Market size and forecast, by application
7.5.4.Market size and forecast, by industry vertical
7.5.5.Market analysis by country
7.5.5.1.Latin America
7.5.5.1.1.Market size and forecast, by organization size
7.5.5.1.2.Market size and forecast, by application
7.5.5.1.3.Market size and forecast, by industry vertical
7.5.5.2.Middle East
7.5.5.2.1.Market size and forecast, by organization size
7.5.5.2.2.Market size and forecast, by application
7.5.5.2.3.Market size and forecast, by industry vertical
7.5.5.3.Africa
7.5.5.3.1.Market size and forecast, by organization size
7.5.5.3.2.Market size and forecast, by application
7.5.5.3.3.Market size and forecast, by industry vertical
CHAPTER 8:COMPETITIVE LANDSCAPE
8.1.INTRODUCTION
8.1.1.Market player positioning, 2020
8.2.TOP WINNING STRATEGIES
8.3.COMPETITIVE DASHBOARD
8.4.COMPETITIVE HEATMAP
CHAPTER 9:COMPANY PROFILES
9.1.ALPHABET (GOOGLE INC.)
9.1.1.Company overview
9.1.2.Key executive
9.1.3.Company snapshot
9.1.4.Operating business segments
9.1.5.Product portfolio
9.1.6.R&D expenditure
9.1.7.Business performance
9.1.8.Key strategic moves and developments
9.2.DAQRI
9.2.1.Company overview
9.2.2.Key executive
9.2.3.Company snapshot
9.2.4.Product portfolio
9.2.5.Key strategic moves and developments
9.3.FACEBOOK INC.,
9.3.1.Company overview
9.3.2.Key executives
9.3.3.Company snapshot
9.3.4.Operating business segments
9.3.5.Product portfolio
9.3.6.R&D expenditure
9.3.7.Business performance
9.3.8.Key strategic moves and developments
9.4.HTC CORPORATION
9.4.1.Company overview
9.4.2.Key executives
9.4.3.Company snapshot
9.4.4.Operating business segments
9.4.5.Product portfolio
9.4.6.R&D expenditure
9.4.7.Business performance
9.4.8.Key strategic moves and developments
9.5.MAGIC LEAP, INC.
9.5.1.Company overview
9.5.2.Key executive
9.5.3.Company snapshot
9.5.4.Product portfolio
9.5.5.Key strategic moves and developments
9.6.MICROSOFT CORPORATION
9.6.1.Company overview
9.6.2.Key executive
9.6.3.Company snapshot
9.6.4.Operating business segments
9.6.5.Product portfolio
9.6.6.R&D expenditure
9.6.7.Business performance
9.6.8.Key strategic moves and developments
9.7.OSTERHOUT DESIGN GROUP
9.7.1.Company overview
9.7.2.Key executive
9.7.3.Company snapshot
9.7.4.Product portfolio
9.7.5.Key strategic moves and developments
9.8.SONY CORPORATION
9.8.1.Company overview
9.8.2.Key executives
9.8.3.Company snapshot
9.8.4.Operating business segments
9.8.5.Product portfolio
9.8.6.R&D expenditure
9.8.7.Business performance
9.8.8.Key strategic moves and developments
9.9.SAMSUNG ELECTRONICS CO. LTD.
9.9.1.Company overview
9.9.2.Key executives
9.9.3.Company snapshot
9.9.4.Operating business segments
9.9.5.Product portfolio
9.9.6.R&D expenditure
9.9.7.Business performance
9.9.8.Key strategic moves and developments
9.10.WIKITUDE GMBH
9.10.1.Company overview
9.10.2.Key executives
9.10.3.Company snapshot
9.10.4.Operating business segments
9.10.5.Product portfolio
9.10.6.R&D expenditure
9.10.7.Business performance
9.10.8.Key strategic moves and developments
Table 01.Global Augmented And Virtual Reality Market, By Organization Size, 2020-2030 ($Billion)
Table 02.Augmented And Virtual Reality Market For Large Enterprises, By Region, 2020-2030 ($Billion)
Table 03.Augmented And Virtual Reality Market For Small And Medium-Sized Enterprises, By Region, 2020-2030 ($Billion)
Table 04.Global Augmented And Virtual Reality Market, By Application, 2020-2030 ($Billion)
Table 05.Augmented And Virtual Reality Market For Consumer, By Region, 2020-2030 ($Billion)
Table 06.Augmented And Virtual Reality Market For Enterprise, By Region, 2020-2030 ($Billion)
Table 07.Global Augmented And Virtual Reality Market, By Industry Vertical, 2020-2030 ($Billion)
Table 08.Augmented And Virtual Reality Market For Gaming, By Region, 2020-2030 ($Billion)
Table 09.Augmented And Virtual Reality Market For Entertainment & Media, By Region, 2020-2030 ($Billion)
Table 10.Augmented And Virtual Reality Market For Aerospace & Defense, By Region, 2020-2030 ($Billion)
Table 11.Augmented And Virtual Reality Market For Healthcare, By Region, 2020-2030 ($Billion)
Table 12.Augmented And Virtual Reality Market For Education, By Region, 2020-2030 ($Billion)
Table 13.Augmented And Virtual Reality Market For Manufacturing, By Region, 2020-2030 ($Billion)
Table 14.Augmented And Virtual Reality Market For Retail, By Region, 2020-2030 ($Billion)
Table 15.Augmented And Virtual Reality Market For Others, By Region, 2020-2030 ($Billion)
Table 16.Augmented And Virtual Reality Market Revenue, By Region, 2020–2030 ($Billion)
Table 17.North America Augmented And Virtual Reality Market, By Organization Size, 2020–2030 ($Billion)
Table 18.North America Augmented And Virtual Reality Market, By Application, 2020–2030 ($Billion)
Table 19.North America Augmented And Virtual Reality Market, By Industry Vertical, 2020–2030 ($Billion)
Table 20.North America Augmented And Virtual Reality Market, By Country, 2020-2030 ($Billion)
Table 21.U.S. Augmented And Virtual Reality Market, By Organization Size, 2020–2030 ($Billion)
Table 22.U.S. Augmented And Virtual Reality Market, By Application, 2020–2030 ($Billion)
Table 23.U.S. Augmented And Virtual Reality Market, By Industry Vertical, 2020–2030 ($Billion)
Table 24.Canada Augmented And Virtual Reality Market, By Organization Size, 2020–2030 ($Billion)
Table 25.Canada Augmented And Virtual Reality Market, By Application, 2020–2030 ($Billion)
Table 26.Canada Augmented And Virtual Reality Market, By Industry Vertical, 2020–2030 ($Billion)
Table 27.Europe Augmented And Virtual Reality Market, By Organization Size, 2020–2030 ($Billion)
Table 28.Europe Augmented And Virtual Reality Market, By Application, 2020–2030 ($Billion)
Table 29.Europe Augmented And Virtual Reality Market, By Industry Vertical, 2020–2030 ($Billion)
Table 30.Europe Augmented And Virtual Reality Market, By Country, 2020-2030 ($Billion)
Table 31.Uk Augmented And Virtual Reality Market, By Organization Size, 2020–2030 ($Billion)
Table 32.Uk Augmented And Virtual Reality Market, By Application, 2020–2030 ($Billion)
Table 33.Uk Augmented And Virtual Reality Market, By Industry Vertical, 2020–2030 ($Billion)
Table 34.France Augmented And Virtual Reality Market, By Organization Size, 2020–2030 ($Billion)
Table 35.France Augmented And Virtual Reality Market, By Application, 2020–2030 ($Billion)
Table 36.France Augmented And Virtual Reality Market, By Industry Vertical, 2020–2030 ($Billion)
Table 37.Germany Augmented And Virtual Reality Market, By Organization Size, 2020–2030 ($Billion)
Table 38.Germany Augmented And Virtual Reality Market, By Application, 2020–2030 ($Billion)
Table 39.Germany Augmented And Virtual Reality Market, By Industry Vertical, 2020–2030 ($Billion)
Table 40.Russia Augmented And Virtual Reality Market, By Organization Size, 2020–2030 ($Billion)
Table 41.Russia Augmented And Virtual Reality Market, By Application, 2020–2030 ($Billion)
Table 42.Russia Augmented And Virtual Reality Market, By Industry Vertical, 2020–2030 ($Billion)
Table 43.Rest Of Europe Augmented And Virtual Reality Market, By Organization Size, 2020–2030 ($Billion)
Table 44.Rest Of Europe Augmented And Virtual Reality Market, By Application, 2020–2030 ($Billion)
Table 45.Rest Of Europe Augmented And Virtual Reality Market, By Industry Vertical, 2020–2030 ($Billion)
Table 46.Asia-Pacific Augmented And Virtual Reality Market, By Organization Size, 2020–2030 ($Billion)
Table 47.Asia-Pacific Augmented And Virtual Reality Market, By Application, 2020–2030 ($Billion)
Table 48.Asia-Pacific Augmented And Virtual Reality Market, By Industry Vertical, 2020–2030 ($Billion)
Table 49.Asia-Pacific Augmented And Virtual Reality Market, By Country, 2020-2030 ($Billion)
Table 50.China Augmented And Virtual Reality Market, By Organization Size, 2020–2030 ($Billion)
Table 51.China Augmented And Virtual Reality Market, By Application, 2020–2030 ($Billion)
Table 52.China Augmented And Virtual Reality Market, By Industry Vertical, 2020–2030 ($Billion)
Table 53.India Augmented And Virtual Reality Market, By Organization Size, 2020–2030 ($Billion)
Table 54.India Augmented And Virtual Reality Market, By Application, 2020–2030 ($Billion)
Table 55.India Augmented And Virtual Reality Market, By Industry Vertical, 2020–2030 ($Billion)
Table 56.Japan Augmented And Virtual Reality Market, By Organization Size, 2020–2030 ($Billion)
Table 57.Japan Augmented And Virtual Reality Market, By Application, 2020–2030 ($Billion)
Table 58.Japan Augmented And Virtual Reality Market, By Industry Vertical, 2020–2030 ($Billion)
Table 59.South Korea Augmented And Virtual Reality Market, By Organization Size, 2020–2030 ($Billion)
Table 60.South Korea Augmented And Virtual Reality Market, By Application, 2020–2030 ($Billion)
Table 61.South Korea Augmented And Virtual Reality Market, By Industry Vertical, 2020–2030 ($Billion)
Table 62.Rest Of Asia-Pacific Augmented And Virtual Reality Market, By Organization Size, 2020–2030 ($Billion)
Table 63.Rest Of Asia-Pacific Augmented And Virtual Reality Market, By Application, 2020–2030 ($Billion)
Table 64.Rest Of Asia-Pacific Augmented And Virtual Reality Market, By Industry Vertical, 2020–2030 ($Billion)
Table 65.Lamea Augmented And Virtual Reality Market, By Organization Size, 2020–2030 ($Billion)
Table 66.Lamea Augmented And Virtual Reality Market, By Application, 2020–2030 ($Billion)
Table 67.Lamea Augmented And Virtual Reality Market, By Industry Vertical, 2020–2030 ($Billion)
Table 68.Lamea Augmented And Virtual Reality Market, By Country, 2020-2030 ($Billion)
Table 69.Latin America Augmented And Virtual Reality Market, By Organization Size, 2020–2030 ($Billion)
Table 70.Latin America Augmented And Virtual Reality Market, By Application, 2020–2030 ($Billion)
Table 71.Latin America Augmented And Virtual Reality Market, By Industry Vertical, 2020–2030 ($Billion)
Table 72.Middle East Augmented And Virtual Reality Market, By Organization Size, 2020–2030 ($Billion)
Table 73.Middle East Augmented And Virtual Reality Market, By Application, 2020–2030 ($Billion)
Table 74.Middle East Augmented And Virtual Reality Market, By Industry Vertical, 2020–2030 ($Billion)
Table 75.Africa Augmented And Virtual Reality Market, By Organization Size, 2020–2030 ($Billion)
Table 76.Africa Augmented And Virtual Reality Market, By Application, 2020–2030 ($Billion)
Table 77.Africa Augmented And Virtual Reality Market, By Industry Vertical, 2020–2030 ($Billion)
Table 78.Alphabet (Google Inc.): Key Executive
Table 79.Alphabet (Google Inc.): Company Snapshot
Table 80.Alphabet (Google Inc.): Product Category
Table 81.Alphabet (Google Inc.): Product Portfolio
Table 82.Daqri: Key Executive
Table 83.Daqri: Company Snapshot
Table 84.Daqri: Product Portfolio
Table 85.Daqri: Key Strategic Moves And Developments
Table 86.Facebook: Key Executives
Table 87.Facebook: Company Snapshot
Table 88.Facebook: Operating Segments
Table 89.Facebook: Product Portfolio
Table 90.Facebook: Key Strategic Moves And Developments
Table 91.Htc Corporation: Key Executives
Table 92.Htc Corporation: Company Snapshot
Table 93.Htc Corporation: Operating Segments
Table 94.Htc Corporation: Product Portfolio
Table 95.Htc Corporations: Key Strategic Moves And Development
Table 96.Magic Leap, Inc.: Key Executive
Table 97.Magic Leap, Inc.: Company Snapshot
Table 98.Magic Leap, Inc.: Product Portfolio
Table 99.Magic Leap, Inc.: Key Strategic Moves And Developments
Table 100.Microsoft Corporation: Key Executive
Table 101.Microsoft Corporation: Company Snapshot
Table 102.Microsoft Corporation: Operating Segments
Table 103.Microsoft Corporation: Product Portfolio
Table 104.Osterhout Design Group: Key Executive
Table 105.Osterhout Design Group: Company Snapshot
Table 106.Osterhout Design Group: Product Portfolio
Table 107.Osterhout Design Group: Key Strategic Moves And Developments
Table 108.Sony Corporation: Key Executives
Table 109.Sony Corporation: Company Snapshot
Table 110.Sony Corporation: Operating Segments
Table 111.Sony Corporation: Product Portfolio
Table 112.Sony Corporation: Key Strategic Moves And Developments
Table 113.Samsung Electronics Co. Ltd.: Key Executives
Table 114.Samsung Electronics Co. Ltd.: Company Snapshot
Table 115.Samsung Electronics Co. Ltd.: Operating Segments
Table 116.Samsung Electronics Co. Ltd.: Product Portfolio
Table 117.Samsung Electronics Co. Ltd.: Key Strategic Moves And Developments
Table 118.Wikitude Gmbh: Key Executives
Table 119.Wikitude Gmbh: Company Snapshot
Table 120.Qualcomm Technologies, Inc.: Product Category
Table 121.Wikitude Gmbh: Product Portfolio
Table 122.Wikitude Gmbh: Key Strategic Moves And Developments
List Of Figures
Figure 01.Key Market Segments
Figure 02.Augmented And Virtual Reality Market Snapshot, By Segmentation
Figure 03.Augmented And Virtual Reality Market Snapshot, By Region
Figure 04.Top Impacting Factors
Figure 05.High Bargaining Power Of Suppliers
Figure 06.Moderate To High Bargaining Power Of Buyers
Figure 07.Moderate-To-High Threat Of Substitutes
Figure 08.High Threat Of New Entrants
Figure 09.High Intensity Of Rivalry
Figure 10.Market Dynamics: Augmented And Virtual Reality Market
Figure 11.Global Augmented And Virtual Reality Market, By Organization Size, 2020-2030
Figure 12.Comparative Share Analysis Of Augmented And Virtual Reality Market For Large Enterprises, By Country, 2020 & 2030(%)
Figure 13.Comparative Share Analysis Of Augmented And Virtual Reality Market For Small And Medium Sized Enterprises, By Country, 2020 & 2030(%)
Figure 14.Global Augmented And Virtual Reality Market, By Application, 2020-2030
Figure 15.Comparative Share Analysis Of Augmented And Virtual Reality Market For Consumer, By Country, 2020 & 2030(%)
Figure 16.Comparative Share Analysis Of Augmented And Virtual Reality Market For Enterprise, By Country, 2020 & 2030(%)
Figure 17.Global Augmented And Virtual Reality Market, By Industry Vertical, 2020-2030
Figure 18.Comparative Share Analysis Of Augmented And Virtual Reality Market For Gaming, By Country, 2020 & 2030(%)
Figure 19.Comparative Share Analysis Of Augmented And Virtual Reality Market For Entertainment & Media, By Country, 2020 & 2030(%)
Figure 20.Comparative Share Analysis Of Augmented And Virtual Reality Market For Aerospace & Defense, By Country, 2020 & 2030(%)
Figure 21.Comparative Share Analysis Of Augmented And Virtual Reality Market For Healthcare, By Country, 2020 & 2030(%)
Figure 22.Comparative Share Analysis Of Augmented And Virtual Reality Market For Education, By Country, 2020 & 2030(%)
Figure 23.Comparative Share Analysis Of Augmented And Virtual Reality Market For Manufacturing, By Country, 2020 & 2030(%)
Figure 24.Comparative Share Analysis Of Augmented And Virtual Reality Market For Retail, By Country, 2020 & 2030(%)
Figure 25.Comparative Share Analysis Of Augmented And Virtual Reality Market For Others, By Country, 2020 & 2030(%)
Figure 26.U.S. Augmented And Virtual Reality Market, 2020–2030 ($Billion)
Figure 27.Canada Augmented And Virtual Reality Market, 2020–2030 ($Billion)
Figure 28.Uk Augmented And Virtual Reality Market, 2020–2030 ($Billion)
Figure 29.France Augmented And Virtual Reality Market, 2020–2030 ($Billion)
Figure 30.Germany Augmented And Virtual Reality Market, 2020–2030 ($Billion)
Figure 31.Russia Augmented And Virtual Reality Market, 2020–2030 ($Billion)
Figure 32.Rest Of Europe Augmented And Virtual Reality Market, 2020–2030 ($Billion)
Figure 33.China Augmented And Virtual Reality Market, 2020–2030 ($Billion)
Figure 34.India Augmented And Virtual Reality Market, 2020–2030 ($Billion)
Figure 35.Japan Augmented And Virtual Reality Market, 2020–2030 ($Billion)
Figure 36.South Korea Augmented And Virtual Reality Market, 2020–2030 ($Billion)
Figure 37.Rest Of Asia-Pacific Augmented And Virtual Reality Market, 2020–2030 ($Billion)
Figure 38.Latin America Augmented And Virtual Reality Market, 2020–2030 ($Billion)
Figure 39.Middle East Augmented And Virtual Reality Market, 2020–2030 ($Billion)
Figure 40.Africa Augmented And Virtual Reality Market, 2020–2030 ($Billion)
Figure 41.Market Player Positioning, 2020
Figure 42.Top Winning Strategies, By Year, 2017-2021*
Figure 43.Top Winning Strategies, By Development, 2017-2021*
Figure 44.Top Winning Strategies, By Company, 2017-2021*
Figure 45.Competitive Dashboard
Figure 46.Competitive Dashboard
Figure 47.Competitive Heatmap Of Key Players
Figure 48.R&D Expenditure, 2018–2020 ($Million)
Figure 49.Alphabet (Google Inc.): Revenue, 2018–2020 ($Million)
Figure 50.Alphabet (Google Inc.): Revenue Share By Segment, 2020 (%)
Figure 51.Alphabet (Google Inc.): Revenue Share By Geography, 2020 (%)
Figure 52.R&D Expenditure, 2018–2020 ($Million)
Figure 53.Facebook: Revenue, 2018–2020 ($Million)
Figure 54.Daqri: Revenue Share By Segment, 2020 (%)
Figure 55.Facebook: Revenue Share By Geography, 2020 (%)
Figure 56.R&D Expenditure, 2018–2020 ($Million)
Figure 57.Htc Corporation : Revenue, 2018–2020 ($Million)
Figure 58.Htc Corporation: Revenue Share By Segment, 2020 (%)
Figure 59.R&D Expenditure, 2018–2020 ($Million)
Figure 60.Microsoft Corporation: Revenue, 2018–2020 ($Million)
Figure 61.Microsoft Corporation: Revenue Share By Segment, 2020 (%)
Figure 62.Microsoft Corporation: Revenue Share By Geography, 2020 (%)
Figure 63.R&D Expenditure, 2018–2020 ($Million)
Figure 64.Sony Corporation: Revenue, 2018–2020 ($Million)
Figure 65.Sony Corporation: Revenue Share By Segment, 2020 (%)
Figure 66.Sony Corporation: Revenue Share By Geography, 2020 (%)
Figure 67.R&D Expenditure, 2017–2019 ($Million)
Figure 68.Samsung Electronics Co. Ltd.: Net Sales, 2017–2019 ($Million)
Figure 69.Samsung Electronics Co. Ltd.: Revenue Share By Segment, 2019 (%)
Figure 70.Samsung Electronics Co. Ltd.: Revenue Share By Region, 2019 (%)
Figure 71.R&D Expenditure, 2018-2020 ($Million)
Figure 72.Qualcomm Technologies, Inc.: Revenue, 2018–2020 ($Million)
Figure 73.Qualcomm Technologies, Inc.: Revenue Share By Segment, 2020 (%)
Figure 74.Qualcomm Technologies, Inc.: Revenue Share By Region, 2020 (%)
$6169
$6930
$10665
HAVE A QUERY?
OUR CUSTOMER

SIMILAR REPORTS
Add to Cart
Add to Cart
Add to Cart
Add to Cart