0
U.S. (TOLL FREE)
+1 (315) 215-3225
Automative

0
U.S. (TOLL FREE)
+1 (315) 215-3225
Acidity Regulators Market By Product Type (Citric Acid, Phosphoric Acid, Acetic Acid, Maleic Acid, Lactic Acid), By Application (Beverages, Sauces, Condiments, And Dressings, Processed Food, Bakery, Confectionery), : Global Opportunity Analysis and Industry Forecast, 2020-2031
Published Date: March 2022
|
Report Code: ALLI-Auto-4J116
Home | Market Reports | Business & Industrial| Chemicals Industry
Acidity Regulators Market by Product Citric Acid Phosphoric Acid Acetic Acid Maleic Acid and Lactic Acid and Application Beverages Sauces Condiments and Dressings Processed Food Bakery and Confectionery Global Opportunity Analysis and Industry Forecast 2014 2022
BUY CHAPTERS

Acidity Regulators Market By Product Type (Citric Acid, Phosphoric Acid, Acetic Acid, Maleic Acid, Lactic Acid), By Application (Beverages, Sauces, Condiments, And Dressings, Processed Food, Bakery, Confectionery), : Global Opportunity Analysis and Industry Forecast, 2020-2031

Code: ALLI-Auto-4J116
Report
March 2022
Pages:225
Allied Market Research
Buy Now with 15% Discount
DESCRIPTION
TABLE OF CONTENT
TABLES & FIGURES

Acidity Regulators Market Size

The global acidity regulators market was valued at $5,871.3 million in 2020, and is projected to reach $10,899.6 million by 2031, growing at a CAGR of 5.5% from 2022 to 2031. 

Acidity Regulators Market

Acidity Regulators Market

Acidity regulators are vital ingredients used in various food & beverages as food additives to maintain acidity or alkalinity of the food. Acidity regulators are organic acids or mineral acids, bases, neutralizing agents, and buffering agents. There are various acidity regulators available such as citric acid, phosphoric acid, acetic acid, maleic acid, and lactic acid with each ingredient having distinct properties and application. Acidity regulators further used as food preservative ingredients, which prevent food from microbial growth and hence increase the shelf life of various packaged food products such as cheese and meat. For instance, citric acid is used in various types of food products such as soft drinks, which break the cell membrane and break down the DNA protein, thus resisting the reproduction of microorganisms.
Acidity regulators are used as flavoring agents to give flavor to food products and to improve or enhance the taste. Acidity regulators are used in processed food, beverages, dairy products, bakery products, meat, and sea food.
Processed food such as pickles, juices, sauces, frozen vegetables and fruits, canned food, sun dried products, and dehydrated food have a deliberate change than their natural form before that are available to eat.
Beverages include alcoholic drinks (wine and bear) and nonalcoholic drinks such as juices, cold drink, carbonated drinks, and flavored drinks except water. These food products contain high amount of acidity regulators to modify the taste, increase the shelf life, and to prevent from the microbial growth.
Sauces, condiments, and dressings contain high amount of acidity regulators to modify the taste or to enhance the taste, to maintain acidity and basicity, and inhibit microbial growth in the food products.
Bakery products are floor-based, which are baked in the oven. Bakery products include bread, muffins, pizza, brownies, cakes, pastries, and snacks. They exhibit a prolonged shelf life due to acidity regulators.
Dairy products are made from milk, which contains high amount of calcium, proteins, and fat.
Dairy products have high risk of microbial attack due to presence of glucose or sucrose, which gives proper nutrients to microorganisms, so there is use of acidity regulators to increase the shelf life. Meat includes the flesh of chicken, pig, cow, and camel. Sea food includes the flesh of sea animals or whole sea animal like catfish, cod fish, and octopus.
Meat and sea food have small shelf life, as they have better environment and nutrient for the growth of microorganisms. Thus, acidity regulators play an important role to control the taste, acidity, and alkalinity and growth of microorganisms. Acidity regulators are used on a large scale in food industry.
The global acidity regulators market is segmented on the basis of product type, application, and region. Depending on product type, the market is classified into citric acid, phosphoric acid, acetic acid, maleic acid, and lactic acid. On the basis of application, it is segregated into beverages; sauces, condiments, and dressings; processed food; bakery; and confectionery. Region wise, the market is studied across North America, Europe, Asia-Pacific, and LAMEA.
Major companies have adopted agreement, product launch, expansion, and merger strategies to sustain the intense market competition. Key players profiled in the report Archer Daniels Midland Company, Jungbunzlauer India Pvt. Ltd., Bertek Ingredient Incorporation, ATP group, Celrich Products Pvt. Ltd., Chemelco International B.V., F.B.C Industries Inc., and Fuerst Day Lawson Ltd.
Other players in the value chain include Cargill Incorporated, Kerry Group, Tate and Lyle plc, Corbion N.V., Univar, Brenntag A.G., and Innophos Holding Inc.

KEY BENEFITS FOR STAKEHOLDERS

This report provides a quantitative analysis of the market segments, current trends, estimations, and dynamics of the acidity regulators market analysis from 2020 to 2031 to identify the prevailing market opportunities.
The market research is offered along with information related to key drivers, restraints, and acidity regulators market opportunities.
Porter’s five forces analysis highlights the potency of buyers and suppliers to enable stakeholders make profit-oriented business decisions and strengthen their supplier–buyer network.
In-depth analysis of the acidity regulators market segmentation assists to determine the prevailing market opportunities.
Major countries in each region are mapped according to their revenue contribution to the global market industry.
Market player positioning facilitates benchmarking and provides a clear understanding of the present position of the market players.
The report includes the analysis of the regional as well as global acidity regulators market trends, key players, market segments, application areas, and acidity regulators market growth strategies.
KEY MARKET SEGMENTS
Rest of LAME

Scope of Acidity Regulators Market Report

Report Metric Details
Report Name Acidity Regulators Market
Accounted market size in 2020 $ 5,871.3 in million
Forecasted market size in 2031 $ 10,899.6 million
CAGR 5.5%
Base Year 2020
Forecasted years 2024 - 2031
By Product Type
  • Citric Acid
  • Phosphoric acid
  • Acetic Acid
  • Maleic Acid
  • Lactic Acid
By Application
  • Beverages
  • Sauces, Condiments, and Dressings
  • Processed Food
  • Bakery
  • Confectionery
By Region
  • North America (United States, Canada)
  • Europe (Germany, France, UK, Italy, Russia) Rest of Europe
  • Nordic Countries
  • Asia-Pacific (China, Japan, South Korea)
  • Southeast Asia (India, Australia)
  • Rest of Asia
  • Latin America (Mexico, Brazil)
  • Rest of Latin America
  • Middle East & Africa (Turkey, Saudi Arabia, UAE, Rest of MEA)
Forecast units USD million in value
Report coverage Revenue and volume forecast, company share, competitive landscape, growth factors and trends

FAQ for this report

How fast is Acidity Regulators Market growing?

Ans: The Acidity Regulators Market witnessing a CAGR of 5.5% during the forecast period 2024-2031.

What is the Acidity Regulators Market size in 2031?

Ans: The Acidity Regulators Market size in 2031 will be $ 10,899.6 million.

What are the Application segmentation covered in the Acidity Regulators Market report?

Ans: The Applications covered in the Acidity Regulators Market report are Beverages, Sauces, Condiments, and Dressings, Processed Food, Bakery, Confectionery

What are the Type segmentation covered in the Acidity Regulators Market report?

Ans: The Types covered in the Acidity Regulators Market report are Citric Acid, Phosphoric acid, Acetic Acid, Maleic Acid, Lactic Acid

CHAPTER 1:INTRODUCTION
1.1.Report description
1.2.Key market segments
1.3.Key benefits to the stakeholders
1.4.Research Methodology
1.4.1.Secondary research
1.4.2.Primary research
1.4.3.Analyst tools and models
CHAPTER 2:EXECUTIVE SUMMARY
2.1.Key findings of the study
2.2.CXO Perspective
CHAPTER 3:MARKET OVERVIEW
3.1.Market definition and scope
3.2.Key findings
3.2.1.Top investment pockets
3.3.Porter’s five forces analysis
3.4.Top player positioning
3.5.Market dynamics
3.5.1.Drivers
3.5.2.Restraints
3.5.3.Opportunities
3.6.COVID-19 Impact Analysis on the market
3.7.Pricing Analysis
CHAPTER 4: ACIDITY REGULATORS MARKET, BY PRODUCT TYPE
4.1 Overview
4.1.1 Market size and forecast
4.2 Citric Acid
4.2.1 Key market trends, growth factors and opportunities
4.2.2 Market size and forecast, by region
4.2.3 Market analysis by country
4.3 Phosphoric Acid
4.3.1 Key market trends, growth factors and opportunities
4.3.2 Market size and forecast, by region
4.3.3 Market analysis by country
4.4 Acetic Acid
4.4.1 Key market trends, growth factors and opportunities
4.4.2 Market size and forecast, by region
4.4.3 Market analysis by country
4.5 Maleic Acid
4.5.1 Key market trends, growth factors and opportunities
4.5.2 Market size and forecast, by region
4.5.3 Market analysis by country
4.6 Lactic Acid
4.6.1 Key market trends, growth factors and opportunities
4.6.2 Market size and forecast, by region
4.6.3 Market analysis by country
CHAPTER 5: ACIDITY REGULATORS MARKET, BY APPLICATION
5.1 Overview
5.1.1 Market size and forecast
5.2 Beverages
5.2.1 Key market trends, growth factors and opportunities
5.2.2 Market size and forecast, by region
5.2.3 Market analysis by country
5.3 Sauces, Condiments, And Dressings
5.3.1 Key market trends, growth factors and opportunities
5.3.2 Market size and forecast, by region
5.3.3 Market analysis by country
5.4 Processed Food
5.4.1 Key market trends, growth factors and opportunities
5.4.2 Market size and forecast, by region
5.4.3 Market analysis by country
5.5 Bakery
5.5.1 Key market trends, growth factors and opportunities
5.5.2 Market size and forecast, by region
5.5.3 Market analysis by country
5.6 Confectionery
5.6.1 Key market trends, growth factors and opportunities
5.6.2 Market size and forecast, by region
5.6.3 Market analysis by country
CHAPTER 6: ACIDITY REGULATORS MARKET, BY REGION
6.1 Overview
6.1.1 Market size and forecast
6.2 Asia-Pacific
6.2.1 Key trends and opportunities
6.2.2 Asia-Pacific Market size and forecast, by Product Type
6.2.3 Asia-Pacific Market size and forecast, by Application
6.2.4 Asia-Pacific Market size and forecast, by country
6.2.4.1 China
6.2.4.1.1 Market size and forecast, by Product Type
6.2.4.1.2 Market size and forecast, by Application
6.2.4.2 Japan
6.2.4.2.1 Market size and forecast, by Product Type
6.2.4.2.2 Market size and forecast, by Application
6.2.4.3 India
6.2.4.3.1 Market size and forecast, by Product Type
6.2.4.3.2 Market size and forecast, by Application
6.2.4.4 South Korea
6.2.4.4.1 Market size and forecast, by Product Type
6.2.4.4.2 Market size and forecast, by Application
6.2.4.5 Australia
6.2.4.5.1 Market size and forecast, by Product Type
6.2.4.5.2 Market size and forecast, by Application
6.2.4.6 Rest of Asia-Pacific
6.2.4.6.1 Market size and forecast, by Product Type
6.2.4.6.2 Market size and forecast, by Application
6.3 LAMEA
6.3.1 Key trends and opportunities
6.3.2 LAMEA Market size and forecast, by Product Type
6.3.3 LAMEA Market size and forecast, by Application
6.3.4 LAMEA Market size and forecast, by country
6.3.4.1 Brazil
6.3.4.1.1 Market size and forecast, by Product Type
6.3.4.1.2 Market size and forecast, by Application
6.3.4.2 South Africa
6.3.4.2.1 Market size and forecast, by Product Type
6.3.4.2.2 Market size and forecast, by Application
6.3.4.3 Saudi Arabia
6.3.4.3.1 Market size and forecast, by Product Type
6.3.4.3.2 Market size and forecast, by Application
6.3.4.4 Rest of LAMEA
6.3.4.4.1 Market size and forecast, by Product Type
6.3.4.4.2 Market size and forecast, by Application
6.4 North America
6.4.1 Key trends and opportunities
6.4.2 North America Market size and forecast, by Product Type
6.4.3 North America Market size and forecast, by Application
6.4.4 North America Market size and forecast, by country
6.4.4.1 U.S.
6.4.4.1.1 Market size and forecast, by Product Type
6.4.4.1.2 Market size and forecast, by Application
6.4.4.2 Canada
6.4.4.2.1 Market size and forecast, by Product Type
6.4.4.2.2 Market size and forecast, by Application
6.4.4.3 Mexico
6.4.4.3.1 Market size and forecast, by Product Type
6.4.4.3.2 Market size and forecast, by Application
6.5 Europe
6.5.1 Key trends and opportunities
6.5.2 Europe Market size and forecast, by Product Type
6.5.3 Europe Market size and forecast, by Application
6.5.4 Europe Market size and forecast, by country
6.5.4.1 U.K.
6.5.4.1.1 Market size and forecast, by Product Type
6.5.4.1.2 Market size and forecast, by Application
6.5.4.2 France
6.5.4.2.1 Market size and forecast, by Product Type
6.5.4.2.2 Market size and forecast, by Application
6.5.4.3 Germany
6.5.4.3.1 Market size and forecast, by Product Type
6.5.4.3.2 Market size and forecast, by Application
6.5.4.4 Spain
6.5.4.4.1 Market size and forecast, by Product Type
6.5.4.4.2 Market size and forecast, by Application
6.5.4.5 Italy
6.5.4.5.1 Market size and forecast, by Product Type
6.5.4.5.2 Market size and forecast, by Application
6.5.4.6 Rest of Europe
6.5.4.6.1 Market size and forecast, by Product Type
6.5.4.6.2 Market size and forecast, by Application
CHAPTER 7: COMPANY LANDSCAPE
7.1. Introduction
7.2. Top winning strategies
7.3. Product Mapping of Top 10 Player
7.4. Competitive Dashboard
7.5. Competitive Heatmap
7.6. Key developments
CHAPTER 8: COMPANY PROFILES
8.1 ATP group
8.1.1 Company overview
8.1.2 Company snapshot
8.1.3 Operating business segments
8.1.4 Product portfolio
8.1.5 Business performance
8.1.6 Key strategic moves and developments
8.2 Celrich Products Pvt. Ltd.
8.2.1 Company overview
8.2.2 Company snapshot
8.2.3 Operating business segments
8.2.4 Product portfolio
8.2.5 Business performance
8.2.6 Key strategic moves and developments
8.3 Chemelco International B.V.
8.3.1 Company overview
8.3.2 Company snapshot
8.3.3 Operating business segments
8.3.4 Product portfolio
8.3.5 Business performance
8.3.6 Key strategic moves and developments
8.4 F.B.C Industries Inc.
8.4.1 Company overview
8.4.2 Company snapshot
8.4.3 Operating business segments
8.4.4 Product portfolio
8.4.5 Business performance
8.4.6 Key strategic moves and developments
8.5 Fuerst Day Lawson Ltd
8.5.1 Company overview
8.5.2 Company snapshot
8.5.3 Operating business segments
8.5.4 Product portfolio
8.5.5 Business performance
8.5.6 Key strategic moves and developments
8.6 Cargill Incorporated
8.6.1 Company overview
8.6.2 Company snapshot
8.6.3 Operating business segments
8.6.4 Product portfolio
8.6.5 Business performance
8.6.6 Key strategic moves and developments
8.7 Kerry Group
8.7.1 Company overview
8.7.2 Company snapshot
8.7.3 Operating business segments
8.7.4 Product portfolio
8.7.5 Business performance
8.7.6 Key strategic moves and developments
8.8 Archer Daniels Midland Company
8.8.1 Company overview
8.8.2 Company snapshot
8.8.3 Operating business segments
8.8.4 Product portfolio
8.8.5 Business performance
8.8.6 Key strategic moves and developments
8.9 Jungbunzlauer India Pvt. Ltd.
8.9.1 Company overview
8.9.2 Company snapshot
8.9.3 Operating business segments
8.9.4 Product portfolio
8.9.5 Business performance
8.9.6 Key strategic moves and developments
8.10 Bertek Ingredient Incorporation
8.10.1 Company overview
8.10.2 Company snapshot
8.10.3 Operating business segments
8.10.4 Product portfolio
8.10.5 Business performance
8.10.6 Key strategic moves and development
LIST OF TABLES
TABLE 1. GLOBAL ACIDITY REGULATORS MARKET, BY PRODUCT TYPE, 2020-2031,($MILLION)
TABLE 2. ACIDITY REGULATORS MARKET REVENUE, FOR CITRIC ACID, BY REGION , 2020-2031,($MILLION)
TABLE 3. ACIDITY REGULATORS MARKET CITRIC ACID BY COUNTRY, 2020-2031,($MILLION)
TABLE 4. ACIDITY REGULATORS MARKET REVENUE, FOR PHOSPHORIC ACID, BY REGION , 2020-2031,($MILLION)
TABLE 5. ACIDITY REGULATORS MARKET PHOSPHORIC ACID BY COUNTRY, 2020-2031,($MILLION)
TABLE 6. ACIDITY REGULATORS MARKET REVENUE, FOR ACETIC ACID, BY REGION , 2020-2031,($MILLION)
TABLE 7. ACIDITY REGULATORS MARKET ACETIC ACID BY COUNTRY, 2020-2031,($MILLION)
TABLE 8. ACIDITY REGULATORS MARKET REVENUE, FOR MALEIC ACID, BY REGION , 2020-2031,($MILLION)
TABLE 9. ACIDITY REGULATORS MARKET MALEIC ACID BY COUNTRY, 2020-2031,($MILLION)
TABLE 10. ACIDITY REGULATORS MARKET REVENUE, FOR LACTIC ACID, BY REGION , 2020-2031,($MILLION)
TABLE 11. ACIDITY REGULATORS MARKET LACTIC ACID BY COUNTRY, 2020-2031,($MILLION)
TABLE 12. GLOBAL ACIDITY REGULATORS MARKET, BY APPLICATION, 2020-2031,($MILLION)
TABLE 13. ACIDITY REGULATORS MARKET REVENUE, FOR BEVERAGES, BY REGION , 2020-2031,($MILLION)
TABLE 14. ACIDITY REGULATORS MARKET BEVERAGES BY COUNTRY, 2020-2031,($MILLION)
TABLE 15. ACIDITY REGULATORS MARKET REVENUE, FOR SAUCES, CONDIMENTS, AND DRESSINGS, BY REGION , 2020-2031,($MILLION)
TABLE 16. ACIDITY REGULATORS MARKET SAUCES, CONDIMENTS, AND DRESSINGS BY COUNTRY, 2020-2031,($MILLION)
TABLE 17. ACIDITY REGULATORS MARKET REVENUE, FOR PROCESSED FOOD, BY REGION , 2020-2031,($MILLION)
TABLE 18. ACIDITY REGULATORS MARKET PROCESSED FOOD BY COUNTRY, 2020-2031,($MILLION)
TABLE 19. ACIDITY REGULATORS MARKET REVENUE, FOR BAKERY, BY REGION , 2020-2031,($MILLION)
TABLE 20. ACIDITY REGULATORS MARKET BAKERY BY COUNTRY, 2020-2031,($MILLION)
TABLE 21. ACIDITY REGULATORS MARKET REVENUE, FOR CONFECTIONERY, BY REGION , 2020-2031,($MILLION)
TABLE 22. ACIDITY REGULATORS MARKET CONFECTIONERY BY COUNTRY, 2020-2031,($MILLION)
TABLE 23. ACIDITY REGULATORS MARKET, BY REGION, 2020-2031,($MILLION)
TABLE 24. ASIA-PACIFIC ACIDITY REGULATORS MARKET, BY PRODUCT TYPE, 2020-2031,($MILLION)
TABLE 25. ASIA-PACIFIC ACIDITY REGULATORS MARKET, BY APPLICATION, 2020-2031,($MILLION)
TABLE 26. ASIA-PACIFIC ACIDITY REGULATORS MARKET, BY COUNTRY, 2020-2031,($MILLION)
TABLE 27. CHINA ACIDITY REGULATORS MARKET BY PRODUCT TYPE 2020-2031,($MILLION)
TABLE 28. CHINA ACIDITY REGULATORS MARKET BY APPLICATION 2020-2031,($MILLION)
TABLE 29. JAPAN ACIDITY REGULATORS MARKET BY PRODUCT TYPE 2020-2031,($MILLION)
TABLE 30. JAPAN ACIDITY REGULATORS MARKET BY APPLICATION 2020-2031,($MILLION)
TABLE 31. INDIA ACIDITY REGULATORS MARKET BY PRODUCT TYPE 2020-2031,($MILLION)
TABLE 32. INDIA ACIDITY REGULATORS MARKET BY APPLICATION 2020-2031,($MILLION)
TABLE 33. SOUTH KOREA ACIDITY REGULATORS MARKET BY PRODUCT TYPE 2020-2031,($MILLION)
TABLE 34. SOUTH KOREA ACIDITY REGULATORS MARKET BY APPLICATION 2020-2031,($MILLION)
TABLE 35. AUSTRALIA ACIDITY REGULATORS MARKET BY PRODUCT TYPE 2020-2031,($MILLION)
TABLE 36. AUSTRALIA ACIDITY REGULATORS MARKET BY APPLICATION 2020-2031,($MILLION)
TABLE 37. REST OF ASIA-PACIFIC ACIDITY REGULATORS MARKET BY PRODUCT TYPE 2020-2031,($MILLION)
TABLE 38. REST OF ASIA-PACIFIC ACIDITY REGULATORS MARKET BY APPLICATION 2020-2031,($MILLION)
TABLE 39. LAMEA ACIDITY REGULATORS MARKET, BY PRODUCT TYPE, 2020-2031,($MILLION)
TABLE 40. LAMEA ACIDITY REGULATORS MARKET, BY APPLICATION, 2020-2031,($MILLION)
TABLE 41. LAMEA ACIDITY REGULATORS MARKET, BY COUNTRY, 2020-2031,($MILLION)
TABLE 42. BRAZIL ACIDITY REGULATORS MARKET BY PRODUCT TYPE 2020-2031,($MILLION)
TABLE 43. BRAZIL ACIDITY REGULATORS MARKET BY APPLICATION 2020-2031,($MILLION)
TABLE 44. SOUTH AFRICA ACIDITY REGULATORS MARKET BY PRODUCT TYPE 2020-2031,($MILLION)
TABLE 45. SOUTH AFRICA ACIDITY REGULATORS MARKET BY APPLICATION 2020-2031,($MILLION)
TABLE 46. SAUDI ARABIA ACIDITY REGULATORS MARKET BY PRODUCT TYPE 2020-2031,($MILLION)
TABLE 47. SAUDI ARABIA ACIDITY REGULATORS MARKET BY APPLICATION 2020-2031,($MILLION)
TABLE 48. REST OF LAMEA ACIDITY REGULATORS MARKET BY PRODUCT TYPE 2020-2031,($MILLION)
TABLE 49. REST OF LAMEA ACIDITY REGULATORS MARKET BY APPLICATION 2020-2031,($MILLION)
TABLE 50. NORTH AMERICA ACIDITY REGULATORS MARKET, BY PRODUCT TYPE, 2020-2031,($MILLION)
TABLE 51. NORTH AMERICA ACIDITY REGULATORS MARKET, BY APPLICATION, 2020-2031,($MILLION)
TABLE 52. NORTH AMERICA ACIDITY REGULATORS MARKET, BY COUNTRY, 2020-2031,($MILLION)
TABLE 53. U.S. ACIDITY REGULATORS MARKET BY PRODUCT TYPE 2020-2031,($MILLION)
TABLE 54. U.S. ACIDITY REGULATORS MARKET BY APPLICATION 2020-2031,($MILLION)
TABLE 55. CANADA ACIDITY REGULATORS MARKET BY PRODUCT TYPE 2020-2031,($MILLION)
TABLE 56. CANADA ACIDITY REGULATORS MARKET BY APPLICATION 2020-2031,($MILLION)
TABLE 57. MEXICO ACIDITY REGULATORS MARKET BY PRODUCT TYPE 2020-2031,($MILLION)
TABLE 58. MEXICO ACIDITY REGULATORS MARKET BY APPLICATION 2020-2031,($MILLION)
TABLE 59. EUROPE ACIDITY REGULATORS MARKET, BY PRODUCT TYPE, 2020-2031,($MILLION)
TABLE 60. EUROPE ACIDITY REGULATORS MARKET, BY APPLICATION, 2020-2031,($MILLION)
TABLE 61. EUROPE ACIDITY REGULATORS MARKET, BY COUNTRY, 2020-2031,($MILLION)
TABLE 62. U.K. ACIDITY REGULATORS MARKET BY PRODUCT TYPE 2020-2031,($MILLION)
TABLE 63. U.K. ACIDITY REGULATORS MARKET BY APPLICATION 2020-2031,($MILLION)
TABLE 64. FRANCE ACIDITY REGULATORS MARKET BY PRODUCT TYPE 2020-2031,($MILLION)
TABLE 65. FRANCE ACIDITY REGULATORS MARKET BY APPLICATION 2020-2031,($MILLION)
TABLE 66. GERMANY ACIDITY REGULATORS MARKET BY PRODUCT TYPE 2020-2031,($MILLION)
TABLE 67. GERMANY ACIDITY REGULATORS MARKET BY APPLICATION 2020-2031,($MILLION)
TABLE 68. SPAIN ACIDITY REGULATORS MARKET BY PRODUCT TYPE 2020-2031,($MILLION)
TABLE 69. SPAIN ACIDITY REGULATORS MARKET BY APPLICATION 2020-2031,($MILLION)
TABLE 70. ITALY ACIDITY REGULATORS MARKET BY PRODUCT TYPE 2020-2031,($MILLION)
TABLE 71. ITALY ACIDITY REGULATORS MARKET BY APPLICATION 2020-2031,($MILLION)
TABLE 72. REST OF EUROPE ACIDITY REGULATORS MARKET BY PRODUCT TYPE 2020-2031,($MILLION)
TABLE 73. REST OF EUROPE ACIDITY REGULATORS MARKET BY APPLICATION 2020-2031,($MILLION)
TABLE 74.ATP GROUP: COMPANY SNAPSHOT
TABLE 75.ATP GROUP: OPERATING SEGMENTS
TABLE 76.ATP GROUP: PRODUCT PORTFOLIO
TABLE 77.ATP GROUP: NET SALES,
TABLE 78.ATP GROUP: KEY STRATERGIES
TABLE 79.CELRICH PRODUCTS PVT. LTD.: COMPANY SNAPSHOT
TABLE 80.CELRICH PRODUCTS PVT. LTD.: OPERATING SEGMENTS
TABLE 81.CELRICH PRODUCTS PVT. LTD.: PRODUCT PORTFOLIO
TABLE 82.CELRICH PRODUCTS PVT. LTD.: NET SALES,
TABLE 83.CELRICH PRODUCTS PVT. LTD.: KEY STRATERGIES
TABLE 84.CHEMELCO INTERNATIONAL B.V.: COMPANY SNAPSHOT
TABLE 85.CHEMELCO INTERNATIONAL B.V.: OPERATING SEGMENTS
TABLE 86.CHEMELCO INTERNATIONAL B.V.: PRODUCT PORTFOLIO
TABLE 87.CHEMELCO INTERNATIONAL B.V.: NET SALES,
TABLE 88.CHEMELCO INTERNATIONAL B.V.: KEY STRATERGIES
TABLE 89.F.B.C INDUSTRIES INC.: COMPANY SNAPSHOT
TABLE 90.F.B.C INDUSTRIES INC.: OPERATING SEGMENTS
TABLE 91.F.B.C INDUSTRIES INC.: PRODUCT PORTFOLIO
TABLE 92.F.B.C INDUSTRIES INC.: NET SALES,
TABLE 93.F.B.C INDUSTRIES INC.: KEY STRATERGIES
TABLE 94.FUERST DAY LAWSON LTD: COMPANY SNAPSHOT
TABLE 95.FUERST DAY LAWSON LTD: OPERATING SEGMENTS
TABLE 96.FUERST DAY LAWSON LTD: PRODUCT PORTFOLIO
TABLE 97.FUERST DAY LAWSON LTD: NET SALES,
TABLE 98.FUERST DAY LAWSON LTD: KEY STRATERGIES
TABLE 99.CARGILL INCORPORATED: COMPANY SNAPSHOT
TABLE 100.CARGILL INCORPORATED: OPERATING SEGMENTS
TABLE 101.CARGILL INCORPORATED: PRODUCT PORTFOLIO
TABLE 102.CARGILL INCORPORATED: NET SALES,
TABLE 103.CARGILL INCORPORATED: KEY STRATERGIES
TABLE 104.KERRY GROUP: COMPANY SNAPSHOT
TABLE 105.KERRY GROUP: OPERATING SEGMENTS
TABLE 106.KERRY GROUP: PRODUCT PORTFOLIO
TABLE 107.KERRY GROUP: NET SALES,
TABLE 108.KERRY GROUP: KEY STRATERGIES
TABLE 109.ARCHER DANIELS MIDLAND COMPANY: COMPANY SNAPSHOT
TABLE 110.ARCHER DANIELS MIDLAND COMPANY: OPERATING SEGMENTS
TABLE 111.ARCHER DANIELS MIDLAND COMPANY: PRODUCT PORTFOLIO
TABLE 112.ARCHER DANIELS MIDLAND COMPANY: NET SALES,
TABLE 113.ARCHER DANIELS MIDLAND COMPANY: KEY STRATERGIES
TABLE 114.JUNGBUNZLAUER INDIA PVT. LTD.: COMPANY SNAPSHOT
TABLE 115.JUNGBUNZLAUER INDIA PVT. LTD.: OPERATING SEGMENTS
TABLE 116.JUNGBUNZLAUER INDIA PVT. LTD.: PRODUCT PORTFOLIO
TABLE 117.JUNGBUNZLAUER INDIA PVT. LTD.: NET SALES,
TABLE 118.JUNGBUNZLAUER INDIA PVT. LTD.: KEY STRATERGIES
TABLE 119.BERTEK INGREDIENT INCORPORATION: COMPANY SNAPSHOT
TABLE 120.BERTEK INGREDIENT INCORPORATION: OPERATING SEGMENTS
TABLE 121.BERTEK INGREDIENT INCORPORATION: PRODUCT PORTFOLIO
TABLE 122.BERTEK INGREDIENT INCORPORATION: NET SALES,
TABLE 123.BERTEK INGREDIENT INCORPORATION: KEY STRATERGIES LIST OF FIGURES
FIGURE 1.ACIDITY REGULATORS MARKET SEGMENTATION
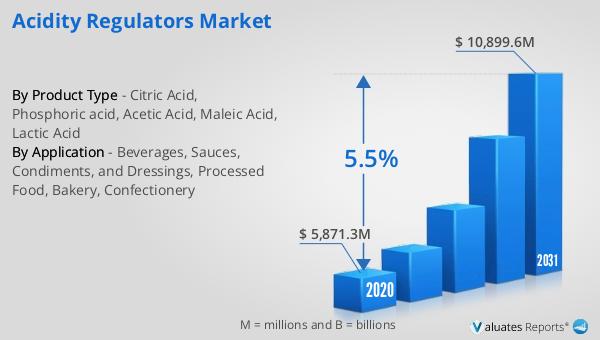
FIGURE 2.ACIDITY REGULATORS MARKET,2020-2031
FIGURE 3.ACIDITY REGULATORS MARKET,2020-2031
FIGURE 4. TOP INVESTMENT POCKETS, BY REGION
FIGURE 5.PORTER FIVE-1
FIGURE 6.PORTER FIVE-2
FIGURE 7.PORTER FIVE-3
FIGURE 8.PORTER FIVE-4
FIGURE 9.PORTER FIVE-5
FIGURE 10.TOP PLAYER POSITIONING
FIGURE 11.ACIDITY REGULATORS MARKET:DRIVERS, RESTRAINTS AND OPPORTUNITIES
FIGURE 11.ACIDITY REGULATORS MARKET,BY PRODUCT TYPE,2020(%)
FIGURE 12.COMPARATIVE SHARE ANALYSIS OF CITRIC ACID ACIDITY REGULATORS MARKET,2020-2031(%)
FIGURE 13.COMPARATIVE SHARE ANALYSIS OF PHOSPHORIC ACID ACIDITY REGULATORS MARKET,2020-2031(%)
FIGURE 14.COMPARATIVE SHARE ANALYSIS OF ACETIC ACID ACIDITY REGULATORS MARKET,2020-2031(%)
FIGURE 15.COMPARATIVE SHARE ANALYSIS OF MALEIC ACID ACIDITY REGULATORS MARKET,2020-2031(%)
FIGURE 16.COMPARATIVE SHARE ANALYSIS OF LACTIC ACID ACIDITY REGULATORS MARKET,2020-2031(%)
FIGURE 17.ACIDITY REGULATORS MARKET,BY APPLICATION,2020(%)
FIGURE 18.COMPARATIVE SHARE ANALYSIS OF BEVERAGES ACIDITY REGULATORS MARKET,2020-2031(%)
FIGURE 19.COMPARATIVE SHARE ANALYSIS OF SAUCES, CONDIMENTS, AND DRESSINGS ACIDITY REGULATORS MARKET,2020-2031(%)
FIGURE 20.COMPARATIVE SHARE ANALYSIS OF PROCESSED FOOD ACIDITY REGULATORS MARKET,2020-2031(%)
FIGURE 21.COMPARATIVE SHARE ANALYSIS OF BAKERY ACIDITY REGULATORS MARKET,2020-2031(%)
FIGURE 22.COMPARATIVE SHARE ANALYSIS OF CONFECTIONERY ACIDITY REGULATORS MARKET,2020-2031(%)
FIGURE 23.ACIDITY REGULATORS MARKET BY REGION,2020
FIGURE 24.CHINA ACIDITY REGULATORS MARKET,2020-2031($MILLION)
FIGURE 25.JAPAN ACIDITY REGULATORS MARKET,2020-2031($MILLION)
FIGURE 26.INDIA ACIDITY REGULATORS MARKET,2020-2031($MILLION)
FIGURE 27.SOUTH KOREA ACIDITY REGULATORS MARKET,2020-2031($MILLION)
FIGURE 28.AUSTRALIA ACIDITY REGULATORS MARKET,2020-2031($MILLION)
FIGURE 29.REST OF ASIA-PACIFIC ACIDITY REGULATORS MARKET,2020-2031($MILLION)
FIGURE 30.BRAZIL ACIDITY REGULATORS MARKET,2020-2031($MILLION)
FIGURE 31.SOUTH AFRICA ACIDITY REGULATORS MARKET,2020-2031($MILLION)
FIGURE 32.SAUDI ARABIA ACIDITY REGULATORS MARKET,2020-2031($MILLION)
FIGURE 33.REST OF LAMEA ACIDITY REGULATORS MARKET,2020-2031($MILLION)
FIGURE 34.U.S. ACIDITY REGULATORS MARKET,2020-2031($MILLION)
FIGURE 35.CANADA ACIDITY REGULATORS MARKET,2020-2031($MILLION)
FIGURE 36.MEXICO ACIDITY REGULATORS MARKET,2020-2031($MILLION)
FIGURE 37.U.K. ACIDITY REGULATORS MARKET,2020-2031($MILLION)
FIGURE 38.FRANCE ACIDITY REGULATORS MARKET,2020-2031($MILLION)
FIGURE 39.GERMANY ACIDITY REGULATORS MARKET,2020-2031($MILLION)
FIGURE 40.SPAIN ACIDITY REGULATORS MARKET,2020-2031($MILLION)
FIGURE 41.ITALY ACIDITY REGULATORS MARKET,2020-2031($MILLION)
FIGURE 42.REST OF EUROPE ACIDITY REGULATORS MARKET,2020-2031($MILLION)
FIGURE 43. TOP WINNING STRATEGIES, BY YEAR
FIGURE 44. TOP WINNING STRATEGIES, BY DEVELOPMENT
FIGURE 45. TOP WINNING STRATEGIES, BY COMPANY
FIGURE 46.PRODUCT MAPPING OF TOP 10 PLAYERS
FIGURE 47.COMPETITIVE DASHBOARD
FIGURE 48.COMPETITIVE HEATMAP OF TOP 10 KEY PLAYERS
FIGURE 49.ATP GROUP.: NET SALES ,($MILLION)
FIGURE 50.CELRICH PRODUCTS PVT. LTD..: NET SALES ,($MILLION)
FIGURE 51.CHEMELCO INTERNATIONAL B.V..: NET SALES ,($MILLION)
FIGURE 52.F.B.C INDUSTRIES INC..: NET SALES ,($MILLION)
FIGURE 53.FUERST DAY LAWSON LTD.: NET SALES ,($MILLION)
FIGURE 54.CARGILL INCORPORATED.: NET SALES ,($MILLION)
FIGURE 55.KERRY GROUP.: NET SALES ,($MILLION)
FIGURE 56.ARCHER DANIELS MIDLAND COMPANY.: NET SALES ,($MILLION)
FIGURE 57.JUNGBUNZLAUER INDIA PVT. LTD..: NET SALES ,($MILLION)
FIGURE 58.BERTEK INGREDIENT INCORPORATION.: NET SALES ,($MILLION
SELECT A FORMAT
Added to Cart
Electronic (PDF)

$5398

This license allows only one user to access the PDF.
Electronic (PDF)

$6004

This license allows 1 - 5 user to access the PDF, license is suitable for small groups of 5 users working together
Electronic (PDF)

$9373

This license allows users/teams in a same Enterprise to use this report, various departments within an enterpise can use this report
Electronic (PDF)

$3574

This license just provides quantitative data in a excel sheet
Add to Cart
Buy Now (15% Discount)

OUR CUSTOMER

Samsung SD

SIMILAR REPORTS


RELATED REPORTS

Global PVD Coating Material Market Research Report 2024

120 Pages
Type: Report
Code: QYRE-Auto-32N8296
Wed Apr 17 00:00:00 UTC 2024

Add to Cart

Global Poly(tetramethylene ether)glycol Market Research Report 2024

120 Pages
Type: Report
Code: QYRE-Auto-34S13095
Wed Apr 17 00:00:00 UTC 2024

Add to Cart

Global PTFE Products Market Research Report 2024

120 Pages
Type: Report
Code: QYRE-Auto-39B8269
Wed Apr 17 00:00:00 UTC 2024

Add to Cart

Global Formaldehyde Analyzer Market Research Report 2024

120 Pages
Type: Report
Code: QYRE-Auto-10G8465
Wed Apr 17 00:00:00 UTC 2024

Add to Cart