
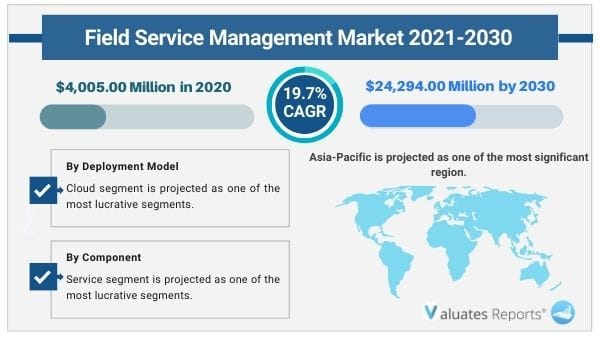
The global field service management market size was valued at US$ 4005.0 million in 2020 and is projected to reach US$ 24294.00 million by 2030 growing at a CAGR of 19.7% from 2021 to 2030. Key drivers of the field service management market include the increasing need to track activities in the field and the growing demand for mobility for real-time visibility.
Moreover, increasing adoption of digitization, innovative technologies, and widescale adoption among small-scale enterprises is expected to boost the growth of the field service management market. Further, covid 19 impact and the need for better onsite workforce management will boost the growth of the market in the future.
Field service management software helps organizations by tracking requests, scheduling, and managing the workforce. This increases efficiency saves time and resources. Moreover, real-time monitoring is important for enhanced customer service and satisfaction. Field service management solutions can also be integrated with ERP, CRM, and other systems for improving productivity, reducing labor costs. Thus the growing need for tracking field activities and the importance of real-time visibility will drive the growth of the field service management market during the forecast period.
The increasing adoption of AI, IoT, and rapid digitization will lead to faster onsite invoicing, cloud storage, dynamic scheduling, cost-efficient systems, a 360-degree view of customer choices, etc. This engages workers and helps in sustaining them for a longer period of time. Also AR, VR technologies will provide a virtual interactive platform where engineers can consult onsite technicians through the virtual project scenario. This will reduce workload, and speed up other business processes. They also reduce errors and fasten the delivery. Thus benefits of cutting-edge technologies and wide-scale adoption among small and medium scale enterprises will propel the growth of the field service management market during the forecast period.
Covid 19 has positively impacted the entire industry. Companies, governments, developers, and engineers are shifting to remote working models and are relying on digital collaboration tools such as field service management solutions, inventory management software to re-optimize schedules and plan projects. The surge in usage of online services for quality onsite workforce management is also boosting the demand for field service management software. Thus covid 19 impact and the need for quality on-site workforce management is driving the growth of the field service management market during the forecast period.
Based on organization size, the large-scale enterprise segment is expected to provide lucrative opportunities for growth in the field service management market share due to the increasing adoption of FSM solutions by large-scale enterprises for managing huge workforce, consumer records etc. However, the small and medium-scale enterprises will grow the fastest due to the increasing shift towards digital platforms for more efficiency.
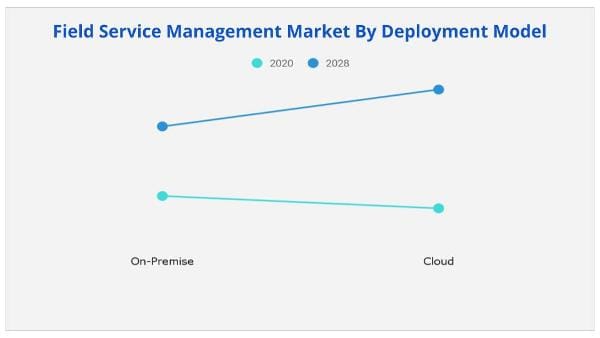
Based on the deployment model, the on-premise segment is expected to provide lucrative opportunities for growth in the field service management market share due to various benefits such as high data security, safety features offered to various industries. However, the cloud segment will grow the fastest as they are cheaper, efficient, secure to deploy and easy access.
Based on components, the solution segment is expected to provide lucrative opportunities for growth in the field service management market share due to the wide-scale adoption by various enterprises. However, the services segment will witness the highest growth due to better services provided by software provider companies to users of FSM solutions.
Based on industry verticals, the manufacturing segment is expected to provide lucrative opportunities for growth in the field service management market share due to rapid urbanization and automation of field services in the manufacturing industry. However, the energy and utility segment will grow the fastest during the forecast period due to the rising utilization of mobile-based field service management solutions.
Based on region, North America is expected to provide lucrative opportunities for growth in the field service management market share due to rapid innovation, streamlining of field operations, and presence of key players. While Asia- pacific will grow the fastest during the forecast period due to growing industrialization and adoption of FSM solutions for quality workforce management.
|
Report Metric |
Details |
|
Base Year: |
2020 |
|
Market Size in 2020: |
USD 4,005.00 Million |
|
Forecast Period: |
2021 to 2030 |
|
Forecast Period 2021 to 2030 CAGR: |
19.7% |
|
2030 Value Projection: |
USD 24,294.00 Million |
|
No. of Pages: |
305 |
|
Tables & Figures |
148 |
|
Charts |
78 |
|
Segments covered: |
Component, Deployment Mode, Organization Size, and Industry Vertical, Region |
Ans. Field Service Management Market was valued at USD 4,005.00 Million by 2020 and is projected to reach USD 24,294.00 Million in 2030, growing at a CAGR of 19.7% from 2021 to 2030.
Ans. Increasing adoption of digitization, innovative technologies and widescale adoption among small-scale enterprises is expected to boost the growth of the field service management market.
Ans. The Global Field Service Management Market is Segmented on the basis of Component, Deployment Mode, Organization Size, and Industry Vertical, Region.
Ans. The sample report for the Field Service Management Market can be obtained on demand from the website. Also, the 24*7 chat support & direct call services are provided to procure the sample report.
Ans. The key companies are Oracle Corporation, Microsoft, IFS AB, Salesforce.com Inc., ServiceMax, OverIT, Comarch SA, Infor, Praxedo, and SAP SE.
Ans. Region wise, the field service management market was dominated by North America. However, Asia-Pacific is expected to witness significant growth in the coming years.
CHAPTER 1: INTRODUCTION
1.1. Report description
1.2. Key benefits for stakeholders
1.3. Key market segments
1.4. Key market players
1.5. Research methodology
1.5.1. Secondary research
1.5.2. Primary research
1.5.3. Analyst tools & models
CHAPTER 2: EXECUTIVE SUMMARY
2.1. Key findings
2.1.1. Top impacting factors
2.1.2. Top investment pockets
2.2. CXO perspective
CHAPTER 3: MARKET OVERVIEW
3.1. Market definition and scope
3.2. Porter’s five forces analysis
3.3. Case Studies
3.3.1. Case Study 01
3.3.2. Case Study 02
3.4. Market dynamics
3.4.1. Drivers
3.4.1.1. The need to keep a track of activities taking place in the field
3.4.1.2. Rise in demand for mobility for getting real-time visibility
3.4.1.3. Increase in adoption of automation & digitalization in the field services industry
3.4.2. Restraint
3.4.2.1. Scarcity of skilled workforce to operate on FSM
3.4.3. Opportunities
3.4.3.1. Integration of AI, AR and VR in field services sector
3.4.3.2. Increase in adoption of IoT drives the adoption of cloud-based FSM solution
CHAPTER 4: FIELD SERVICE MANAGEMENT MARKET, BY COMPONENT
4.1. Overview
4.2. Solution
4.2.1. Key market trends, growth factors, and opportunities
4.2.2. Market size and forecast, by region
4.2.3. Market analysis by country
4.2.4. Field service management solution, by solution type
4.2.4.1. Schedule, Dispatch, and Route Optimization
4.2.4.2. Customer Management
4.2.4.3. Work Order Management
4.2.4.4. Inventory Management
4.2.4.5. Service Contract Management
4.2.4.6. Reporting and Analytics
4.2.4.7. Others
4.3. Services
4.3.1. Key market trends, growth factors and opportunities
4.3.2. Market size and forecast, by region
4.3.3. Market analysis by country
4.3.4. Field service management services market, by service type
4.3.4.1. Implementation & integration
4.3.4.2. Training & Support
4.3.4.3. Consulting
CHAPTER 5: FIELD SERVICE MANAGEMENT MARKET, BY DEPLOYMENT
5.1. Overview
5.2. On-Premise
5.2.1. Key market trends, growth factors, and opportunities
5.2.2. Market size and forecast, by region
5.2.3. Market analysis by country
5.3. Cloud
5.3.1. Key market trends, growth factors and opportunities
5.3.2. Market size and forecast, by region
5.3.3. Market analysis by country
CHAPTER 6: FIELD SERVICE MANAGEMENT MARKET, BY ORGANIZATION SIZE
6.1. Overview
6.2. Large enterprises
6.2.1. Key market trends, growth factors, and opportunities
6.2.2. Market size and forecast, by region
6.2.3. Market analysis, by country
6.3. SMEs
6.3.1. Key market trends, growth factors and opportunities
6.3.2. Market size and forecast, by region
6.3.3. Market analysis by country
CHAPTER 7: FIELD SERVICE MANAGEMENT MARKET, BY INDUSTRY VERTICAL
7.1. Overview
7.2. IT & Telecom
7.2.1. Key market trends, growth factors, and opportunities
7.2.2. Market size and forecast, by region
7.2.3. Market analysis, by country
7.3. Healthcare & Life Sciences
7.3.1. Key market trends, growth factors and opportunities
7.3.2. Market size and forecast, by region
7.3.3. Market analysis by country
7.4. Manufacturing
7.4.1. Key market trends, growth factors, and opportunities
7.4.2. Market size and forecast, by region
7.4.3. Market analysis, by country
7.5. BFSI
7.5.1. Key market trends, growth factors and opportunities
7.5.2. Market size and forecast, by region
7.5.3. Market analysis by country
7.6. Transportation & Logistics
7.6.1. Key market trends, growth factors, and opportunities
7.6.2. Market size and forecast, by region
7.6.3. Market analysis, by country
7.7. Energy & Utilities
7.7.1. Key market trends, growth factors and opportunities
7.7.2. Market size and forecast, by region
7.7.3. Market analysis by country
7.8. Construction
7.8.1. Key market trends, growth factors, and opportunities
7.8.2. Market size and forecast, by region
7.8.3. Market analysis, by country
7.9. Others
7.9.1. Key market trends, growth factors and opportunities
7.9.2. Market size and forecast, by region
7.9.3. Market analysis by country
CHAPTER 8: FIELD SERVICE MANAGEMENT MARKET, BY REGION
8.1. Overview
8.2. North America
8.2.1. Key market trends, growth factors and opportunities
8.2.2. Market size and forecast, by component
8.2.3. Market size and forecast, by deployment
8.2.4. Market size and forecast, by organization size
8.2.5. Market size and forecast, by industry vertical
8.2.6. Market analysis by country
8.2.6.1. U.S.
8.2.6.1.1. Market size and forecast, by component
8.2.6.1.2. Market size and forecast, by deployment
8.2.6.1.3. Market size and forecast, by organization size
8.2.6.1.4. Market size and forecast, by industry vertical
8.2.6.2. Canada
8.2.6.2.1. Market size and forecast, by component
8.2.6.2.2. Market size and forecast, by deployment
8.2.6.2.3. Market size and forecast, by organization size
8.2.6.2.4. Market size and forecast, by industry vertical
8.3. Europe
8.3.1. Key market trends, growth factors and opportunities
8.3.2. Market size and forecast, by component
8.3.3. Market size and forecast, by deployment
8.3.4. Market size and forecast, by organization size
8.3.5. Market size and forecast, by industry vertical
8.3.6. Market analysis by country
8.3.6.1. UK
8.3.6.1.1. Market size and forecast, by component
8.3.6.1.2. Market size and forecast, by deployment
8.3.6.1.3. Market size and forecast, by organization size
8.3.6.1.4. Market size and forecast, by industry vertical
8.3.6.2. Germany
8.3.6.2.1. Market size and forecast, by component
8.3.6.2.2. Market size and forecast, by deployment
8.3.6.2.3. Market size and forecast, by organization size
8.3.6.2.4. Market size and forecast, by industry vertical
8.3.6.3. France
8.3.6.3.1. Market size and forecast, by component
8.3.6.3.2. Market size and forecast, by deployment
8.3.6.3.3. Market size and forecast, by organization size
8.3.6.3.4. Market size and forecast, by industry vertical
8.3.6.4. Italy
8.3.6.4.1. Market size and forecast, by component
8.3.6.4.2. Market size and forecast, by deployment
8.3.6.4.3. Market size and forecast, by organization size
8.3.6.4.4. Market size and forecast, by industry vertical
8.3.6.5. Spain
8.3.6.5.1. Market size and forecast, by component
8.3.6.5.2. Market size and forecast, by deployment
8.3.6.5.3. Market size and forecast, by organization size
8.3.6.5.4. Market size and forecast, by industry vertical
8.3.6.6. Rest of Europe
8.3.6.6.1. Market size and forecast, by component
8.3.6.6.2. Market size and forecast, by deployment
8.3.6.6.3. Market size and forecast, by organization size
8.3.6.6.4. Market size and forecast, by industry vertical
8.4. Asia-Pacific
8.4.1. Key market trends, growth factors and opportunities
8.4.2. Market size and forecast, by component
8.4.3. Market size and forecast, by deployment
8.4.4. Market size and forecast, by Organization size
8.4.5. Market size and forecast, by Industry Vertical
8.4.6. Market analysis by country
8.4.6.1. China
8.4.6.1.1. Market size and forecast, by component
8.4.6.1.2. Market size and forecast, by deployment
8.4.6.1.3. Market size and forecast, by organization size
8.4.6.1.4. Market size and forecast, by industry vertical
8.4.6.2. India
8.4.6.2.1. Market size and forecast, by component
8.4.6.2.2. Market size and forecast, by deployment
8.4.6.2.3. Market size and forecast, by organization size
8.4.6.2.4. Market size and forecast, by industry vertical
8.4.6.3. Japan
8.4.6.3.1. Market size and forecast, by component
8.4.6.3.2. Market size and forecast, by deployment
8.4.6.3.3. Market size and forecast, by organization size
8.4.6.3.4. Market size and forecast, by industry vertical
8.4.6.4. Singapore
8.4.6.4.1. Market size and forecast, by component
8.4.6.4.2. Market size and forecast, by deployment
8.4.6.4.3. Market size and forecast, by organization size
8.4.6.4.4. Market size and forecast, by industry vertical
8.4.6.5. Rest of Asia-Pacific
8.4.6.5.1. Market size and forecast, by component
8.4.6.5.2. Market size and forecast, by deployment
8.4.6.5.3. Market size and forecast, by organization size
8.4.6.5.4. Market size and forecast, by industry vertical
8.5. LAMEA
8.5.1. Key market trends, growth factors and opportunities
8.5.2. Market size and forecast, by component
8.5.3. Market size and forecast, by deployment
8.5.4. Market size and forecast, by Organization size
8.5.5. Market size and forecast, by Industry Vertical
8.5.6. Market analysis by country
8.5.6.1. Latin America
8.5.6.1.1. Market size and forecast, by component
8.5.6.1.2. Market size and forecast, by deployment
8.5.6.1.3. Market size and forecast, by organization size
8.5.6.1.4. Market size and forecast, by industry vertical
8.5.6.2. Middle East
8.5.6.2.1. Market size and forecast, by component
8.5.6.2.2. Market size and forecast, by deployment
8.5.6.2.3. Market size and forecast, by organization size
8.5.6.2.4. Market size and forecast, by industry vertical
8.5.6.3. Africa
8.5.6.3.1. Market size and forecast, by component
8.5.6.3.2. Market size and forecast, by deployment
8.5.6.3.3. Market size and forecast, by organization size
8.5.6.3.4. Market size and forecast, by industry vertical
CHAPTER 9: COMPETITIVE LANDSCAPE
9.1. Competitive dashboard
9.2. Top winning strategies
9.3. Key developments
9.3.1. New product launches
9.3.2. Business expansions
9.3.3. Agreement
9.3.4. Partnership
9.3.5. Product development
9.3.6. Collaboration
9.3.7. Acquisition
CHAPTER 10: COMPANY PROFILES
10.1. COMARCH SA
10.1.1. Company overview
10.1.2. Key executives
10.1.3. Company snapshot
10.1.4. Operating business segments
10.1.5. Product portfolio
10.1.6. R&D Expenditure
10.1.7. Business performance
10.1.8. Key strategic moves and developments
10.2. IFS AB
10.2.1. Company overview
10.2.2. Key executives
10.2.3. Company snapshot
10.2.4. Product portfolio
10.2.5. Business performance
10.2.6. Key strategic moves and developments
10.3. INFOR
10.3.1. Company overview
10.3.2. Key executives
10.3.3. Company snapshot
10.3.4. Operating business segments
10.3.5. Product portfolio
10.3.6. R&D Expenditure
10.3.7. Business performance
10.3.8. Key strategic moves and developments
10.4. MICROSOFT CORPORATION
10.4.1. Company overview
10.4.2. Key executives
10.4.3. Company snapshot
10.4.4. Operating business segments
10.4.5. Product portfolio
10.4.6. R&D Expenditure
10.4.7. Business performance
10.4.8. Key strategic moves and developments
10.5. ORACLE CORPORATION
10.5.1. Company overview
10.5.2. Key executives
10.5.3. Company snapshot
10.5.4. Operating business segments
10.5.5. Product portfolio
10.5.6. R&D Expenditure
10.5.7. Business performance
10.5.8. Key strategic moves and developments
10.6. OVERIT
10.6.1. Company overview
10.6.2. Key executives
10.6.3. Company snapshot
10.6.4. Product portfolio
10.6.5. Key strategic moves and developments
10.7. PRAXEDO
10.7.1. Company overview
10.7.2. Key executives
10.7.3. Company snapshot
10.7.4. Product portfolio
10.8. SALESFORCE.COM, INC.
10.8.1. Company overview
10.8.2. Key executives
10.8.3. Company snapshot
10.8.4. Product portfolio
10.8.5. R&D Expenditure
10.8.6. Business performance
10.8.7. Key strategic moves and developments
10.9. SAP SE
10.9.1. Company overview
10.9.2. Key executives
10.9.3. Company snapshot
10.9.4. Operating business segments
10.9.5. Product portfolio
10.9.6. R&D Expenditure
10.9.7. Business performance
10.9.8. Key strategic moves and developments
10.10. SERVICEMAX
10.10.1. Company overview
10.10.2. Key executives
10.10.3. Company snapshot
10.10.4. Product portfolio
10.10.5. Key strategic moves and developments
Table 01.Global Field Service Management Software Market Revenue, By Component, 2020-2030 ($Million)
Table 02.Global Field Service Management Market Revenue For On-Premise, By Region 2020–2030 ($Million)
Table 03.Global Field Service Management Market Revenue, By Solution Type, 2020–2030 ($Million)
Table 04.Global Field Service Management Market Revenue For Services, By Region 2020–2030 ($Million)
Table 05.Global Field Service Management Market Revenue, By Service Type, 2020–2030 ($Million)
Table 06.Field Service Management Market Revenue, By Deployment 2020–2030 ($Million)
Table 07.Global Field Service Management Market Revenue For On-Premise, By Region 2020–2030 ($Million)
Table 08.Global Field Service Management Market Revenue For Cloud, By Region 2020–2030 ($Million)
Table 09.Global Field Service Management Software Market Revenue, By Organization Size, 2020-2030 ($Million)
Table 10.Global Field Service Management Market Revenue For Large Enterprises, By Region 2020–2030 ($Million)
Table 11.Global Field Service Management Software Market Revenue For Smes, By Region 2020–2030 ($Million)
Table 12.Global Field Service Management Software Market Revenue, By Industry Vertical, 2020-2030 ($Million)
Table 13.Global Field Service Management Market Revenue For It And Telecom, By Region 2020–2030 ($Million)
Table 14.Global Field Service Management Software Market Revenue For Healthcare And Life Sciences, By Region 2020–2030 ($Million)
Table 15.Global Field Service Management Market Revenue For Manufacturing, By Region 2020–2030 ($Million)
Table 16.Global Field Service Management Software Market Revenue For Bfsi, By Region 2020–2030 ($Million)
Table 17.Global Field Service Management Market Revenue For It And Transportation And Logistics, By Region 2020–2030 ($Million)
Table 18.Global Field Service Management Software Market Revenue For Energy And Utilities, By Region 2020–2030 ($Million)
Table 19.Global Field Service Management Market Revenue For Construction, By Region 2020–2030 ($Million)
Table 20.Global Field Service Management Software Market Revenue For Others, By Region 2020–2030 ($Million)
Table 21.Global Field Service Management Software Market Revenue, By Region, 2020-2030 ($Million)
Table 22.North America Field Service Management Market Revenue, By Component 2020-2030 ($Million)
Table 23.North America Field Service Management Market Revenue, By Deployment, 2020-2030 ($Million)
Table 24.North America Field Service Management Market Revenue, By Organization Size 2020-2030 ($Million)
Table 25.North America Field Service Management Market Revenue, By Industry Vertical, 2020-2030 ($Million)
Table 26.North America Field Service Management Market Revenue, By Country, 2020-2030 ($Million)
Table 27.U.S. Field Service Management Market Revenue, By Component 2020-2030 ($Million)
Table 28.U.S. Field Service Management Market Revenue, By Deployment, 2020-2030 ($Million)
Table 29.U.S. Field Service Management Market Revenue, By Organization Size, 2020-2030 ($Million)
Table 30.U.S. Field Service Management Market Revenue, By Industry Vertical, 2020-2030 ($Million)
Table 31.Canada Field Service Management Market Revenue, By Component 2020-2030 ($Million)
Table 32.Canada Field Service Management Market Revenue, By Deployment, 2020-2030 ($Million)
Table 33.Canada Field Service Management Market Revenue, By Organization Size, 2020-2030 ($Million)
Table 34.Canada Field Service Management Market Revenue, By Industry Vertical, 2020-2030 ($Million)
Table 35.Europe Field Service Management Market Revenue, By Component 2020-2030 ($Million)
Table 36.Europe Field Service Management Market Revenue, By Deployment, 2020-2030 ($Million)
Table 37.Europe Field Service Management Market Revenue, By Organization Size 2020-2030 ($Million)
Table 38.Europe Field Service Management Market Revenue, By Industry Vertical, 2020-2030 ($Million)
Table 39.Europe Field Service Management Market Revenue, By Country, 2020-2030 ($Million)
Table 40.Uk Field Service Management Market Revenue, By Component 2020-2030 ($Million)
Table 41.Uk Field Service Management Market Revenue, By Deployment, 2020-2030 ($Million)
Table 42.Uk Field Service Management Market Revenue, By Organization Size, 2020-2030 ($Million)
Table 43.Uk Field Service Management Market Revenue, By Industry Vertical, 2020-2030 ($Million)
Table 44.Germany Field Service Management Market Revenue, By Component 2020-2030 ($Million)
Table 45.Germany Field Service Management Market Revenue, By Deployment, 2020-2030 ($Million)
Table 46.Germany Field Service Management Market Revenue, By Organization Size, 2020-2030 ($Million)
Table 47.Germany Field Service Management Market Revenue, By Industry Vertical, 2020-2030 ($Million)
Table 48.France Field Service Management Market Revenue, By Component 2020-2030 ($Million)
Table 49.France Field Service Management Market Revenue, By Deployment, 2020-2030 ($Million)
Table 50.France Field Service Management Market Revenue, By Organization Size, 2020-2030 ($Million)
Table 51.France Field Service Management Market Revenue, By Industry Vertical, 2020-2030 ($Million)
Table 52.Italy Field Service Management Market Revenue, By Component 2020-2030 ($Million)
Table 53.Italy Field Service Management Market Revenue, By Deployment, 2020-2030 ($Million)
Table 54.Italy Field Service Management Market Revenue, By Organization Size, 2020-2030 ($Million)
Table 55.Italy Field Service Management Market Revenue, By Industry Vertical, 2020-2030 ($Million)
Table 56.Spain Field Service Management Market Revenue, By Component 2020-2030 ($Million)
Table 57.Spain Field Service Management Market Revenue, By Deployment, 2020-2030 ($Million)
Table 58.Spain Field Service Management Market Revenue, By Organization Size, 2020-2030 ($Million)
Table 59.Spain Field Service Management Market Revenue, By Industry Vertical, 2020-2030 ($Million)
Table 60.Rest Of Europe Field Service Management Market Revenue, By Component 2020-2030 ($Million)
Table 61.Rest Of Europe Field Service Management Market Revenue, By Deployment, 2020-2030 ($Million)
Table 62.Rest Of Europe Field Service Management Market Revenue, By Organization Size, 2020-2030 ($Million)
Table 63.Rest Of Europe Field Service Management Market Revenue, By Industry Vertical, 2020-2030 ($Million)
Table 64.Asia-Pacific Field Service Management Market Revenue, By Component 2020-2030 ($Million)
Table 65.Asia-Pacific Field Service Management Market Revenue, By Deployment, 2020-2030 ($Million)
Table 66.Asia-Pacific Field Service Management Market Revenue, By Organization Size 2020-2030 ($Million)
Table 67.Asia-Pacific Field Service Management Market Revenue, By Industry Vertical, 2020-2030 ($Million)
Table 68.Asia-Pacific Field Service Management Market Revenue, By Country, 2020-2030 ($Million)
Table 69.China Field Service Management Market Revenue, By Component 2020-2030 ($Million)
Table 70.China Field Service Management Market Revenue, By Deployment, 2020-2030 ($Million)
Table 71.China Field Service Management Market Revenue, By Organization Size, 2020-2030 ($Million)
Table 72.China Field Service Management Market Revenue, By Industry Vertical, 2020-2030 ($Million)
Table 73.India Field Service Management Market Revenue, By Component 2020-2030 ($Million)
Table 74.India Field Service Management Market Revenue, By Deployment, 2020-2030 ($Million)
Table 75.India Field Service Management Market Revenue, By Organization Size, 2020-2030 ($Million)
Table 76.India Field Service Management Market Revenue, By Industry Vertical, 2020-2030 ($Million)
Table 77.Japan Field Service Management Market Revenue, By Component 2020-2030 ($Million)
Table 78.Japan Field Service Management Market Revenue, By Deployment, 2020-2030 ($Million)
Table 79.Japan Field Service Management Market Revenue, By Organization Size, 2020-2030 ($Million)
Table 80.Japan Field Service Management Market Revenue, By Industry Vertical, 2020-2030 ($Million)
Table 81.Singapore Field Service Management Market Revenue, By Component 2020-2030 ($Million)
Table 82.Singapore Field Service Management Market Revenue, By Deployment, 2020-2030 ($Million)
Table 83.Singapore Field Service Management Market Revenue, By Organization Size, 2020-2030 ($Million)
Table 84.Singapore Field Service Management Market Revenue, By Industry Vertical, 2020-2030 ($Million)
Table 85.Rest Of Asia-Pacific Field Service Management Market Revenue, By Component 2020-2030 ($Million)
Table 86.Rest Of Asia-Pacific Field Service Management Market Revenue, By Deployment, 2020-2030 ($Million)
Table 87.Rest Of Asia-Pacific Field Service Management Market Revenue, By Organization Size, 2020-2030 ($Million)
Table 88.Rest Of Asia-Pacific Field Service Management Market Revenue, By Industry Vertical, 2020-2030 ($Million)
Table 89.Lamea Field Service Management Market Revenue, By Component 2020-2030 ($Million)
Table 90.Lamea Field Service Management Market Revenue, By Deployment, 2020-2030 ($Million)
Table 91.Lamea Field Service Management Market Revenue, By Organization Size 2020-2030 ($Million)
Table 92.Lamea Field Service Management Market Revenue, By Industry Vertical, 2020-2030 ($Million)
Table 93.Lamea Field Service Management Market Revenue, By Country, 2017-2025 ($Million)
Table 94.Latin America Field Service Management Market Revenue, By Component 2020-2030 ($Million)
Table 95.Latin America Field Service Management Market Revenue, By Deployment, 2020-2030 ($Million)
Table 96.Latin America Field Service Management Market Revenue, By Organization Size, 2020-2030 ($Million)
Table 97.Latin America Field Service Management Market Revenue, By Industry Vertical, 2020-2030 ($Million)
Table 98.Middle East Field Service Management Market Revenue, By Component 2020-2030 ($Million)
Table 99.Middle East Field Service Management Market Revenue, By Deployment, 2020-2030 ($Million)
Table 100.Middle East Field Service Management Market Revenue, By Organization Size, 2020-2030 ($Million)
Table 101.Middle East Field Service Management Market Revenue, By Industry Vertical, 2020-2030 ($Million)
Table 102.Africa Field Service Management Market Revenue, By Component 2020-2030 ($Million)
Table 103.Africa Field Service Management Market Revenue, By Deployment, 2020-2030 ($Million)
Table 104.Africa Field Service Management Market Revenue, By Organization Size, 2020-2030 ($Million)
Table 105.Africa Field Service Management Market Revenue, By Industry Vertical, 2020-2030 ($Million)
Table 106.Key New Product Launches (2017-2021)
Table 107.Key Expansions (2017-2021)
Table 108.Agreement (2017-2021)
Table 109.Partnership (2017-2021)
Table 110.Product Developments (2017-2021)
Table 111.Collaboration (2017-2021)
Table 112.Acquistion (2017-2021)
Table 113.Comarch Sa: Key Executives
Table 114.Comarch Sa: Company Snapshot
Table 115.Comarch Sa: Product Portfolio
Table 116.Ifs Ab: Key Executives
Table 117.Ifs Ab: Company Snapshot
Table 118.Ifs Ab: Product Portfolio
Table 119.Infor: Key Executives
Table 120.Infor: Company Snapshot
Table 121.Infor: Operating Segments
Table 122.Infor: Product Portfolio
Table 123.Microsoft Corporation: Key Executives
Table 124.Microsoft Corporation: Company Snapshot
Table 125.Microsoft Corporation: Operating Segments
Table 126.Microsoft Corporation: Product Portfolio
Table 127.Oracle Corporation: Key Executives
Table 128.Oracle Corporation: Company Snapshot
Table 129.Oracle Corporation: Operating Segments
Table 130.Oracle Corporation: Product Portfolio
Table 131.Oracle Corporation: Key Strategic Moves And Developments
Table 132.Overit: Key Executives
Table 133.Overit: Company Snapshot
Table 134.Overit: Product Portfolio
Table 135.Praxedo: Key Executives
Table 136.Praxedo: Company Snapshot
Table 137.Praxedo: Product Portfolio
Table 138.Salesforce.Com, Inc.: Key Executives
Table 139.Salesforce.Com, Inc.: Company Snapshot
Table 140.Salesforce.Com, Inc.: Product Portfolio
Table 141.Sap Se: Key Executives
Table 142.Sap Se: Company Snapshot
Table 143.Sap Se: Operating Segments
Table 144.Sap Se: Product Portfolio
Table 145.Servicemax: Key Executives
Table 146.Servicemax: Company Snapshot
Table 147.General Electric, Inc.: Operating Segments
Table 148.Servicemax: Product Portfolio
List Of Figures
Figure 01.Key Market Segments
Figure 02.Global Field Service Management Market, 2020–2030
Figure 03.Global Field Service Management Market, By Region, 2020-2030
Figure 04.Top Impacting Factors
Figure 05.Top Investment Pockets
Figure 06.Moderate Bargaining Power Of Suppliers
Figure 07.Moderate-To-High Bargaining Power Of Buyers
Figure 08.Moderate Threat Of Substitutes
Figure 09.Moderate-To-High Threat Of New Entrants
Figure 10.High Competitive Rivalry
Figure 11.Global Field Service Management Market Revenue, By Component, 2020-2030 ($Million)
Figure 12.Comparative Share Analysis Of Global Field Service Management Market For Solution By Country, 2020 & 2030(%)
Figure 13.Comparative Share Analysis Of Global Field Service Management Software Market For Services, By Country, 2020 & 2030(%)
Figure 14.Field Service Management Market Revenue, By Deployment, 2020–2030($Billion)
Figure 15.Comparative Share Analysis Of Global Field Service Management Market For On-Premise By Country, 2020 & 2030(%)
Figure 16.Comparative Share Analysis Of Global Field Service Management Software Market For Cloud, By Country, 2020 & 2030(%)
Figure 17.Global Field Service Management Software Market Revenue, By Organization Size, 2020-2030 ($Million)
Figure 18.Comparative Share Analysis Global Field Service Management Market For Large Enterprises, By Country, 2020 & 2030 (%)
Figure 19.Comparative Share Analysis Of Global Field Service Management Software Market For Smes, By Country, 2020 & 2030(%)
Figure 20.Global Field Service Management Software Market Revenue, By Industry Vertical, 2020-2030 ($Million)
Figure 21.Comparative Share Analysis Global Field Service Management Market For It And Telecom, By Country, (%)
Figure 22.Comparative Share Analysis Of Global Field Service Management Software Market For Healthcare And Life Sciences, By Country, 2020 & 2030(%)
Figure 23.Comparative Share Analysis Global Field Service Management Market For Manufacturing, By Country, 2020 & 2030 (%)
Figure 24.Comparative Share Analysis Of Global Field Service Management Software Market For Bfsi, By Country, 2020 & 2030(%)
Figure 25.Comparative Share Analysis Global Field Service Management Market For Transportation And Logistics, By Country, 2020 & 2030 (%)
Figure 26.Comparative Share Analysis Of Global Field Service Management Software Market For Energy And Utilities, By Country, 2020 & 2030(%)
Figure 27.Comparative Share Analysis Global Field Service Management Market For Construction, By Country, 2020 & 2030 (%)
Figure 28.Comparative Share Analysis Of Global Field Service Management Software Market For Others, By Country, 2020 & 2030(%)
Figure 29.U.S. Field Service Management Market Revenue, 2020-2030 ($Million)
Figure 30.Canada Field Service Management Market Revenue, 2020-2030 ($Million)
Figure 31.Uk Field Service Management Market Revenue, 2020-2030 ($Million)
Figure 32.Germany Field Service Management Market Revenue, 2020-2030 ($Million)
Figure 33.France Field Service Management Market Revenue, 2020-2030 ($Million)
Figure 34.Italy Field Service Management Market Revenue, 2020-2030 ($Million)
Figure 35.Spain Field Service Management Market Revenue, 2020-2030 ($Million)
Figure 36.Rest Of Europe Field Service Management Market Revenue, 2020-2030 ($Million)
Figure 37.China Field Service Management Market Revenue, 2020-2030 ($Million)
Figure 38.India Field Service Management Market Revenue, 2020-2030 ($Million)
Figure 39.Japan Field Service Management Market Revenue, 2020-2030 ($Million)
Figure 40.Singapore Field Service Management Market Revenue, 2020-2030 ($Million)
Figure 41.Rest Of Asia-Pacific Field Service Management Market Revenue, 2020-2030 ($Million)
Figure 42.Latin America Field Service Management Market Revenue, 2020-2030 ($Million)
Figure 43.Middle East Field Service Management Market Revenue, 2020-2030 ($Million)
Figure 44.Africa Field Service Management Market Revenue, 2020-2030 ($Million)
Figure 45.Competitive Dashboard
Figure 46.Competitive Dashboard
Figure 47.Competitive Heatmap Of Key Players
Figure 48.Key Player Positioning Analysis: Field Service Management Market
Figure 49.Top Winning Strategies, By Year, 2017-2021
Figure 50.Top Winning Strategies, By Development, 2018-2021
Figure 51.Top Winning Strategies, By Company, 2018-2021
Figure 52.R&D Expenditure, 2018–2020 ($Million)
Figure 53.Comarch Sa: Revenue, 2018–2020 ($Million)
Figure 54.Comarch Sa: Revenue Share By Region, 2020 (%)
Figure 55.Ifs Ab: Revenue, 2017–2019 ($Million)
Figure 56.R&D Expenditure, 2017–2019 ($Million)
Figure 57.Infor: Revenue, 2017–2019 ($Million)
Figure 58.Infor: Revenue Share By Segment, 2019 (%)
Figure 59.Infor: Revenue Share By Region, 2019 (%)
Figure 60.R&D Expenditure, 2018–2020 ($Million)
Figure 61.Microsoft Corporation: Revenue, 2018–2020 ($Million)
Figure 62.Microsoft Corporation: Revenue Share By Segment, 2020 (%)
Figure 63.Microsoft Corporation: Revenue Share By Region, 2020 (%)
Figure 64.R&D Expenditure, 2018–2020 ($Million)
Figure 65.Oracle Corporation: Revenue, 2018–2020 ($Million)
Figure 66.Oracle Corporation: Revenue Share By Segment, 2020 (%)
Figure 67.Oracle Corporation: Revenue Share By Region, 2020 (%)
Figure 68.R&D Expenditure, 2018–2020 ($Million)
Figure 69.Salesforce.Com, Inc.: Revenue, 2016–2018 ($Million)
Figure 70.Salesforce.Com, Inc.: Revenue Share By Region, 2018 (%)
Figure 71.R&D Expenditure, 2018–2020 ($Million)
Figure 72.Sap Se: Revenue, 2018–2020 ($Million)
Figure 73.Sap Se: Revenue Share By Segment, 2020 (%)
Figure 74.Sap Se: Revenue Share By Region, 2020 (%)
Figure 75.R&D Expenditure, 2018-2020 ($Million)
Figure 76.General Electric, Inc.: Revenue, 2018-2020 ($Million)
Figure 77.General Electric, Inc.: Revenue Share, By Segment, 2020 (%)
Figure 78.General Electric, Inc.: Revenue Share, By Region, 2020 (%)
$6169
$10665
HAVE A QUERY?
OUR CUSTOMER

SIMILAR REPORTS
Add to Cart
Add to Cart
Add to Cart
Add to Cart