
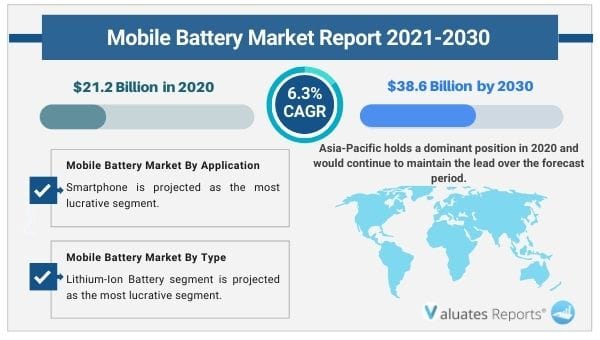
The global mobile battery market size was valued at US$ 21.2 billion in 2020 and is expected to reach US$ 38.6 billion by 2030 registering a CAGR of 6.3% from 2021 to 2030. Key drivers of the mobile battery market include the rising demand for smartphones, tablets, and other consumer electronic devices.
On the other hand, the low penetration of smartphones among the older generation and potential risks associated with mobile usage will hamper the market growth. However, a rise in R&D initiatives towards increasing battery life and performance will spur the growth of the mobile battery market during the forecast period.
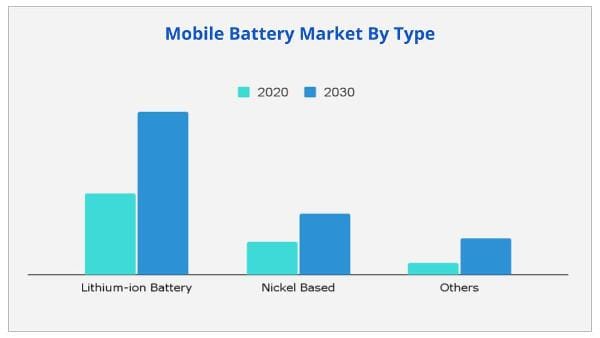
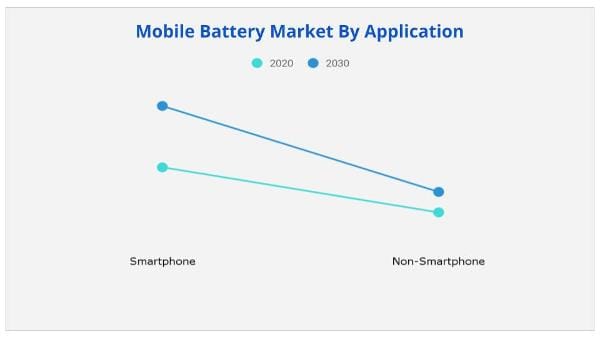
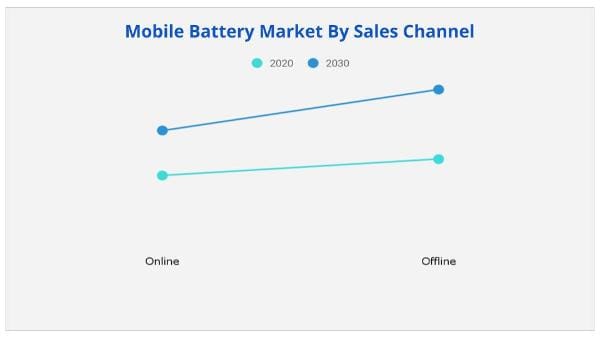
The global mobile battery market is segmented on the basis of type, application, sales channel, and region. Depending on the type, the market is categorized into lithium-ion battery, nickel-based, and others. On the basis of application, it is bifurcated into smartphones and non-smartphones. By sales channel, it is divided into online and offline. Region-wise, it is analyzed across North America, Europe, Asia-Pacific, and LAMEA.
The global market covers in-depth information of the major mobile battery industry participants. Some of the major players in the market include Samsung SDI Co., Ltd., Panasonic Corporation, Murata Manufacturing Co., Ltd., TWS, LG Corporation, Maxell, Ltd., Sunwoda Electronic Co., Ltd., Zhuhai CosMX Battery Co., Ltd., TianJin Lishen Battery Joint-Stock Co., Ltd., and Amperex Technology Limited.
Other players operating in the value chain of the global mobile battery market are DESAY, BYD, EEMB, Zhuhai Coslight Battery, China BAK Battery, ENERDEL, and others.
The key players are adopting numerous strategies such as agreement and acquisition, to stay competitive in the mobile battery market.
For instance, in September 2021, Murata Manufacturing Co., Ltd. acquired Eta Wireless Inc. (the developer of Digital Envelope Tracking Technology). By using digital envelope tracking technology, it can reduce the power consumption of RF circuits and contribute toward the extension of battery life.
Smartphones have become an integral part of the life of people below the age group of 30 years for gaming, social media, camera, checking into places such as events, movies, and accessing maps. Feature phones and mobiles are also being adopted by working professionals. These phones should have long battery life for performing various activities in one charging cycle. Thus growing usage of smartphones, tablets, and other consumer electronic devices are creating more demand for efficient battery technology especially lithium-ion batteries thereby driving the growth of the mobile battery market during the forecast period.
Low penetration of smartphones and strong feature phone presence among the older generation( people above 60 years) is expected to lower the rise of the market. Moreover, high concerns and potential risks towards personal, financial security regarding online activities among consumers will hamper growth. However, increasing research and development initiatives by key market players for the production of efficient battery technology for improving shelf life and performance will significantly boost the growth of the mobile battery market during the forecast period.
Based on type, the lithium-ion battery segment dominated the market in 2020 with a share of 69.75% and is expected to provide lucrative opportunities for growth in the mobile battery market share during the forecast period due to rising demand for lithium-ion batteries for smartphones with additional features like gaming, camera, etc which utilizes more power in the processor.
Based on application, the smartphones segment dominated the market in 2020 with a share of 82.2% and will grow at the fastest CAGR of 6.4% during the forecast period due to the growing demand for smartphones among consumers aged 18 to 30 years and increasing replacement of feature phones with smartphones.
Based on sales channels, the offline segment is expected to provide lucrative opportunities for growth in the mobile battery market share due to key benefits such as easy maintenance, faster problem resolving, and replacement. Further consumers are price-sensitive as they purchase mobile accessories such as batteries, covers through offline channels. On the other hand, the online segment is expected to grow at the fastest CAGR of 6.4% during the forecast period.
Based on region, Asia-pacific dominated the market in 2020 with a share of 39.4% and will grow at a CAGR of 6.6% thereby lucrative opportunities for growth in the mobile battery market share during the forecast period due to the presence of key market players, huge consumer base and increasing R&D initiatives in the industry.
|
Report Metric |
Details |
|
Base Year: |
2020 |
|
Market Size in 2020: |
USD 21.2 Billion |
|
Forecast Period: |
2021 to 2030 |
|
Forecast Period 2021 to 2030 CAGR: |
6.3% |
|
2030 Value Projection: |
USD 38.6 Billion |
|
No. of Pages: |
295 |
|
Tables & Figures |
214 |
|
Charts |
55 |
|
Segments covered: |
By Type, Sales, Application, Region |
Ans. The market size of mobile battery surpassed USD 21.2 billion in 2020 and will witness a CAGR of over 6.3% through 2030.
Ans. The mobile battery market size is projected to reach USD 38.6 billion by 2030.
Ans. The mobile battery market is segmented on the basis of type, sales, application, and region.
Ans. The major mobile battery industry participants. Some of the major players in the market include Samsung SDI Co., Ltd., Panasonic Corporation, Murata Manufacturing Co., Ltd., TWS, LG Corporation, Maxell, Ltd., Sunwoda Electronic Co., Ltd., Zhuhai CosMX Battery Co., Ltd., TianJin Lishen Battery Joint-Stock Co., Ltd., and Amperex Technology Limited.
Ans. Rise in R&D initiatives towards increasing battery life and performance will spur the growth of the mobile battery market during the forecast period.
Ans. Asia-Pacific will provide business opportunities for mobile battery market during the forecast period.
Ans. On the basis of sales channel, offline segment will drive the growth of the mobile battery market.
CHAPTER 1:INTRODUCTION
1.1.Report description
1.2.Key benefits for stakeholders
1.3.Key market segments
1.4.Research methodology
1.4.1.Primary research
1.4.2.Secondary research
1.4.3.Analyst tools and models
CHAPTER 2:EXECUTIVE SUMMARY
2.1.Key findings
2.2.CXO perspective
CHAPTER 3:-MARKET OVERVIEW
3.1.Market definition and scope
3.2.Key forces shaping the market
3.3.Value chain analysis
3.4.Top investment pockets
3.5.Patent analysis
3.5.1.By region, 2013–2020
3.6.Market dynamics
3.6.1.Drivers
3.6.1.1.Surge in demand for smartphones, tablets, and other electronic devices
3.6.2.Restraint
3.6.2.1.High cost and potential risks hazards associated with lithium-ion battery
3.6.3.Opportunity
3.6.3.1.Higher energy efficiency requirements in technologically updated consumer gadgets
3.7.Impact of government regulations on the market
3.8.Impact of COVID-19 outbreak on the market
CHAPTER 4:MOBILE BATTERY MARKET, BY TYPE
4.1.Overview
4.1.1.Market size and forecast
4.2.Lithium-ion battery
4.2.1.Key market trends, growth factors, and opportunities
4.2.2.Market size and forecast, by region
4.2.3.Market size and forecast
4.2.4.Lithium iron-phosphate
4.2.5.Lithium Manganese Oxide
4.2.6.Lithium-titanate-oxide (LTO)
4.2.7.Others
4.2.8.Market share analysis, by country
4.3.Nickel-based battery
4.3.1.Key market trends, growth factors, and opportunities
4.3.2.Market size and forecast, by region
4.3.3.Market size and forecast
4.3.4.Nickel Cadmium
4.3.5.Nickel Metal Hydride
4.3.6.Market share analysis, by country
4.4.Others
4.4.1.Key market trends, growth factors, and opportunities
4.4.2.Market size and forecast, by region
4.4.3.Market share analysis, by country
CHAPTER 5:MOBILE BATTERY MARKET, BY APPLICATION
5.1.Overview
5.1.1.Market size and forecast
5.2.Smartphones
5.2.1.Key market trends, growth factors, and opportunities
5.2.2.Market size and forecast, by region
5.2.3.Market share analysis, by country
5.3.Non-smartphones
5.3.1.Key market trends, growth factors, and opportunities
5.3.2.Market size and forecast, by region
5.3.3.Market share analysis, by country
CHAPTER 6:MOBILE BATTERY MARKET, BY SALES CHANNEL
6.1.Overview
6.1.1.Market size and forecast
6.2.Online
6.2.1.Key market trends, growth factors, and opportunities
6.2.2.Market size and forecast, by region
6.2.3.Market share analysis, by country
6.3.Offline
6.3.1.Key market trends, growth factors, and opportunities
6.3.2.Market size and forecast, by region
6.3.3.Market share analysis, by country
CHAPTER 7:MOBILE BATTERY MARKET, BY REGION
7.1.Overview
7.1.1.Market size and forecast
7.2.North America
7.2.1.Key market trends, growth factors, and opportunities
7.2.2.Market size and forecast, by type
7.2.3.Market size and forecast, by application
7.2.4.Market size and forecast, by sales channel
7.2.5.Market share analysis, by country
7.2.6.U.S.
7.2.6.1.Market size and forecast, by type
7.2.6.2.Market size and forecast, by application
7.2.6.3.Market size and forecast, by sales channel
7.2.7.Canada
7.2.7.1.Market size and forecast, by type
7.2.7.2.Market size and forecast, by application
7.2.7.3.Market size and forecast, by sales channel
7.2.8.Mexico
7.2.8.1.Market size and forecast, by type
7.2.8.2.Market size and forecast, by application
7.2.8.3.Market size and forecast, by sales channel
7.3.Europe
7.3.1.Key market trends, growth factors, and opportunities
7.3.2.Market size and forecast, by type
7.3.3.Market size and forecast, by application
7.3.4.Market size and forecast, by sales channel
7.3.5.Market share analysis, by country
7.3.6.Germany
7.3.6.1.Market size and forecast, by type
7.3.6.2.Market size and forecast, by application
7.3.6.3.Market size and forecast, by sales channel
7.3.7.France
7.3.7.1.Market size and forecast, by type
7.3.7.2.Market size and forecast, by application
7.3.7.3.Market size and forecast, by sales channel
7.3.8.UK
7.3.8.1.Market size and forecast, by type
7.3.8.2.Market size and forecast, by application
7.3.8.3.Market size and forecast, by sales channel
7.3.9.Spain
7.3.9.1.Market size and forecast, by type
7.3.9.2.Market size and forecast, by application
7.3.9.3.Market size and forecast, by sales channel
7.3.10.Italy
7.3.10.1.Market size and forecast, by type
7.3.10.2.Market size and forecast, by application
7.3.10.3.Market size and forecast, by sales channel
7.3.11.Rest of Europe
7.3.11.1.Market size and forecast, by type
7.3.11.2.Market size and forecast, by application
7.3.11.3.Market size and forecast, by sales channel
7.4.Asia-Pacific
7.4.1.Key market trends, growth factors, and opportunities
7.4.2.Market size and forecast, by type
7.4.3.Market size and forecast, by application
7.4.4.Market size and forecast, by sales channel
7.4.5.Market share analysis, by country
7.4.6.China
7.4.6.1.Market size and forecast, by type
7.4.6.2.Market size and forecast, by application
7.4.6.3.Market size and forecast, by sales channel
7.4.7.Japan
7.4.7.1.Market size and forecast, by type
7.4.7.2.Market size and forecast, by application
7.4.7.3.Market size and forecast, by sales channel
7.4.8.India
7.4.8.1.Market size and forecast, by type
7.4.8.2.Market size and forecast, by application
7.4.8.3.Market size and forecast, by sales channel
7.4.9.Australia
7.4.9.1.Market size and forecast, by type
7.4.9.2.Market size and forecast, by application
7.4.9.3.Market size and forecast, by sales channel
7.4.10.South Korea
7.4.10.1.Market size and forecast, by type
7.4.10.2.Market size and forecast, by application
7.4.10.3.Market size and forecast, by sales channel
7.4.11.Rest of Asia-Pacific
7.4.11.1.Market size and forecast, by type
7.4.11.2.Market size and forecast, by application
7.4.11.3.Market size and forecast, by sales channel
7.5.LAMEA
7.5.1.Key market trends, growth factors, and opportunities
7.5.2.Market size and forecast, by type
7.5.3.Market size and forecast, by application
7.5.4.Market size and forecast, by sales channel
7.5.5.Market share analysis, by country
7.5.6.Brazil
7.5.6.1.Market size and forecast, by type
7.5.6.2.Market size and forecast, by application
7.5.6.3.Market size and forecast, by sales channel
7.5.7.Saudi Arabia
7.5.7.1.Market size and forecast, by type
7.5.7.2.Market size and forecast, by application
7.5.7.3.Market size and forecast, by sales channel
7.5.8.South Africa
7.5.8.1.Market size and forecast, by type
7.5.8.2.Market size and forecast, by application
7.5.8.3.Market size and forecast, by sales channel
7.5.9.Rest of LAMEA
7.5.9.1.Market size and forecast, by type
7.5.9.2.Market size and forecast, by application
7.5.9.3.Market size and forecast, by sales channel
CHAPTER 8:COMPETITIVE LANDSCAPE
8.1.Introduction
8.1.1.Market Player Positioning, 2020
8.2.Top winning strategies
8.3.Product Mapping of Top 10 Player
8.4.Competitive Heatmap
8.5.Key developments
8.5.1.Key acquisitions and agreement
CHAPTER 9:COMPANY PROFILES
9.1.AMPEREX TECHNOLOGY LIMITED
9.1.1.Company overview
9.1.2.Company snapshot
9.1.3.Product portfolio
9.1.4.Key strategic moves and developments
9.1.5.Amperex Technology Limited - SWOT Analysis
9.2.LG CORPORATION
9.2.1.Company overview
9.2.2.Company Snapshot
9.2.3.Product portfolio
9.2.4.Business performance
9.2.5.LG Corporation - SWOT Analysis
9.3.MAXELL, LTD.
9.3.1.Company overview
9.3.2.Company snapshot
9.3.3.Operating business segments
9.3.4.Product portfolio
9.3.5.Business performance
9.3.6.Maxell, Ltd. - SWOT Analysis
9.4.MURATA MANUFACTURING CO., LTD.
9.4.1.Company overview
9.4.2.Company snapshot
9.4.3.Operating business segments
9.4.4.Product portfolio
9.4.5.Business performance
9.4.6.Key strategic moves and developments
9.4.7.Murata Manufacturing Co., Ltd. - SWOT Analysis
9.5.PANASONIC CORPORATION
9.5.1.Company overview
9.5.2.Company snapshot
9.5.3.Operating business segments
9.5.4.Product portfolio
9.5.5.Business performance
9.5.6.Panasonic Corporation - SWOT Analysis
9.6.SAMSUNG SDI CO., LTD.
9.6.1.Company overview
9.6.2.Company snapshot
9.6.3.Operating business segments
9.6.4.Product portfolio
9.6.5.Business performance
9.6.6.Samsung SDI Co., Ltd. - SWOT Analysis
9.7.SUNWODA ELECTRONIC CO., LTD.
9.7.1.Company overview
9.7.2.Company snapshot
9.7.3.Product portfolio
9.7.4.Sunwoda Electronic Co., Ltd. - SWOT Analysis
9.8.TIANJIN LISHEN BATTERY JOINT-STOCK CO., LTD.
9.8.1.Company overview
9.8.2.Company snapshot
9.8.3.Product portfolio
9.8.4.TianJin Lishen Battery Joint-Stock Co., Ltd. - SWOT Analysis
9.9.TWS
9.9.1.Company overview
9.9.2.Company Snapshot
9.9.3.Product portfolio
9.9.4.TWS - SWOT Analysis
9.10.ZHUHAI COSMX BATTERY CO., LTD.
9.10.1.Company overview
9.10.2.Company snapshot
9.10.3.Product portfolio
9.10.4.Zhuhai CosMX Battery Co., Ltd. - SWOT Analysis
Table 01.Global Mobile Battery Market, By Type, 2020–2030 ($Million)
Table 02.Mobile Battery Market, By Type, 2020–2030 (Mwh)
Table 03.Mobile Battery Market For Lithium-Ion Battery, By Region, 2020–2030 ($Million)
Table 04.Mobile Battery Market For Lithium-Ion Battery, By Region, 2020–2030 (Mwh)
Table 05.Global Mobile Battery Market, By Lithium-Ion Battery Type, 2020–2030 ($Million)
Table 06.Global Mobile Battery Market, By Lithium-Ion Battery Type, 2020–2030 (Mwh)
Table 07.Mobile Battery Market For Nickel-Based Battery, By Region, 2020–2030 ($Million)
Table 08.Mobile Battery Market For Nickel-Based Battery, By Region, 2020–2030 (Mwh)
Table 09.Global Mobile Battery Market, By Nickel-Based Battery Type, 2020–2030 ($Million)
Table 10.Global Mobile Battery Market, By Nickel-Based Battery Type, 2020–2030 (Mwh)
Table 11.Mobile Battery Market For Others, By Region, 2020–2030 ($Million)
Table 12.Mobile Battery Market For Others, By Region, 2020–2030 (Mwh)
Table 13.Mobile Battery Market, By Application, 2020–2030 ($Million)
Table 14.Mobile Battery Market, By Application, 2020–2030 (Mwh)
Table 15.Mobile Battery Market For Smartphones, By Region, 2020–2030 ($Million)
Table 16.Mobile Battery Market For Smartphones, By Region, 2020–2030 (Mwh)
Table 17.Mobile Battery Market For Non-Smartphones, By Region, 2020–2030 ($Million)
Table 18.Mobile Battery Market For Non-Smartphones, By Region, 2020–2030 (Mwh)
Table 19.Mobile Battery Market, By Sales Channel, 2020–2030 ($Million)
Table 20.Mobile Battery Market, By Sales Channel, 2020–2030 (Mwh)
Table 21.Mobile Battery Market For Online, By Region, 2020–2030 ($Million)
Table 22.Mobile Battery Market For Online, By Region, 2020–2030 (Mwh)
Table 23.Mobile Battery Market For Offline, By Region, 2020–2030 ($Million)
Table 24.Mobile Battery Market For Offline, By Region, 2020–2030 (Mwh)
Table 25.Mobile Battery Market, By Region, 2020-2030 ($Million)
Table 26.Mobile Battery Market, By Region, 2020–2030 (Mwh)
Table 27.North America Mobile Battery Market, By Type, 2020–2030 ($Million)
Table 28.North America Mobile Battery Market, By Type, 2020–2030 (Mwh)
Table 29.North America Mobile Battery Market, By Application, 2020–2030 ($Million)
Table 30.North America Mobile Battery Market, By Application, 2020–2030 (Mwh)
Table 31.North America Mobile Battery Market, By Sales Channel, 2020–2030 ($Million)
Table 32.North America Mobile Battery Market, By Sales Channel, 2020–2030 (Mwh)
Table 33.North America Mobile Battery Market, By Country, 2020–2030 ($Million)
Table 34.North America Mobile Battery Market, By Country, 2020–2030 (Mwh)
Table 35.U.S. Mobile Battery Market, By Type, 2020–2030 ($Million)
Table 36.U.S. Mobile Battery Market, By Type, 2020–2030 (Mwh)
Table 37.U.S. Mobile Battery Market, By Application, 2020–2030 ($Million)
Table 38.U.S. Mobile Battery Market, By Application, 2020–2030 (Mwh)
Table 39.U.S. Mobile Battery Market, By Sales Channel, 2020–2030 ($Million)
Table 40.U.S. Mobile Battery Market, By Sales Channel, 2020–2030 (Mwh)
Table 41.Canada Mobile Battery Market, By Type, 2020–2030 ($Million)
Table 42.Canada Mobile Battery Market, By Type, 2020–2030 (Mwh)
Table 43.Canada Mobile Battery Market, By Application, 2020–2030 ($Million)
Table 44.Canada Mobile Battery Market, By Application, 2020–2030 (Mwh)
Table 45.Canada Mobile Battery Market, By Sales Channel, 2020–2030 ($Million)
Table 46.Canada Mobile Battery Market, By Sales Channel, 2020–2030 (Mwh)
Table 47.Mexico Mobile Battery Market, By Type, 2020–2030 ($Million)
Table 48.Mexico Mobile Battery Market, By Type, 2020–2030 (Mwh)
Table 49.Mexico Mobile Battery Market, By Application, 2020–2030 ($Million)
Table 50.Mexico Mobile Battery Market, By Application, 2020–2030 (Mwh)
Table 51.Mexico Mobile Battery Market, By Sales Channel, 2020–2030 ($Million)
Table 52.Mexico Mobile Battery Market, By Sales Channel, 2020–2030 (Mwh)
Table 53.Europe Mobile Battery Market, By Type, 2020–2030 ($Million)
Table 54.Europe Mobile Battery Market, By Type, 2020–2030 (Mwh)
Table 55.Europe Mobile Battery Market, By Application, 2020–2030 ($Million)
Table 56.Europe Mobile Battery Market, By Application, 2020–2030 (Mwh)
Table 57.Europe Mobile Battery Market, By Sales Channel, 2020–2030 ($Million)
Table 58.Europe Mobile Battery Market, By Sales Channel, 2020–2030 (Mwh)
Table 59.Europe Mobile Battery Market, By Country, 2020–2030 ($Million)
Table 60.Europe Mobile Battery Market, By Country, 2020–2030 (Mwh)
Table 61.Germany Mobile Battery Market, By Type, 2020–2030 ($Million)
Table 62.Germany Mobile Battery Market, By Type, 2020–2030 (Mwh)
Table 63.Germany Mobile Battery Market, By Application, 2020–2030 ($Million)
Table 64.Germany Mobile Battery Market, By Application, 2020–2030 (Mwh)
Table 65.Germany Mobile Battery Market, By Sales Channel, 2020–2030 ($Million)
Table 66.Germany Mobile Battery Market, By Sales Channel, 2020–2030 (Mwh)
Table 67.France Mobile Battery Market, By Type, 2020–2030 ($Million)
Table 68.France Mobile Battery Market, By Type, 2020–2030 (Mwh)
Table 69.France Mobile Battery Market, By Application, 2020–2030 ($Million)
Table 70.France Mobile Battery Market, By Application, 2020–2030 (Mwh)
Table 71.France Mobile Battery Market, By Sales Channel, 2020–2030 ($Million)
Table 72.France Mobile Battery Market, By Sales Channel, 2020–2030 (Mwh)
Table 73.Uk Mobile Battery Market, By Type, 2020–2030 ($Million)
Table 74.Uk Mobile Battery Market, By Type, 2020–2030 (Mwh)
Table 75.Uk Mobile Battery Market, By Application, 2020–2030 ($Million)
Table 76.Uk Mobile Battery Market, By Application, 2020–2030 (Mwh)
Table 77.Uk Mobile Battery Market, By Sales Channel, 2020–2030 ($Million)
Table 78.Uk Mobile Battery Market, By Sales Channel, 2020–2030 (Mwh)
Table 79.Spain Mobile Battery Market, By Type, 2020–2030 ($Million)
Table 80.Spain Mobile Battery Market, By Type, 2020–2030 (Mwh)
Table 81.Spain Mobile Battery Market, By Application, 2020–2030 ($Million)
Table 82.Spain Mobile Battery Market, By Application, 2020–2030 (Mwh)
Table 83.Spain Mobile Battery Market, By Sales Channel, 2020–2030 ($Million)
Table 84.Spain Mobile Battery Market, By Sales Channel, 2020–2030 (Mwh)
Table 85.Italy Mobile Battery Market, By Type, 2020–2030 ($Million)
Table 86.Italy Mobile Battery Market, By Type, 2020–2030 (Mwh)
Table 87.Italy Mobile Battery Market, By Application, 2020–2030 ($Million)
Table 88.Italy Mobile Battery Market, By Application, 2020–2030 (Mwh)
Table 89.Italy Mobile Battery Market, By Sales Channel, 2020–2030 ($Million)
Table 90.Italy Mobile Battery Market, By Sales Channel, 2020–2030 (Mwh)
Table 91.Rest Of Europe Mobile Battery Market, By Type, 2020–2030 ($Million)
Table 92.Rest Of Europe Mobile Battery Market, By Type, 2020–2030 (Mwh)
Table 93.Rest Of Europe Mobile Battery Market, By Application, 2020–2030 ($Million)
Table 94.Rest Of Europe Mobile Battery Market, By Application, 2020–2030 (Mwh)
Table 95.Rest Of Europe Mobile Battery Market, By Sales Channel, 2020–2030 ($Million)
Table 96.Rest Of Europe Mobile Battery Market, By Sales Channel, 2020–2030 (Mwh)
Table 97.Asia-Pacific Mobile Battery Market, By Type, 2020–2030 ($Million)
Table 98.Asia-Pacific Mobile Battery Market, By Type, 2020–2030 (Mwh)
Table 99.Asia-Pacific Mobile Battery Market, By Application, 2020–2030 ($Million)
Table 100.Asia-Pacific Mobile Battery Market, By Application, 2020–2030 (Mwh)
Table 101.Asia-Pacific Mobile Battery Market, By Sales Channel, 2020–2030 ($Million)
Table 102.Asia-Pacific Mobile Battery Market, By Sales Channel, 2020–2030 (Mwh)
Table 103.Asia-Pacific Mobile Battery Market, By Country, 2020–2030 ($Million)
Table 104.Asia-Pacific Mobile Battery Market, By Country, 2020–2030 (Mwh)
Table 105.China Mobile Battery Market, By Type, 2020–2030 ($Million)
Table 106.China Mobile Battery Market, By Type, 2020–2030 (Mwh)
Table 107.China Mobile Battery Market, By Application, 2020–2030 ($Million)
Table 108.China Mobile Battery Market, By Application, 2020–2030 (Mwh)
Table 109.China Mobile Battery Market, By Sales Channel, 2020–2030 ($Million)
Table 110.China Mobile Battery Market, By Sales Channel, 2020–2030 (Mwh)
Table 111.Japan Mobile Battery Market, By Type, 2020–2030 ($Million)
Table 112.Japan Mobile Battery Market, By Type, 2020–2030 (Mwh)
Table 113.Japan Mobile Battery Market, By Application, 2020–2030 ($Million)
Table 114.Japan Mobile Battery Market, By Application, 2020–2030 (Mwh)
Table 115.Japan Mobile Battery Market, By Sales Channel, 2020–2030 ($Million)
Table 116.Japan Mobile Battery Market, By Sales Channel, 2020–2030 (Mwh)
Table 117.India Mobile Battery Market, By Type, 2020–2030 ($Million)
Table 118.India Mobile Battery Market, By Type, 2020–2030 (Mwh)
Table 119.India Mobile Battery Market, By Application, 2020–2030 ($Million)
Table 120.India Mobile Battery Market, By Application, 2020–2030 (Mwh)
Table 121.India Mobile Battery Market, By Sales Channel, 2020–2030 ($Million)
Table 122.India Mobile Battery Market, By Sales Channel, 2020–2030 (Mwh)
Table 123.Australia Mobile Battery Market, By Type, 2020–2030 ($Million)
Table 124.Australia Mobile Battery Market, By Type, 2020–2030 (Mwh)
Table 125.Australia Mobile Battery Market, By Application, 2020–2030 ($Million)
Table 126.Australia Mobile Battery Market, By Application, 2020–2030 (Mwh)
Table 127.Australia Mobile Battery Market, By Sales Channel, 2020–2030 ($Million)
Table 128.Australia Mobile Battery Market, By Sales Channel, 2020–2030 (Mwh)
Table 129.South Korea Mobile Battery Market, By Type, 2020–2030 ($Million)
Table 130.South Korea Mobile Battery Market, By Type, 2020–2030 (Mwh)
Table 131.South Korea Mobile Battery Market, By Application, 2020–2030 ($Million)
Table 132.South Korea Mobile Battery Market, By Application, 2020–2030 (Mwh)
Table 133.South Korea Mobile Battery Market, By Sales Channel, 2020–2030 ($Million)
Table 134.South Korea Mobile Battery Market, By Sales Channel, 2020–2030 (Mwh)
Table 135.Rest Of Asia-Pacific Mobile Battery Market, By Type, 2020–2030 ($Million)
Table 136.Rest Of Asia-Pacific Mobile Battery Market, By Type, 2020–2030 (Mwh)
Table 137.Rest Of Asia-Pacific Mobile Battery Market, By Application, 2020–2030 ($Million)
Table 138.Rest Of Asia-Pacific Mobile Battery Market, By Application, 2020–2030 (Mwh)
Table 139.Rest Of Asia-Pacific Mobile Battery Market, By Sales Channel, 2020–2030 ($Million)
Table 140.Rest Of Asia-Pacific Mobile Battery Market, By Sales Channel, 2020–2030 (Mwh)
Table 141.Lamea Mobile Battery Market, By Type, 2020–2030 ($Million)
Table 142.Lamea Mobile Battery Market, By Type, 2020–2030 (Mwh)
Table 143.Lamea Mobile Battery Market, By Application, 2020–2030 ($Million)
Table 144.Lamea Mobile Battery Market, By Application, 2020–2030 (Mwh)
Table 145.Lamea Mobile Battery Market, By Sales Channel, 2020–2030 ($Million)
Table 146.Lamea Mobile Battery Market, By Sales Channel, 2020–2030 (Mwh)
Table 147.Lamea Mobile Battery Market, By Country, 2020–2030 ($Million)
Table 148.Lamea Mobile Battery Market, By Country, 2020–2030 (Mwh)
Table 149.Brazil Mobile Battery Market, By Type, 2020–2030 ($Million)
Table 150.Brazil Mobile Battery Market, By Type, 2020–2030 (Mwh)
Table 151.Brazil Mobile Battery Market, By Application, 2020–2030 ($Million)
Table 152.Brazil Mobile Battery Market, By Application, 2020–2030 (Mwh)
Table 153.Brazil Mobile Battery Market, By Sales Channel, 2020–2030 ($Million)
Table 154.Brazil Mobile Battery Market, By Sales Channel, 2020–2030 (Mwh)
Table 155.Saudi Arabia Mobile Battery Market, By Type, 2020–2030 ($Million)
Table 156.Saudi Arabia Mobile Battery Market, By Type, 2020–2030 (Mwh)
Table 157.Saudi Arabia Mobile Battery Market, By Application, 2020–2030 ($Million)
Table 158.Saudi Arabia Mobile Battery Market, By Application, 2020–2030 (Mwh)
Table 159.Saudi Arabia Mobile Battery Market, By Sales Channel, 2020–2030 ($Million)
Table 160.Saudi Arabia Mobile Battery Market, By Sales Channel, 2020–2030 (Mwh)
Table 161.South Africa Mobile Battery Market, By Type, 2020–2030 ($Million)
Table 162.South Africa Mobile Battery Market, By Type, 2020–2030 (Mwh)
Table 163.South Africa Mobile Battery Market, By Application, 2020–2030 ($Million)
Table 164.South Africa Mobile Battery Market, By Application, 2020–2030 (Mwh)
Table 165.South Africa Mobile Battery Market, By Sales Channel, 2020–2030 ($Million)
Table 166.South Africa Mobile Battery Market, By Sales Channel, 2020–2030 (Mwh)
Table 167.Rest Of Lamea Mobile Battery Market, By Type, 2020–2030 ($Million)
Table 168.Rest Of Lamea Mobile Battery Market, By Type, 2020–2030 (Mwh)
Table 169.Rest Of Lamea Mobile Battery Market, By Application, 2020–2030 ($Million)
Table 170.Rest Of Lamea Mobile Battery Market, By Application, 2020–2030 (Mwh)
Table 171.Rest Of Lamea Mobile Battery Market, By Sales Channel, 2020–2030 ($Million)
Table 172.Rest Of Lamea Mobile Battery Market, By Sales Channel, 2020–2030 (Mwh)
Table 173.Key Acquisitions And Agreement (2017-2021)
Table 174.Amperex Technology Limited: Company Snapshot
Table 175.Amperex Technology Limited: Product Portfolio
Table 176.Amperex Technology Limited: Key Strategic Moves And Developments
Table 177.Amperex Technology Limited: Swot Analysis
Table 178.Lg Corporation: Company Snapshot
Table 179.Lg Corporation: Product Portfolio
Table 180.Overall Financial Status ($Million)
Table 181.Lg Corporation: Swot Analysis
Table 182.Maxell, Ltd.: Company Snapshot
Table 183.Maxell, Ltd.: Operating Segments
Table 184.Maxell, Ltd.: Product Portfolio
Table 185.Overall Financial Status ($Million)
Table 186.Maxell, Ltd.: Swot Analysis
Table 187.Murata Manufacturing Co., Ltd.: Company Snapshot
Table 188.Murata Manufacturing Co., Ltd.: Operating Segments
Table 189.Murata Manufacturing Co., Ltd.: Product Portfolio
Table 190.Overall Financial Status ($Million)
Table 191.Murata Manufacturing Co., Ltd.: Key Strategic Moves And Developments
Table 192.Murata Manufacturing Co., Ltd.: Swot Analysis
Table 193.Panasonic Corporation: Company Snapshot
Table 194.Panasonic Corporation: Operating Segments
Table 195.Panasonic Corporation: Product Portfolio
Table 196.Overall Financial Status ($Million)
Table 197.Panasonic Corporation: Swot Analysis
Table 198.Samsung Sdi Co., Ltd.: Company Snapshot
Table 199.Samsung Sdi Co., Ltd.: Operating Segments
Table 200.Samsung Sdi Co., Ltd.: Product Portfolio
Table 201.Overall Financial Status ($Million)
Table 202.Samsung Sdi Co., Ltd.: Swot Analysis
Table 203.Sunwoda Electronic Co., Ltd.: Company Snapshot
Table 204.Sunwoda Electronic Co., Ltd.: Product Portfolio
Table 205.Sunwoda Electronic Co., Ltd.: Swot Analysis
Table 206.Tianjin Lishen Battery Joint-Stock Co., Ltd.: Company Snapshot
Table 207.Tianjin Lishen Battery Joint-Stock Co., Ltd.: Product Portfolio
Table 208.Tianjin Lishen Battery Joint-Stock Co., Ltd.: Swot Analysis
Table 209.Tws: Company Snapshot
Table 210.Tws: Product Portfolio
Table 211.Tws: Swot Analysis
Table 212.Zhuhai Cosmx Battery Co., Ltd.: Company Snapshot
Table 213.Zhuhai Cosmx Battery Co., Ltd.: Product Portfolio
Table 214.Zhuhai Cosmx Battery Co., Ltd.: Swot Analysis
List Of Figures
Figure 01.Key Market Segments
Figure 02.Moderate Bargaining Power Of Suppliers
Figure 03.Moderate Threat Of New Entrants
Figure 04.Moderate Threat Of Substitutes
Figure 05.Moderate Intensity Of Competitive Rivalry
Figure 06.Moderate Bargaining Power Of Buyers
Figure 07.Value Chain Analysis
Figure 08.Top Investment Pockets
Figure 09.Patent Analysis, By Region
Figure 10.Mobile Battery Market Dynamics
Figure 11.Mobile Battery Market, By Type, 2020–2030
Figure 12.Comparative Analysis Of Mobile Battery Market For Lithium-Ion Battery, By Country, 2020 & 2030 ($Million)
Figure 13.Comparative Analysis Of Mobile Battery Market For Nickel-Based Battery, By Country, 2020 & 2030 ($Million)
Figure 14.Comparative Analysis Of Mobile Battery Market For Others, By Country, 2020 & 2030 ($Million)
Figure 15.Mobile Battery Market, By Application, 2020–2030
Figure 16.Comparative Analysis Of Mobile Battery Market For Smartphones, By Country, 2020 & 2030 ($Million)
Figure 17.Comparative Analysis Of Mobile Battery Market For Non-Smartphones, By Country, 2020 & 2030 ($Million)
Figure 18.Mobile Battery Market, By Sales Channel, 2020–2030
Figure 19.Comparative Analysis Of Mobile Battery Market For Online, By Country, 2020 & 2030 ($Million)
Figure 20.Comparative Analysis Of Mobile Battery Market For Offline, By Country, 2020 & 2030 ($Million)
Figure 21.U.S. Mobile Battery Market Revenue, 2020–2030 ($Million)
Figure 22.Canada Mobile Battery Market Revenue, 2020–2030 ($Million)
Figure 23.Mexico Mobile Battery Market Revenue, 2020–2030 ($Million)
Figure 24.Germany Mobile Battery Market Revenue, 2020–2030 ($Million)
Figure 25.France Mobile Battery Market Revenue, 2020–2030 ($Million)
Figure 26.Uk Mobile Battery Market Revenue, 2020–2030 ($Million)
Figure 27.Spain Mobile Battery Market Revenue, 2020–2030 ($Million)
Figure 28.Italy Mobile Battery Market Revenue, 2020–2030 ($Million)
Figure 29.Rest Of Europe Mobile Battery Market Revenue, 2020–2030 ($Million)
Figure 30.China Mobile Battery Market Revenue, 2020–2030 ($Million)
Figure 31.Japan Mobile Battery Market Revenue, 2020–2030 ($Million)
Figure 32.India Mobile Battery Market Revenue, 2020–2030 ($Million)
Figure 33.Australia Mobile Battery Market Revenue, 2020–2030 ($Million)
Figure 34.South Korea Mobile Battery Market Revenue, 2020–2030 ($Million)
Figure 35.Rest Of Asia-Pacific Mobile Battery Market Revenue, 2020–2030 ($Million)
Figure 36.Brazil Mobile Battery Market Revenue, 2020–2030 ($Million)
Figure 37.Saudi Arabia Mobile Battery Market Revenue, 2020–2030 ($Million)
Figure 38.South Africa Mobile Battery Market Revenue, 2020–2030 ($Million)
Figure 39.Rest Of Lamea Mobile Battery Market Revenue, 2020–2030 ($Million)
Figure 40.Market Player Positioning, 2020
Figure 41.Product Mapping Of Top 10 Players
Figure 42.Competitive Heatmap Of Key Players
Figure 43.Lg Corporation: Revenue, 2018–2020 ($Million)
Figure 44.Maxell, Ltd.: Revenue, 2018–2020 ($Million)
Figure 45.Maxell, Ltd.: Revenue Share By Segment, 2020 (%)
Figure 46.Maxell, Ltd.: Revenue Share By Region, 2020 (%)
Figure 47.Murata Manufacturing Co., Ltd.: Revenue, 2018–2020 ($Million)
Figure 48.Murata Manufacturing Co., Ltd.: Revenue Share By Segment, 2020 (%)
Figure 49.Murata Manufacturing Co., Ltd.: Revenue Share By Region, 2020 (%)
Figure 50.Panasonic Corporation: Revenue, 2018–2020 ($Million)
Figure 51.Panasonic Corporation: Revenue Share By Segment, 2020 (%)
Figure 52.Panasonic Corporation: Revenue Share By Region, 2020 (%)
Figure 53.Samsung Sdi Co., Ltd.: Revenue, 2018–2020 ($Million)
Figure 54.Samsung Sdi Co., Ltd.: Revenue Share By Segment, 2020 (%)
Figure 55.Samsung Sdi Co., Ltd.: Revenue Share By Region, 2020 (%)
$6168
$10663
HAVE A QUERY?
OUR CUSTOMER

Add to Cart
Add to Cart
Add to Cart
Add to Cart