0
U.S. (TOLL FREE)
+1 (315) 215-3225
Automative

0
U.S. (TOLL FREE)
+1 (315) 215-3225
Dementia Drugs - Global Market Insights and Sales Trends 2024
Published Date: November 2023
|
Report Code: QYRE-Auto-0A7258
Home | Market Reports | Health| Aging & Geriatrics
Global Dementia Drugs Market Insights and Forecast to 2028
BUY CHAPTERS

Dementia Drugs - Global Market Insights and Sales Trends 2024

Code: QYRE-Auto-0A7258
Report
November 2023
Pages:119
QYResearch
Buy Now with 15% Discount
DESCRIPTION
TABLE OF CONTENT
TABLES & FIGURES

Dementia Drugs - Market Size

The global Dementia Drugs market size is expected to reach US$ 15560 million by 2029, growing at a CAGR of 8.4% from 2023 to 2029.

Dementia Drugs -  Market

Dementia Drugs - Market

Dementia is the term used to describe the symptoms of a large group of illnesses that cause a progressive decline in a person’s functioning.
It is a broad term to describe a loss of memory, intellect, rationality, social skills and what would be considered normal emotional reactions. Dementia causes significant impairment in a person’s day to day functioning.
There are no drug treatments that can cure Alzheimer’s disease or any other common type of dementia. However, there are medicines for Alzheimer’s disease that can ease symptoms for a while, or slow down their progression, in some people. These drugs do not slow down or stop the progression of the underlying disease in the brain.
This report focus on Dementia Drugs market.
The market is mainly driven by the significant applications of Dementia Drugs in various end use industries. The expanding demands from the Hospital Pharmacies, Retail Pharmacies and Others,, are propelling Dementia Drugs market. MAO Inhibitors, one of the segments analysed in this report, is projected to record % CAGR and reach US$ million by the end of the analysis period. Growth in the Cholinesterase Inhibitors segment is estimated at % CAGR for the next seven-year period.
The global pharmaceutical market is 1475 billion USD in 2022, growing at a CAGR of 5% during the next six years. The pharmaceutical market includes chemical drugs and biological drugs. For biologics is expected to 381 billion USD in 2022. In comparison, the chemical drug market is estimated to increase from 1005 billion in 2018 to 1094 billion U.S. dollars in 2022. The pharmaceutical market factors such as increasing demand for healthcare, technological advancements, and the rising prevalence of chronic diseases, increase in funding from private & government organizations for development of pharmaceutical manufacturing segments and rise in R&D activities for drugs. However, the industry also faces challenges such as stringent regulations, high costs of research and development, and patent expirations. Companies need to continuously innovate and adapt to these challenges to stay competitive in the market and ensure their products reach patients in need. Additionally, the COVID-19 pandemic has highlighted the importance of vaccine development and supply chain management, further emphasizing the need for pharmaceutical companies to be agile and responsive to emerging public health needs.

Report Objectives

This report provides market insight on the different segments, by manufacturers, by Type, by Application. Market size and forecast (2018-2029) has been provided in the report. The primary objectives of this report are to provide 1) global market size and forecasts, growth rates, market dynamics, industry structure and developments, market situation, trends; 2) global market share and ranking by company; 3) comprehensive presentation of the global market for Dementia Drugs, with both quantitative and qualitative analysis through detailed segmentation; 4) detailed value chain analysis and review of growth factors essential for the existing market players and new entrants; 5) emerging opportunities in the market and the future impact of major drivers and restraints of the market.

Key Features of The Study:

This report provides in-depth analysis of the global Dementia Drugs market, and provides market size (US$ million) and CAGR for the forecast period (2023-2029), considering 2022 as the base year.
This report profiles key players in the global Dementia Drugs market based on the following parameters - company details (found date, headquarters, manufacturing bases), products portfolio, Dementia Drugs sales data, market share and ranking.
This report elucidates potential market opportunities across different segments and explains attractive investment proposition matrices for this market.
This report illustrates key insights about market drivers, restraints, opportunities, market trends, regional outlook.
Key companies of Dementia Drugs covered in this report include Eisai, Inc, Janssen Pharmaceuticals, Inc, Biogen Pharmaceuticals, Forest Laboratories, Inc, Eli Lilly and Company, Novartis AG, Sanofi S.A, AstraZeneca GmbH and F. Hoffmann-La Roche, etc.
The global Dementia Drugs market report caters to various stakeholders in this industry including investors, suppliers, product manufacturers, distributors, new entrants, and financial analysts.
Market Segmentation
Company Profiles:
Eisai, Inc
Janssen Pharmaceuticals, Inc
Biogen Pharmaceuticals
Forest Laboratories, Inc
Eli Lilly and Company
Novartis AG
Sanofi S.A
AstraZeneca GmbH
F. Hoffmann-La Roche
Merck & Co., Inc
Valeant Pharmaceutical International
Pfizer Inc
Teva Pharmaceuticals Industries
Aurobindo Pharma
Zydus Cadila
Johnson and Johnson
Apotex inc.
Abbvie Inc

Scope of Dementia Drugs - Market Report

Report Metric Details
Report Name Dementia Drugs - Market
Forecasted market size in 2029 US$ 15560 million
CAGR 8.4%
Forecasted years 2023 - 2029
Global Dementia Drugs market, by region:
  • North America (U.S., Canada, Mexico)
  • Europe (Germany, France, UK, Italy, etc.)
  • Asia Pacific (China, Japan, South Korea, Southeast Asia, India, etc.)
  • South America (Brazil, etc.)
  • Middle East and Africa (Turkey, GCC Countries, Africa, etc.)
Global Dementia Drugs market, Segment by Type:
  • MAO Inhibitors
  • Cholinesterase Inhibitors
  • Glutamate Inhibitors
Global Dementia Drugs market, by Application
  • Hospital Pharmacies
  • Retail Pharmacies
  • Others
Forecast units USD million in value
Report coverage Revenue and volume forecast, company share, competitive landscape, growth factors and trends

Core Chapters

  • Chapter One: Introduces the study scope of this report, executive summary of market segments by Type, market size segments for North America, Europe, Asia Pacific, South America, Middle East & Africa.
  • Chapter Two: Detailed analysis of Dementia Drugs manufacturers competitive landscape, price, sales, revenue, market share and ranking, latest development plan, merger, and acquisition information, etc.
  • Chapter Three: Sales, revenue of Dementia Drugs in regional level. It provides a quantitative analysis of the market size and development potential of each region and introduces the future development prospects, and market space in the world.
  • Chapter Four: Introduces market segments by Application, market size segment for North America, Europe, Asia Pacific, South America, Middle East & Africa.
  • Chapter Five, Six, Seven, Eight and Nine: North America, Europe, Asia Pacific, South America, Middle East & Africa, sales and revenue by country.
  • Chapter Ten: Provides profiles of key players, introducing the basic situation of the main companies in the market in detail, including product sales, revenue, price, gross margin, product introduction, recent development, etc.
  • Chapter Eleven: Analysis of industrial chain, key raw materials, manufacturing cost, and market dynamics. Introduces the market dynamics, latest developments of the market, the driving factors and restrictive factors of the market, the challenges and risks faced by manufacturers in the industry, and the analysis of relevant policies in the industry.
  • Chapter Twelve: Analysis of sales channel, distributors and customers.
  • Chapter Thirteen: Research Findings and Conclusion.

FAQ for this report

What is the Dementia Drugs - Market size in 2029?

Ans: The Dementia Drugs - Market size in 2029 will be US$ 15560 million.

What are the Application segmentation covered in the Dementia Drugs - Market report?

Ans: The Applications covered in the Dementia Drugs - Market report are Hospital Pharmacies, Retail Pharmacies, Others

What are the Type segmentation covered in the Dementia Drugs - Market report?

Ans: The Types covered in the Dementia Drugs - Market report are MAO Inhibitors, Cholinesterase Inhibitors, Glutamate Inhibitors

1 Dementia Drugs Market Overview
1.1 Dementia Drugs Product Overview
1.2 Dementia Drugs Market Segment by Type
1.2.1 MAO Inhibitors
1.2.2 Cholinesterase Inhibitors
1.2.3 Glutamate Inhibitors
1.3 Global Dementia Drugs Market Size by Type
1.3.1 Global Dementia Drugs Market Size Overview by Type (2018-2029)
1.3.2 Global Dementia Drugs Historic Market Size Review by Type (2018-2023)
1.3.3 Global Dementia Drugs Forecasted Market Size by Type (2024-2029)
1.4 Key Regions Market Size Segment by Type
1.4.1 North America Dementia Drugs Sales Breakdown by Type (2018-2023)
1.4.2 Europe Dementia Drugs Sales Breakdown by Type (2018-2023)
1.4.3 Asia-Pacific Dementia Drugs Sales Breakdown by Type (2018-2023)
1.4.4 Latin America Dementia Drugs Sales Breakdown by Type (2018-2023)
1.4.5 Middle East and Africa Dementia Drugs Sales Breakdown by Type (2018-2023)
2 Global Dementia Drugs Market Competition by Company
2.1 Global Top Players by Dementia Drugs Sales (2018-2023)
2.2 Global Top Players by Dementia Drugs Revenue (2018-2023)
2.3 Global Top Players by Dementia Drugs Price (2018-2023)
2.4 Global Top Manufacturers Dementia Drugs Manufacturing Base Distribution, Sales Area, Product Type
2.5 Dementia Drugs Market Competitive Situation and Trends
2.5.1 Dementia Drugs Market Concentration Rate (2018-2023)
2.5.2 Global 5 and 10 Largest Manufacturers by Dementia Drugs Sales and Revenue in 2022
2.6 Global Top Manufacturers by Company Type (Tier 1, Tier 2 and Tier 3) & (based on the Revenue in Dementia Drugs as of 2022)
2.7 Date of Key Manufacturers Enter into Dementia Drugs Market
2.8 Key Manufacturers Dementia Drugs Product Offered
2.9 Mergers & Acquisitions, Expansion
3 Dementia Drugs Status and Outlook by Region
3.1 Global Dementia Drugs Market Size and CAGR by Region: 2018 VS 2022 VS 2029
3.2 Global Dementia Drugs Historic Market Size by Region
3.2.1 Global Dementia Drugs Sales in Volume by Region (2018-2023)
3.2.2 Global Dementia Drugs Sales in Value by Region (2018-2023)
3.2.3 Global Dementia Drugs Sales (Volume & Value) Price and Gross Margin (2018-2023)
3.3 Global Dementia Drugs Forecasted Market Size by Region
3.3.1 Global Dementia Drugs Sales in Volume by Region (2024-2029)
3.3.2 Global Dementia Drugs Sales in Value by Region (2024-2029)
3.3.3 Global Dementia Drugs Sales (Volume & Value), Price and Gross Margin (2024-2029)
4 Global Dementia Drugs by Application
4.1 Dementia Drugs Market Segment by Application
4.1.1 Hospital Pharmacies
4.1.2 Retail Pharmacies
4.1.3 Others
4.2 Global Dementia Drugs Market Size by Application
4.2.1 Global Dementia Drugs Market Size Overview by Application (2018-2029)
4.2.2 Global Dementia Drugs Historic Market Size Review by Application (2018-2023)
4.2.3 Global Dementia Drugs Forecasted Market Size by Application (2024-2029)
4.3 Key Regions Market Size Segment by Application
4.3.1 North America Dementia Drugs Sales Breakdown by Application (2018-2023)
4.3.2 Europe Dementia Drugs Sales Breakdown by Application (2018-2023)
4.3.3 Asia-Pacific Dementia Drugs Sales Breakdown by Application (2018-2023)
4.3.4 Latin America Dementia Drugs Sales Breakdown by Application (2018-2023)
4.3.5 Middle East and Africa Dementia Drugs Sales Breakdown by Application (2018-2023)
5 North America Dementia Drugs by Country
5.1 North America Dementia Drugs Historic Market Size by Country
5.1.1 North America Dementia Drugs Market Size Growth Rate (CAGR) by Country: 2018 VS 2022 VS 2029
5.1.2 North America Dementia Drugs Sales in Volume by Country (2018-2023)
5.1.3 North America Dementia Drugs Sales in Value by Country (2018-2023)
5.2 North America Dementia Drugs Forecasted Market Size by Country
5.2.1 North America Dementia Drugs Sales in Volume by Country (2024-2029)
5.2.2 North America Dementia Drugs Sales in Value by Country (2024-2029)
6 Europe Dementia Drugs by Country
6.1 Europe Dementia Drugs Historic Market Size by Country
6.1.1 Europe Dementia Drugs Market Size Growth Rate (CAGR) by Country: 2018 VS 2022 VS 2029
6.1.2 Europe Dementia Drugs Sales in Volume by Country (2018-2023)
6.1.3 Europe Dementia Drugs Sales in Value by Country (2018-2023)
6.2 Europe Dementia Drugs Forecasted Market Size by Country
6.2.1 Europe Dementia Drugs Sales in Volume by Country (2024-2029)
6.2.2 Europe Dementia Drugs Sales in Value by Country (2024-2029)
7 Asia-Pacific Dementia Drugs by Region
7.1 Asia-Pacific Dementia Drugs Historic Market Size by Region
7.1.1 Asia-Pacific Dementia Drugs Market Size Growth Rate (CAGR) by Region: 2018 VS 2022 VS 2029
7.1.2 Asia-Pacific Dementia Drugs Sales in Volume by Region (2018-2023)
7.1.3 Asia-Pacific Dementia Drugs Sales in Value by Region (2018-2023)
7.2 Asia-Pacific Dementia Drugs Forecasted Market Size by Region
7.2.1 Asia-Pacific Dementia Drugs Sales in Volume by Region (2024-2029)
7.2.2 Asia-Pacific Dementia Drugs Sales in Value by Region (2024-2029)
8 Latin America Dementia Drugs by Country
8.1 Latin America Dementia Drugs Historic Market Size by Country
8.1.1 Latin America Dementia Drugs Market Size Growth Rate (CAGR) by Country: 2018 VS 2022 VS 2029
8.1.2 Latin America Dementia Drugs Sales in Volume by Country (2018-2023)
8.1.3 Latin America Dementia Drugs Sales in Value by Country (2018-2023)
8.2 Latin America Dementia Drugs Forecasted Market Size by Country
8.2.1 Latin America Dementia Drugs Sales in Volume by Country (2024-2029)
8.2.2 Latin America Dementia Drugs Sales in Value by Country (2024-2029)
9 Middle East and Africa Dementia Drugs by Country
9.1 Middle East and Africa Dementia Drugs Historic Market Size by Country
9.1.1 Middle East and Africa Dementia Drugs Market Size Growth Rate (CAGR) by Country: 2018 VS 2022 VS 2029
9.1.2 Middle East and Africa Dementia Drugs Sales in Volume by Country (2018-2023)
9.1.3 Middle East and Africa Dementia Drugs Sales in Value by Country (2018-2023)
9.2 Middle East and Africa Dementia Drugs Forecasted Market Size by Country
9.2.1 Middle East and Africa Dementia Drugs Sales in Volume by Country (2024-2029)
9.2.2 Middle East and Africa Dementia Drugs Sales in Value by Country (2024-2029)
10 Company Profiles
10.1 Eisai, Inc
10.1.1 Eisai, Inc Company Information
10.1.2 Eisai, Inc Introduction and Business Overview
10.1.3 Eisai, Inc Dementia Drugs Sales, Revenue and Gross Margin (2018-2023)
10.1.4 Eisai, Inc Dementia Drugs Products Offered
10.1.5 Eisai, Inc Recent Development
10.2 Janssen Pharmaceuticals, Inc
10.2.1 Janssen Pharmaceuticals, Inc Company Information
10.2.2 Janssen Pharmaceuticals, Inc Introduction and Business Overview
10.2.3 Janssen Pharmaceuticals, Inc Dementia Drugs Sales, Revenue and Gross Margin (2018-2023)
10.2.4 Janssen Pharmaceuticals, Inc Dementia Drugs Products Offered
10.2.5 Janssen Pharmaceuticals, Inc Recent Development
10.3 Biogen Pharmaceuticals
10.3.1 Biogen Pharmaceuticals Company Information
10.3.2 Biogen Pharmaceuticals Introduction and Business Overview
10.3.3 Biogen Pharmaceuticals Dementia Drugs Sales, Revenue and Gross Margin (2018-2023)
10.3.4 Biogen Pharmaceuticals Dementia Drugs Products Offered
10.3.5 Biogen Pharmaceuticals Recent Development
10.4 Forest Laboratories, Inc
10.4.1 Forest Laboratories, Inc Company Information
10.4.2 Forest Laboratories, Inc Introduction and Business Overview
10.4.3 Forest Laboratories, Inc Dementia Drugs Sales, Revenue and Gross Margin (2018-2023)
10.4.4 Forest Laboratories, Inc Dementia Drugs Products Offered
10.4.5 Forest Laboratories, Inc Recent Development
10.5 Eli Lilly and Company
10.5.1 Eli Lilly and Company Company Information
10.5.2 Eli Lilly and Company Introduction and Business Overview
10.5.3 Eli Lilly and Company Dementia Drugs Sales, Revenue and Gross Margin (2018-2023)
10.5.4 Eli Lilly and Company Dementia Drugs Products Offered
10.5.5 Eli Lilly and Company Recent Development
10.6 Novartis AG
10.6.1 Novartis AG Company Information
10.6.2 Novartis AG Introduction and Business Overview
10.6.3 Novartis AG Dementia Drugs Sales, Revenue and Gross Margin (2018-2023)
10.6.4 Novartis AG Dementia Drugs Products Offered
10.6.5 Novartis AG Recent Development
10.7 Sanofi S.A
10.7.1 Sanofi S.A Company Information
10.7.2 Sanofi S.A Introduction and Business Overview
10.7.3 Sanofi S.A Dementia Drugs Sales, Revenue and Gross Margin (2018-2023)
10.7.4 Sanofi S.A Dementia Drugs Products Offered
10.7.5 Sanofi S.A Recent Development
10.8 AstraZeneca GmbH
10.8.1 AstraZeneca GmbH Company Information
10.8.2 AstraZeneca GmbH Introduction and Business Overview
10.8.3 AstraZeneca GmbH Dementia Drugs Sales, Revenue and Gross Margin (2018-2023)
10.8.4 AstraZeneca GmbH Dementia Drugs Products Offered
10.8.5 AstraZeneca GmbH Recent Development
10.9 F. Hoffmann-La Roche
10.9.1 F. Hoffmann-La Roche Company Information
10.9.2 F. Hoffmann-La Roche Introduction and Business Overview
10.9.3 F. Hoffmann-La Roche Dementia Drugs Sales, Revenue and Gross Margin (2018-2023)
10.9.4 F. Hoffmann-La Roche Dementia Drugs Products Offered
10.9.5 F. Hoffmann-La Roche Recent Development
10.10 Merck & Co., Inc
10.10.1 Merck & Co., Inc Company Information
10.10.2 Merck & Co., Inc Introduction and Business Overview
10.10.3 Merck & Co., Inc Dementia Drugs Sales, Revenue and Gross Margin (2018-2023)
10.10.4 Merck & Co., Inc Dementia Drugs Products Offered
10.10.5 Merck & Co., Inc Recent Development
10.11 Valeant Pharmaceutical International
10.11.1 Valeant Pharmaceutical International Company Information
10.11.2 Valeant Pharmaceutical International Introduction and Business Overview
10.11.3 Valeant Pharmaceutical International Dementia Drugs Sales, Revenue and Gross Margin (2018-2023)
10.11.4 Valeant Pharmaceutical International Dementia Drugs Products Offered
10.11.5 Valeant Pharmaceutical International Recent Development
10.12 Pfizer Inc
10.12.1 Pfizer Inc Company Information
10.12.2 Pfizer Inc Introduction and Business Overview
10.12.3 Pfizer Inc Dementia Drugs Sales, Revenue and Gross Margin (2018-2023)
10.12.4 Pfizer Inc Dementia Drugs Products Offered
10.12.5 Pfizer Inc Recent Development
10.13 Teva Pharmaceuticals Industries
10.13.1 Teva Pharmaceuticals Industries Company Information
10.13.2 Teva Pharmaceuticals Industries Introduction and Business Overview
10.13.3 Teva Pharmaceuticals Industries Dementia Drugs Sales, Revenue and Gross Margin (2018-2023)
10.13.4 Teva Pharmaceuticals Industries Dementia Drugs Products Offered
10.13.5 Teva Pharmaceuticals Industries Recent Development
10.14 Aurobindo Pharma
10.14.1 Aurobindo Pharma Company Information
10.14.2 Aurobindo Pharma Introduction and Business Overview
10.14.3 Aurobindo Pharma Dementia Drugs Sales, Revenue and Gross Margin (2018-2023)
10.14.4 Aurobindo Pharma Dementia Drugs Products Offered
10.14.5 Aurobindo Pharma Recent Development
10.15 Zydus Cadila
10.15.1 Zydus Cadila Company Information
10.15.2 Zydus Cadila Introduction and Business Overview
10.15.3 Zydus Cadila Dementia Drugs Sales, Revenue and Gross Margin (2018-2023)
10.15.4 Zydus Cadila Dementia Drugs Products Offered
10.15.5 Zydus Cadila Recent Development
10.16 Johnson and Johnson
10.16.1 Johnson and Johnson Company Information
10.16.2 Johnson and Johnson Introduction and Business Overview
10.16.3 Johnson and Johnson Dementia Drugs Sales, Revenue and Gross Margin (2018-2023)
10.16.4 Johnson and Johnson Dementia Drugs Products Offered
10.16.5 Johnson and Johnson Recent Development
10.17 Apotex inc.
10.17.1 Apotex inc. Company Information
10.17.2 Apotex inc. Introduction and Business Overview
10.17.3 Apotex inc. Dementia Drugs Sales, Revenue and Gross Margin (2018-2023)
10.17.4 Apotex inc. Dementia Drugs Products Offered
10.17.5 Apotex inc. Recent Development
10.18 Abbvie Inc
10.18.1 Abbvie Inc Company Information
10.18.2 Abbvie Inc Introduction and Business Overview
10.18.3 Abbvie Inc Dementia Drugs Sales, Revenue and Gross Margin (2018-2023)
10.18.4 Abbvie Inc Dementia Drugs Products Offered
10.18.5 Abbvie Inc Recent Development
11 Upstream, Opportunities, Challenges, Risks and Influences Factors Analysis
11.1 Dementia Drugs Key Raw Materials
11.1.1 Key Raw Materials
11.1.2 Key Raw Materials Price
11.1.3 Raw Materials Key Suppliers
11.2 Manufacturing Cost Structure
11.2.1 Raw Materials
11.2.2 Labor Cost
11.2.3 Manufacturing Expenses
11.3 Dementia Drugs Industrial Chain Analysis
11.4 Dementia Drugs Market Dynamics
11.4.1 Dementia Drugs Industry Trends
11.4.2 Dementia Drugs Market Drivers
11.4.3 Dementia Drugs Market Challenges
11.4.4 Dementia Drugs Market Restraints
12 Market Strategy Analysis, Distributors
12.1 Sales Channel
12.2 Dementia Drugs Distributors
12.3 Dementia Drugs Downstream Customers
13 Research Findings and Conclusion
14 Appendix
14.1 Research Methodology
14.1.1 Methodology/Research Approach
14.1.2 Data Source
14.2 Author Details
14.3 Disclaimer
List of Tables
    Table 1. Major Company of MAO Inhibitors
    Table 2. Major Company of Cholinesterase Inhibitors
    Table 3. Major Company of Glutamate Inhibitors
    Table 4. Global Dementia Drugs Sales by Type 2018 VS 2022 VS 2029 (US$ Million)
    Table 5. Global Dementia Drugs Sales by Type (2018-2023) & (K Units)
    Table 6. Global Dementia Drugs Sales Market Share in Volume by Type (2018-2023)
    Table 7. Global Dementia Drugs Sales by Type (2018-2023) & (US& Million)
    Table 8. Global Dementia Drugs Market Share in Value by Type (2018-2023)
    Table 9. Global Dementia Drugs Price by Type (2018-2023) & (USD/Unit)
    Table 10. Global Dementia Drugs Sales by Type (2024-2029) & (K Units)
    Table 11. Global Dementia Drugs Sales Market Share in Volume by Type (2024-2029)
    Table 12. Global Dementia Drugs Sales by Type (2024-2029) & (US$ Million)
    Table 13. Global Dementia Drugs Sales Market Share in Value by Type (2024-2029)
    Table 14. Global Dementia Drugs Price by Type (2024-2029) & (USD/Unit)
    Table 15. North America Dementia Drugs Sales by Type (2018-2023) & (K Units)
    Table 16. North America Dementia Drugs Sales by Type (2018-2023) & (US$ Million)
    Table 17. Europe Dementia Drugs Sales (K Units) by Type (2018-2023)
    Table 18. Europe Dementia Drugs Sales by Type (2018-2023) & (US$ Million)
    Table 19. Asia-Pacific Dementia Drugs Sales (K Units) by Type (2018-2023)
    Table 20. Asia-Pacific Dementia Drugs Sales by Type (2018-2023) & (US$ Million)
    Table 21. Latin America Dementia Drugs Sales (K Units) by Type (2018-2023)
    Table 22. Latin America Dementia Drugs Sales by Type (2018-2023) & (US$ Million)
    Table 23. Middle East and Africa Dementia Drugs Sales (K Units) by Type (2018-2023)
    Table 24. Middle East and Africa Dementia Drugs Sales by Type (2018-2023) & (US$ Million)
    Table 25. Global Dementia Drugs Sales by Company (2018-2023) & (K Units)
    Table 26. Global Dementia Drugs Sales Share by Company (2018-2023)
    Table 27. Global Dementia Drugs Revenue by Company (2018-2023) & (US$ Million)
    Table 28. Global Dementia Drugs Revenue Share by Company (2018-2023)
    Table 29. Global Market Dementia Drugs Price by Company (2018-2023) & (USD/Unit)
    Table 30. Global Dementia Drugs Top Manufacturers Manufacturing Base Distribution and Sales Area
    Table 31. Global Dementia Drugs Manufacturers Market Concentration Ratio (CR5 and HHI)
    Table 32. Global Top Manufacturers Market Share by Company Type (Tier 1, Tier 2 and Tier 3) & (based on the Revenue in Dementia Drugs as of 2022)
    Table 33. Date of Key Manufacturers Enter into Dementia Drugs Market
    Table 34. Key Manufacturers Dementia Drugs Product Type
    Table 35. Mergers & Acquisitions, Expansion Plans
    Table 36. Global Dementia Drugs Market Size Comparison by Region (US$ Million): 2018 VS 2022 VS 2029
    Table 37. Global Dementia Drugs Sales by Region (2018-2023) & (K Units)
    Table 38. Global Dementia Drugs Sales Market Share in Volume by Region (2018-2023)
    Table 39. Global Dementia Drugs Sales by Region (2018-2023) & (US$ Million)
    Table 40. Global Dementia Drugs Sales Market Share in Value by Region (2018-2023)
    Table 41. Global Dementia Drugs Sales (K Units), Revenue (US$ Million), Price (USD/Unit) and Gross Margin (2018-2023)
    Table 42. Global Dementia Drugs Sales by Region (2024-2029) & (K Units)
    Table 43. Global Dementia Drugs Sales Market Share in Volume by Region (2024-2029)
    Table 44. Global Dementia Drugs Sales by Region (2024-2029) & (US$ Million)
    Table 45. Global Dementia Drugs Sales Market Share in Value by Region (2024-2029)
    Table 46. Global Dementia Drugs Sales (K Units), Revenue (US$ Million), Price (USD/Unit) and Gross Margin (2024-2029)
    Table 47. Global Dementia Drugs Sales by Application: 2018 VS 2022 VS 2029 (US$ Million)
    Table 48. Global Dementia Drugs Sales by Application (2018-2023) & (K Units)
    Table 49. Global Dementia Drugs Sales Market Share in Volume by Application (2018-2023)
    Table 50. Global Dementia Drugs Sales by Application (2018-2023) & (US$ Million)
    Table 51. Global Dementia Drugs Sales Market Share in Value by Application (2018-2023)
    Table 52. Global Dementia Drugs Price by Application (2018-2023) & (USD/Unit)
    Table 53. Global Dementia Drugs Sales by Application (2024-2029) & (K Units)
    Table 54. Global Dementia Drugs Sales Market Share in Volume by Application (2024-2029)
    Table 55. Global Dementia Drugs Sales by Application (2024-2029) & (US$ Million)
    Table 56. Global Dementia Drugs Sales Market Share in Value by Application (2024-2029)
    Table 57. Global Dementia Drugs Price by Application (2024-2029) & (USD/Unit)
    Table 58. North America Dementia Drugs Sales by Application (2018-2023) (K Units)
    Table 59. North America Dementia Drugs Sales by Application (2018-2023) & (US$ Million)
    Table 60. Europe Dementia Drugs Sales by Application (2018-2023) (K Units)
    Table 61. Europe Dementia Drugs Sales by Application (2018-2023) & (US$ Million)
    Table 62. Asia-Pacific Dementia Drugs Sales by Application (2018-2023) (K Units)
    Table 63. Asia-Pacific Dementia Drugs Sales by Application (2018-2023) & (US$ Million)
    Table 64. Latin America Dementia Drugs Sales by Application (2018-2023) (K Units)
    Table 65. Latin America Dementia Drugs Sales by Application (2018-2023) & (US$ Million)
    Table 66. Middle East and Africa Dementia Drugs Sales by Application (2018-2023) (K Units)
    Table 67. Middle East and Africa Dementia Drugs Sales by Application (2018-2023) & (US$ Million)
    Table 68. North America Dementia Drugs Sales by Country (2018-2023) & (K Units)
    Table 69. North America Dementia Drugs Sales Market Share in Volume by Country (2018-2023)
    Table 70. North America Dementia Drugs Sales by Country (2018-2023) & (US$ Million)
    Table 71. North America Dementia Drugs Sales Market Share in Value by Country (2018-2023)
    Table 72. North America Dementia Drugs Sales by Country (2024-2029) & (K Units)
    Table 73. North America Dementia Drugs Sales Market Share in Volume by Country (2024-2029)
    Table 74. North America Dementia Drugs Sales by Country (2024-2029) & (US$ Million)
    Table 75. North America Dementia Drugs Sales Market Share in Value by Country (2024-2029)
    Table 76. Europe Dementia Drugs Sales by Country (2018-2023) & (K Units)
    Table 77. Europe Dementia Drugs Sales Market Share in Volume by Country (2018-2023)
    Table 78. Europe Dementia Drugs Sales by Country (2018-2023) & (US$ Million)
    Table 79. Europe Dementia Drugs Sales Market Share in Value by Country (2018-2023)
    Table 80. Europe Dementia Drugs Sales by Country (2024-2029) & (K Units)
    Table 81. Europe Dementia Drugs Sales Market Share in Volume by Country (2024-2029)
    Table 82. Europe Dementia Drugs Sales by Country (2024-2029) & (US$ Million)
    Table 83. Europe Dementia Drugs Sales Market Share in Value by Country (2024-2029)
    Table 84. Asia-Pacific Dementia Drugs Sales by Region (2018-2023) & (K Units)
    Table 85. Asia-Pacific Dementia Drugs Sales Market Share in Volume by Region (2018-2023)
    Table 86. Asia-Pacific Dementia Drugs Sales by Region (2018-2023) & (US$ Million)
    Table 87. Asia-Pacific Dementia Drugs Sales Market Share in Value by Region (2018-2023)
    Table 88. Asia-Pacific Dementia Drugs Sales by Region (2024-2029) & (K Units)
    Table 89. Asia-Pacific Dementia Drugs Sales Market Share in Volume by Region (2024-2029)
    Table 90. Asia-Pacific Dementia Drugs Sales by Region (2024-2029) & (US$ Million)
    Table 91. Asia-Pacific Dementia Drugs Sales Market Share in Value by Region (2024-2029)
    Table 92. Latin America Dementia Drugs Sales by Country (2018-2023) & (K Units)
    Table 93. Latin America Dementia Drugs Sales Market Share in Volume by Country (2018-2023)
    Table 94. Latin America Dementia Drugs Sales by Country (2018-2023) & (US$ Million)
    Table 95. Latin America Dementia Drugs Sales Market Share in Value by Country (2018-2023)
    Table 96. Latin America Dementia Drugs Sales by Country (2024-2029) & (K Units)
    Table 97. Latin America Dementia Drugs Sales Market Share in Volume by Country (2024-2029)
    Table 98. Latin America Dementia Drugs Sales by Country (2024-2029) & (US$ Million)
    Table 99. Latin America Dementia Drugs Sales Market Share in Value by Country (2024-2029)
    Table 100. Middle East and Africa Dementia Drugs Sales by Country (2018-2023) & (K Units)
    Table 101. Middle East and Africa Dementia Drugs Sales Market Share in Volume by Country (2018-2023)
    Table 102. Middle East and Africa Dementia Drugs Sales by Country (2018-2023) & (US$ Million)
    Table 103. Middle East and Africa Dementia Drugs Sales Market Share in Value by Country (2018-2023)
    Table 104. Middle East and Africa Dementia Drugs Sales by Country (2024-2029) & (K Units)
    Table 105. Middle East and Africa Dementia Drugs Sales Market Share in Volume by Country (2024-2029)
    Table 106. Middle East and Africa Dementia Drugs Sales by Country (2024-2029) & (US$ Million)
    Table 107. Middle East and Africa Dementia Drugs Sales Market Share in Value by Country (2024-2029)
    Table 108. Eisai, Inc Company Information
    Table 109. Eisai, Inc Introduction and Business Overview
    Table 110. Eisai, Inc Dementia Drugs Sales (K Units), Revenue (Million USD), Price (USD/Unit) and Gross Margin (2018-2023)
    Table 111. Eisai, Inc Dementia Drugs Product
    Table 112. Eisai, Inc Recent Development
    Table 113. Janssen Pharmaceuticals, Inc Company Information
    Table 114. Janssen Pharmaceuticals, Inc Introduction and Business Overview
    Table 115. Janssen Pharmaceuticals, Inc Dementia Drugs Sales (K Units), Revenue (Million USD), Price (USD/Unit) and Gross Margin (2018-2023)
    Table 116. Janssen Pharmaceuticals, Inc Dementia Drugs Product
    Table 117. Janssen Pharmaceuticals, Inc Recent Development
    Table 118. Biogen Pharmaceuticals Company Information
    Table 119. Biogen Pharmaceuticals Introduction and Business Overview
    Table 120. Biogen Pharmaceuticals Dementia Drugs Sales (K Units), Revenue (Million USD), Price (USD/Unit) and Gross Margin (2018-2023)
    Table 121. Biogen Pharmaceuticals Dementia Drugs Product
    Table 122. Biogen Pharmaceuticals Recent Development
    Table 123. Forest Laboratories, Inc Company Information
    Table 124. Forest Laboratories, Inc Introduction and Business Overview
    Table 125. Forest Laboratories, Inc Dementia Drugs Sales (K Units), Revenue (Million USD), Price (USD/Unit) and Gross Margin (2018-2023)
    Table 126. Forest Laboratories, Inc Dementia Drugs Product
    Table 127. Forest Laboratories, Inc Recent Development
    Table 128. Eli Lilly and Company Company Information
    Table 129. Eli Lilly and Company Introduction and Business Overview
    Table 130. Eli Lilly and Company Dementia Drugs Sales (K Units), Revenue (Million USD), Price (USD/Unit) and Gross Margin (2018-2023)
    Table 131. Eli Lilly and Company Dementia Drugs Product
    Table 132. Eli Lilly and Company Recent Development
    Table 133. Novartis AG Company Information
    Table 134. Novartis AG Introduction and Business Overview
    Table 135. Novartis AG Dementia Drugs Sales (K Units), Revenue (Million USD), Price (USD/Unit) and Gross Margin (2018-2023)
    Table 136. Novartis AG Dementia Drugs Product
    Table 137. Novartis AG Recent Development
    Table 138. Sanofi S.A Company Information
    Table 139. Sanofi S.A Introduction and Business Overview
    Table 140. Sanofi S.A Dementia Drugs Sales (K Units), Revenue (Million USD), Price (USD/Unit) and Gross Margin (2018-2023)
    Table 141. Sanofi S.A Dementia Drugs Product
    Table 142. Sanofi S.A Recent Development
    Table 143. AstraZeneca GmbH Company Information
    Table 144. AstraZeneca GmbH Introduction and Business Overview
    Table 145. AstraZeneca GmbH Dementia Drugs Sales (K Units), Revenue (Million USD), Price (USD/Unit) and Gross Margin (2018-2023)
    Table 146. AstraZeneca GmbH Dementia Drugs Product
    Table 147. AstraZeneca GmbH Recent Development
    Table 148. F. Hoffmann-La Roche Company Information
    Table 149. F. Hoffmann-La Roche Introduction and Business Overview
    Table 150. F. Hoffmann-La Roche Dementia Drugs Sales (K Units), Revenue (Million USD), Price (USD/Unit) and Gross Margin (2018-2023)
    Table 151. F. Hoffmann-La Roche Dementia Drugs Product
    Table 152. F. Hoffmann-La Roche Recent Development
    Table 153. Merck & Co., Inc Company Information
    Table 154. Merck & Co., Inc Introduction and Business Overview
    Table 155. Merck & Co., Inc Dementia Drugs Sales (K Units), Revenue (Million USD), Price (USD/Unit) and Gross Margin (2018-2023)
    Table 156. Merck & Co., Inc Dementia Drugs Product
    Table 157. Merck & Co., Inc Recent Development
    Table 158. Valeant Pharmaceutical International Company Information
    Table 159. Valeant Pharmaceutical International Introduction and Business Overview
    Table 160. Valeant Pharmaceutical International Dementia Drugs Sales (K Units), Revenue (Million USD), Price (USD/Unit) and Gross Margin (2018-2023)
    Table 161. Valeant Pharmaceutical International Dementia Drugs Product
    Table 162. Valeant Pharmaceutical International Recent Development
    Table 163. Pfizer Inc Company Information
    Table 164. Pfizer Inc Introduction and Business Overview
    Table 165. Pfizer Inc Dementia Drugs Sales (K Units), Revenue (Million USD), Price (USD/Unit) and Gross Margin (2018-2023)
    Table 166. Pfizer Inc Dementia Drugs Product
    Table 167. Pfizer Inc Recent Development
    Table 168. Teva Pharmaceuticals Industries Company Information
    Table 169. Teva Pharmaceuticals Industries Introduction and Business Overview
    Table 170. Teva Pharmaceuticals Industries Dementia Drugs Sales (K Units), Revenue (Million USD), Price (USD/Unit) and Gross Margin (2018-2023)
    Table 171. Teva Pharmaceuticals Industries Dementia Drugs Product
    Table 172. Teva Pharmaceuticals Industries Recent Development
    Table 173. Aurobindo Pharma Company Information
    Table 174. Aurobindo Pharma Introduction and Business Overview
    Table 175. Aurobindo Pharma Dementia Drugs Sales (K Units), Revenue (Million USD), Price (USD/Unit) and Gross Margin (2018-2023)
    Table 176. Aurobindo Pharma Dementia Drugs Product
    Table 177. Aurobindo Pharma Recent Development
    Table 178. Zydus Cadila Company Information
    Table 179. Zydus Cadila Introduction and Business Overview
    Table 180. Zydus Cadila Dementia Drugs Sales (K Units), Revenue (Million USD), Price (USD/Unit) and Gross Margin (2018-2023)
    Table 181. Zydus Cadila Dementia Drugs Product
    Table 182. Zydus Cadila Recent Development
    Table 183. Johnson and Johnson Company Information
    Table 184. Johnson and Johnson Introduction and Business Overview
    Table 185. Johnson and Johnson Dementia Drugs Sales (K Units), Revenue (Million USD), Price (USD/Unit) and Gross Margin (2018-2023)
    Table 186. Johnson and Johnson Dementia Drugs Product
    Table 187. Johnson and Johnson Recent Development
    Table 188. Apotex inc. Company Information
    Table 189. Apotex inc. Introduction and Business Overview
    Table 190. Apotex inc. Dementia Drugs Sales (K Units), Revenue (Million USD), Price (USD/Unit) and Gross Margin (2018-2023)
    Table 191. Apotex inc. Dementia Drugs Product
    Table 192. Apotex inc. Recent Development
    Table 193. Abbvie Inc Company Information
    Table 194. Abbvie Inc Introduction and Business Overview
    Table 195. Abbvie Inc Dementia Drugs Sales (K Units), Revenue (Million USD), Price (USD/Unit) and Gross Margin (2018-2023)
    Table 196. Abbvie Inc Dementia Drugs Product
    Table 197. Abbvie Inc Recent Development
    Table 198. Key Raw Materials Lists
    Table 199. Raw Materials Key Suppliers Lists
    Table 200. Dementia Drugs Market Trends
    Table 201. Dementia Drugs Market Drivers
    Table 202. Dementia Drugs Market Challenges
    Table 203. Dementia Drugs Market Restraints
    Table 204. Dementia Drugs Distributors List
    Table 205. Dementia Drugs Downstream Customers
    Table 206. Research Programs/Design for This Report
    Table 207. Key Data Information from Secondary Sources
    Table 208. Key Data Information from Primary Sources
List of Figures
    Figure 1. Dementia Drugs Product Picture
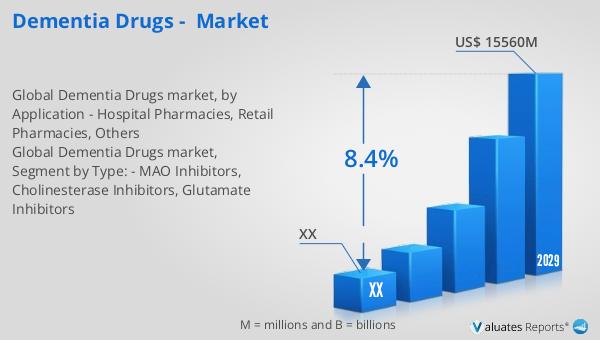
    Figure 2. Global Dementia Drugs Market Size, 2018 VS 2022 VS 2029 (US$ Million)
    Figure 3. Global Dementia Drugs Market Size Status and Outlook (2018-2029) & (US$ Million)
    Figure 4. Global Dementia Drugs Sales Status and Outlook (2018-2029) & (K Units)
    Figure 5. Product Picture of MAO Inhibitors
    Figure 6. Global MAO Inhibitors Sales YoY Growth (2018-2029) & (K Units)
    Figure 7. Product Picture of Cholinesterase Inhibitors
    Figure 8. Global Cholinesterase Inhibitors Sales YoY Growth (2018-2029) & (K Units)
    Figure 9. Product Picture of Glutamate Inhibitors
    Figure 10. Global Glutamate Inhibitors Sales YoY Growth (2018-2029) & (K Units)
    Figure 11. Global Dementia Drugs Sales by Type (2018-2029) & (US$ Million)
    Figure 12. Global Dementia Drugs Sales Market Share by Type in 2022 & 2029
    Figure 13. North America Dementia Drugs Sales Market Share in Volume by Type in 2022
    Figure 14. North America Dementia Drugs Sales Market Share in Value by Type in 2022
    Figure 15. Europe Dementia Drugs Sales Market Share in Volume by Type in 2022
    Figure 16. Europe Dementia Drugs Sales Market Share in Value by Type in 2022
    Figure 17. Asia-Pacific Dementia Drugs Sales Market Share in Volume by Type in 2022
    Figure 18. Asia-Pacific Dementia Drugs Sales Market Share in Value by Type in 2022
    Figure 19. Latin America Dementia Drugs Sales Market Share in Volume by Type in 2022
    Figure 20. Latin America Dementia Drugs Sales Market Share in Value by Type in 2022
    Figure 21. Middle East and Africa Dementia Drugs Sales Market Share in Volume by Type in 2022
    Figure 22. Middle East and Africa Dementia Drugs Sales Market Share in Value by Type in 2022
    Figure 23. The 5 and 10 Largest Manufacturers in the World: Market Share by Dementia Drugs Sales in 2022
    Figure 24. The 5 and 10 Largest Manufacturers in the World: Market Share by Dementia Drugs Revenue in 2022
    Figure 25. Dementia Drugs Market Share by Company Type (Tier 1, Tier 2, and Tier 3): 2018 VS 2022
    Figure 26. Product Picture of Hospital Pharmacies
    Figure 27. Global Hospital Pharmacies Sales YoY Growth (2018-2029) & (K Units)
    Figure 28. Product Picture of Retail Pharmacies
    Figure 29. Global Retail Pharmacies Sales YoY Growth (2018-2029) & (K Units)
    Figure 30. Product Picture of Others
    Figure 31. Global Others Sales YoY Growth (2018-2029) & (K Units)
    Figure 32. Global Dementia Drugs Sales by Application (2018-2029) & (US$ Million)
    Figure 33. Global Dementia Drugs Sales Market Share by Application in 2022 & 2029
    Figure 34. North America Dementia Drugs Sales Market Share in Volume by Application in 2022
    Figure 35. North America Dementia Drugs Sales Market Share in Value by Application in 2022
    Figure 36. Europe Dementia Drugs Sales Market Share in Volume by Application in 2022
    Figure 37. Europe Dementia Drugs Sales Market Share in Value by Application in 2022
    Figure 38. Asia-Pacific Dementia Drugs Sales Market Share in Volume by Application in 2022
    Figure 39. Asia-Pacific Dementia Drugs Sales Market Share in Value by Application in 2022
    Figure 40. Latin America Dementia Drugs Sales Market Share in Volume by Application in 2022
    Figure 41. Latin America Dementia Drugs Sales Market Share in Value by Application in 2022
    Figure 42. Middle East and Africa Dementia Drugs Sales Market Share in Value by Application in 2022
    Figure 43. Key Raw Materials Price
    Figure 44. Dementia Drugs Manufacturing Cost Structure
    Figure 45. Dementia Drugs Industrial Chain Analysis
    Figure 46. Channels of Distribution
    Figure 47. Distributors Profiles
    Figure 48. Bottom-up and Top-down Approaches for This Report
    Figure 49. Data Triangulation
    Figure 50. Key Executives Interviewed
SELECT A FORMAT
Added to Cart
Electronic (PDF)

$3350

This license allows only one user to access the PDF.
Electronic (PDF)

$5025

This license allows 1 - 5 user to access the PDF, license is suitable for small groups of 5 users working together
Electronic (PDF)

$6700

This license allows users/teams in a same Enterprise to use this report, various departments within an enterpise can use this report
Add to Cart
Buy Now (15% Discount)

OUR CUSTOMER

Novocure

SIMILAR REPORTS