List of Tables
Table 1. Viral Vectors and Plasmid DNA Manufacturing Market Trends
Table 2. Viral Vectors and Plasmid DNA Manufacturing Market Drivers & Opportunity
Table 3. Viral Vectors and Plasmid DNA Manufacturing Market Challenges
Table 4. Viral Vectors and Plasmid DNA Manufacturing Market Restraints
Table 5. Global Viral Vectors and Plasmid DNA Manufacturing Revenue by Company (2019-2024) & (US$ Million)
Table 6. Global Viral Vectors and Plasmid DNA Manufacturing Revenue Market Share by Company (2019-2024)
Table 7. Key Companies Viral Vectors and Plasmid DNA Manufacturing Manufacturing Base Distribution and Headquarters
Table 8. Key Companies Viral Vectors and Plasmid DNA Manufacturing Product Type
Table 9. Key Companies Time to Begin Mass Production of Viral Vectors and Plasmid DNA Manufacturing
Table 10. Global Viral Vectors and Plasmid DNA Manufacturing Companies Market Concentration Ratio (CR5 and HHI)
Table 11. Global Top Companies Market Share by Company Type (Tier 1, Tier 2, and Tier 3) & (based on the Revenue in Viral Vectors and Plasmid DNA Manufacturing as of 2023)
Table 12. Mergers & Acquisitions, Expansion Plans
Table 13. Global Viral Vectors and Plasmid DNA Manufacturing Sales Value by Type: 2019 VS 2023 VS 2030 (US$ Million)
Table 14. Global Viral Vectors and Plasmid DNA Manufacturing Sales Value by Type (2019-2024) & (US$ Million)
Table 15. Global Viral Vectors and Plasmid DNA Manufacturing Sales Value by Type (2025-2030) & (US$ Million)
Table 16. Global Viral Vectors and Plasmid DNA Manufacturing Sales Market Share in Value by Type (2019-2024) & (%)
Table 17. Global Viral Vectors and Plasmid DNA Manufacturing Sales Market Share in Value by Type (2025-2030) & (%)
Table 18. Global Viral Vectors and Plasmid DNA Manufacturing Sales Value by Application: 2019 VS 2023 VS 2030 (US$ Million)
Table 19. Global Viral Vectors and Plasmid DNA Manufacturing Sales Value by Application (2019-2024) & (US$ Million)
Table 20. Global Viral Vectors and Plasmid DNA Manufacturing Sales Value by Application (2025-2030) & (US$ Million)
Table 21. Global Viral Vectors and Plasmid DNA Manufacturing Sales Market Share in Value by Application (2019-2024) & (%)
Table 22. Global Viral Vectors and Plasmid DNA Manufacturing Sales Market Share in Value by Application (2025-2030) & (%)
Table 23. Global Viral Vectors and Plasmid DNA Manufacturing Sales Value by Region: 2019 VS 2023 VS 2030 (US$ Million)
Table 24. Global Viral Vectors and Plasmid DNA Manufacturing Sales Value by Region (2019-2024) & (US$ Million)
Table 25. Global Viral Vectors and Plasmid DNA Manufacturing Sales Value by Region (2025-2030) & (US$ Million)
Table 26. Global Viral Vectors and Plasmid DNA Manufacturing Sales Value by Region (2019-2024) & (%)
Table 27. Global Viral Vectors and Plasmid DNA Manufacturing Sales Value by Region (2025-2030) & (%)
Table 28. Key Countries/Regions Viral Vectors and Plasmid DNA Manufacturing Sales Value Growth Trends, (US$ Million): 2019 VS 2023 VS 2030
Table 29. Key Countries/Regions Viral Vectors and Plasmid DNA Manufacturing Sales Value, (2019-2024) & (US$ Million)
Table 30. Key Countries/Regions Viral Vectors and Plasmid DNA Manufacturing Sales Value, (2025-2030) & (US$ Million)
Table 31. BioReliance Basic Information List
Table 32. BioReliance Description and Business Overview
Table 33. BioReliance Viral Vectors and Plasmid DNA Manufacturing Products, Services and Solutions
Table 34. Revenue (US$ Million) in Viral Vectors and Plasmid DNA Manufacturing Business of BioReliance (2019-2024)
Table 35. BioReliance Recent Developments
Table 36. Cobra Biologics Basic Information List
Table 37. Cobra Biologics Description and Business Overview
Table 38. Cobra Biologics Viral Vectors and Plasmid DNA Manufacturing Products, Services and Solutions
Table 39. Revenue (US$ Million) in Viral Vectors and Plasmid DNA Manufacturing Business of Cobra Biologics (2019-2024)
Table 40. Cobra Biologics Recent Developments
Table 41. Oxford BioMedica Basic Information List
Table 42. Oxford BioMedica Description and Business Overview
Table 43. Oxford BioMedica Viral Vectors and Plasmid DNA Manufacturing Products, Services and Solutions
Table 44. Revenue (US$ Million) in Viral Vectors and Plasmid DNA Manufacturing Business of Oxford BioMedica (2019-2024)
Table 45. Oxford BioMedica Recent Developments
Table 46. UniQure Basic Information List
Table 47. UniQure Description and Business Overview
Table 48. UniQure Viral Vectors and Plasmid DNA Manufacturing Products, Services and Solutions
Table 49. Revenue (US$ Million) in Viral Vectors and Plasmid DNA Manufacturing Business of UniQure (2019-2024)
Table 50. UniQure Recent Developments
Table 51. FinVector Basic Information List
Table 52. FinVector Description and Business Overview
Table 53. FinVector Viral Vectors and Plasmid DNA Manufacturing Products, Services and Solutions
Table 54. Revenue (US$ Million) in Viral Vectors and Plasmid DNA Manufacturing Business of FinVector (2019-2024)
Table 55. FinVector Recent Developments
Table 56. MolMed Basic Information List
Table 57. MolMed Description and Business Overview
Table 58. MolMed Viral Vectors and Plasmid DNA Manufacturing Products, Services and Solutions
Table 59. Revenue (US$ Million) in Viral Vectors and Plasmid DNA Manufacturing Business of MolMed (2019-2024)
Table 60. MolMed Recent Developments
Table 61. MassBiologics Basic Information List
Table 62. MassBiologics Description and Business Overview
Table 63. MassBiologics Viral Vectors and Plasmid DNA Manufacturing Products, Services and Solutions
Table 64. Revenue (US$ Million) in Viral Vectors and Plasmid DNA Manufacturing Business of MassBiologics (2019-2024)
Table 65. MassBiologics Recent Developments
Table 66. Richter-Helm Basic Information List
Table 67. Richter-Helm Description and Business Overview
Table 68. Richter-Helm Viral Vectors and Plasmid DNA Manufacturing Products, Services and Solutions
Table 69. Revenue (US$ Million) in Viral Vectors and Plasmid DNA Manufacturing Business of Richter-Helm (2019-2024)
Table 70. Richter-Helm Recent Developments
Table 71. FUJIFILM Diosynth Biotechnologies Basic Information List
Table 72. FUJIFILM Diosynth Biotechnologies Description and Business Overview
Table 73. FUJIFILM Diosynth Biotechnologies Viral Vectors and Plasmid DNA Manufacturing Products, Services and Solutions
Table 74. Revenue (US$ Million) in Viral Vectors and Plasmid DNA Manufacturing Business of FUJIFILM Diosynth Biotechnologies (2019-2024)
Table 75. FUJIFILM Diosynth Biotechnologies Recent Developments
Table 76. Lonza Basic Information List
Table 77. Lonza Description and Business Overview
Table 78. Lonza Viral Vectors and Plasmid DNA Manufacturing Products, Services and Solutions
Table 79. Revenue (US$ Million) in Viral Vectors and Plasmid DNA Manufacturing Business of Lonza (2019-2024)
Table 80. Lonza Recent Developments
Table 81. Aldevron Basic Information List
Table 82. Aldevron Description and Business Overview
Table 83. Aldevron Viral Vectors and Plasmid DNA Manufacturing Products, Services and Solutions
Table 84. Revenue (US$ Million) in Viral Vectors and Plasmid DNA Manufacturing Business of Aldevron (2019-2024)
Table 85. Aldevron Recent Developments
Table 86. Eurogentec Basic Information List
Table 87. Eurogentec Description and Business Overview
Table 88. Eurogentec Viral Vectors and Plasmid DNA Manufacturing Products, Services and Solutions
Table 89. Revenue (US$ Million) in Viral Vectors and Plasmid DNA Manufacturing Business of Eurogentec (2019-2024)
Table 90. Eurogentec Recent Developments
Table 91. Cell and Gene Therapy Catapult Basic Information List
Table 92. Cell and Gene Therapy Catapult Description and Business Overview
Table 93. Cell and Gene Therapy Catapult Viral Vectors and Plasmid DNA Manufacturing Products, Services and Solutions
Table 94. Revenue (US$ Million) in Viral Vectors and Plasmid DNA Manufacturing Business of Cell and Gene Therapy Catapult (2019-2024)
Table 95. Cell and Gene Therapy Catapult Recent Developments
Table 96. Biovian Basic Information List
Table 97. Biovian Description and Business Overview
Table 98. Biovian Viral Vectors and Plasmid DNA Manufacturing Products, Services and Solutions
Table 99. Revenue (US$ Million) in Viral Vectors and Plasmid DNA Manufacturing Business of Biovian (2019-2024)
Table 100. Biovian Recent Developments
Table 101. Thermo Fisher Scientific (Brammer Bio) Basic Information List
Table 102. Thermo Fisher Scientific (Brammer Bio) Description and Business Overview
Table 103. Thermo Fisher Scientific (Brammer Bio) Viral Vectors and Plasmid DNA Manufacturing Products, Services and Solutions
Table 104. Revenue (US$ Million) in Viral Vectors and Plasmid DNA Manufacturing Business of Thermo Fisher Scientific (Brammer Bio) (2019-2024)
Table 105. Thermo Fisher Scientific (Brammer Bio) Recent Developments
Table 106. VGXI Basic Information List
Table 107. VGXI Description and Business Overview
Table 108. VGXI Viral Vectors and Plasmid DNA Manufacturing Products, Services and Solutions
Table 109. Revenue (US$ Million) in Viral Vectors and Plasmid DNA Manufacturing Business of VGXI (2019-2024)
Table 110. VGXI Recent Developments
Table 111. PlasmidFactory Basic Information List
Table 112. PlasmidFactory Description and Business Overview
Table 113. PlasmidFactory Viral Vectors and Plasmid DNA Manufacturing Products, Services and Solutions
Table 114. Revenue (US$ Million) in Viral Vectors and Plasmid DNA Manufacturing Business of PlasmidFactory (2019-2024)
Table 115. PlasmidFactory Recent Developments
Table 116. Key Raw Materials Lists
Table 117. Raw Materials Key Suppliers Lists
Table 118. Viral Vectors and Plasmid DNA Manufacturing Downstream Customers
Table 119. Viral Vectors and Plasmid DNA Manufacturing Distributors List
Table 120. Research Programs/Design for This Report
Table 121. Key Data Information from Secondary Sources
Table 122. Key Data Information from Primary Sources
Table 123. Business Unit and Senior & Team Lead Analysts
List of Figures
Figure 1. Viral Vectors and Plasmid DNA Manufacturing Product Picture
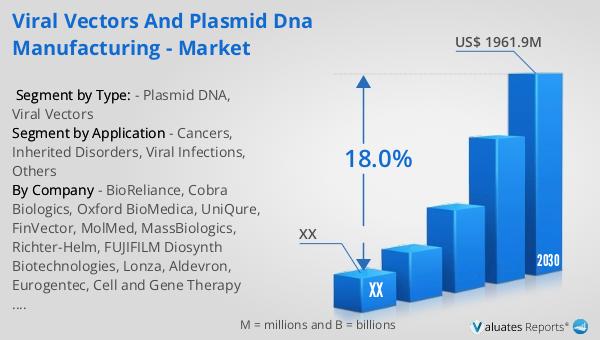
Figure 2. Global Viral Vectors and Plasmid DNA Manufacturing Sales Value, 2019 VS 2023 VS 2030 (US$ Million)
Figure 3. Global Viral Vectors and Plasmid DNA Manufacturing Sales Value (2019-2030) & (US$ Million)
Figure 4. Viral Vectors and Plasmid DNA Manufacturing Report Years Considered
Figure 5. Global Viral Vectors and Plasmid DNA Manufacturing Players Revenue Ranking (2023) & (US$ Million)
Figure 6. The 5 and 10 Largest Manufacturers in the World: Market Share by Viral Vectors and Plasmid DNA Manufacturing Revenue in 2023
Figure 7. Viral Vectors and Plasmid DNA Manufacturing Market Share by Company Type (Tier 1, Tier 2, and Tier 3): 2019 VS 2023
Figure 8. Plasmid DNA Picture
Figure 9. Viral Vectors Picture
Figure 10. Global Viral Vectors and Plasmid DNA Manufacturing Sales Value by Type (2019 VS 2023 VS 2030) & (US$ Million)
Figure 11. Global Viral Vectors and Plasmid DNA Manufacturing Sales Value Market Share by Type, 2023 & 2030
Figure 12. Product Picture of Cancers
Figure 13. Product Picture of Inherited Disorders
Figure 14. Product Picture of Viral Infections
Figure 15. Product Picture of Others
Figure 16. Global Viral Vectors and Plasmid DNA Manufacturing Sales Value by Application (2019 VS 2023 VS 2030) & (US$ Million)
Figure 17. Global Viral Vectors and Plasmid DNA Manufacturing Sales Value Market Share by Application, 2023 & 2030
Figure 18. North America Viral Vectors and Plasmid DNA Manufacturing Sales Value (2019-2030) & (US$ Million)
Figure 19. North America Viral Vectors and Plasmid DNA Manufacturing Sales Value by Country (%), 2023 VS 2030
Figure 20. Europe Viral Vectors and Plasmid DNA Manufacturing Sales Value (2019-2030) & (US$ Million)
Figure 21. Europe Viral Vectors and Plasmid DNA Manufacturing Sales Value by Country (%), 2023 VS 2030
Figure 22. Asia Pacific Viral Vectors and Plasmid DNA Manufacturing Sales Value (2019-2030) & (US$ Million)
Figure 23. Asia Pacific Viral Vectors and Plasmid DNA Manufacturing Sales Value by Country (%), 2023 VS 2030
Figure 24. South America Viral Vectors and Plasmid DNA Manufacturing Sales Value (2019-2030) & (US$ Million)
Figure 25. South America Viral Vectors and Plasmid DNA Manufacturing Sales Value by Country (%), 2023 VS 2030
Figure 26. Middle East & Africa Viral Vectors and Plasmid DNA Manufacturing Sales Value (2019-2030) & (US$ Million)
Figure 27. Middle East & Africa Viral Vectors and Plasmid DNA Manufacturing Sales Value by Country (%), 2023 VS 2030
Figure 28. Key Countries/Regions Viral Vectors and Plasmid DNA Manufacturing Sales Value (%), (2019-2030)
Figure 29. United States Viral Vectors and Plasmid DNA Manufacturing Sales Value, (2019-2030) & (US$ Million)
Figure 30. United States Viral Vectors and Plasmid DNA Manufacturing Sales Value by Type (%), 2023 VS 2030
Figure 31. United States Viral Vectors and Plasmid DNA Manufacturing Sales Value by Application (%), 2023 VS 2030
Figure 32. Europe Viral Vectors and Plasmid DNA Manufacturing Sales Value, (2019-2030) & (US$ Million)
Figure 33. Europe Viral Vectors and Plasmid DNA Manufacturing Sales Value by Type (%), 2023 VS 2030
Figure 34. Europe Viral Vectors and Plasmid DNA Manufacturing Sales Value by Application (%), 2023 VS 2030
Figure 35. China Viral Vectors and Plasmid DNA Manufacturing Sales Value, (2019-2030) & (US$ Million)
Figure 36. China Viral Vectors and Plasmid DNA Manufacturing Sales Value by Type (%), 2023 VS 2030
Figure 37. China Viral Vectors and Plasmid DNA Manufacturing Sales Value by Application (%), 2023 VS 2030
Figure 38. Japan Viral Vectors and Plasmid DNA Manufacturing Sales Value, (2019-2030) & (US$ Million)
Figure 39. Japan Viral Vectors and Plasmid DNA Manufacturing Sales Value by Type (%), 2023 VS 2030
Figure 40. Japan Viral Vectors and Plasmid DNA Manufacturing Sales Value by Application (%), 2023 VS 2030
Figure 41. South Korea Viral Vectors and Plasmid DNA Manufacturing Sales Value, (2019-2030) & (US$ Million)
Figure 42. South Korea Viral Vectors and Plasmid DNA Manufacturing Sales Value by Type (%), 2023 VS 2030
Figure 43. South Korea Viral Vectors and Plasmid DNA Manufacturing Sales Value by Application (%), 2023 VS 2030
Figure 44. Southeast Asia Viral Vectors and Plasmid DNA Manufacturing Sales Value, (2019-2030) & (US$ Million)
Figure 45. Southeast Asia Viral Vectors and Plasmid DNA Manufacturing Sales Value by Type (%), 2023 VS 2030
Figure 46. Southeast Asia Viral Vectors and Plasmid DNA Manufacturing Sales Value by Application (%), 2023 VS 2030
Figure 47. India Viral Vectors and Plasmid DNA Manufacturing Sales Value, (2019-2030) & (US$ Million)
Figure 48. India Viral Vectors and Plasmid DNA Manufacturing Sales Value by Type (%), 2023 VS 2030
Figure 49. India Viral Vectors and Plasmid DNA Manufacturing Sales Value by Application (%), 2023 VS 2030
Figure 50. Viral Vectors and Plasmid DNA Manufacturing Industrial Chain
Figure 51. Viral Vectors and Plasmid DNA Manufacturing Manufacturing Cost Structure
Figure 52. Channels of Distribution (Direct Sales, and Distribution)
Figure 53. Bottom-up and Top-down Approaches for This Report
Figure 54. Data Triangulation