0
U.S. (TOLL FREE)
+1 (315) 215-3225
Automative

0
U.S. (TOLL FREE)
+1 (315) 215-3225
Global Property Management Service Market Insights, Forecast to 2029
Published Date: August 2023
|
Report Code: QYRE-Auto-18E2293
Home | Market Reports | Real Estate| Real Estate Services
Global Property Management Service Market Insights Forecast to 2028
BUY CHAPTERS

Global Property Management Service Market Insights, Forecast to 2029

Code: QYRE-Auto-18E2293
Report
August 2023
Pages:129
QYResearch
Buy Now with 15% Discount
DESCRIPTION
TABLE OF CONTENT
TABLES & FIGURES

Property Management Service Market Size

The global Property Management Service market is projected to grow from US$ 16660 million in 2023 to US$ 26000 million by 2029, at a Compound Annual Growth Rate (CAGR) of 7.7% during the forecast period.

Property Management Service Market

Property Management Service Market

Market Analysis and Insights: Global Property Management Service Market
The US & Canada market for Property Management Service is estimated to increase from $ million in 2023 to reach $ million by 2029, at a CAGR of % during the forecast period of 2023 through 2029.
The China market for Property Management Service is estimated to increase from $ million in 2023 to reach $ million by 2029, at a CAGR of % during the forecast period of 2023 through 2029.
The Europe market for Property Management Service is estimated to increase from $ million in 2023 to reach $ million by 2029, at a CAGR of % during the forecast period of 2023 through 2029.
The global key companies of Property Management Service include Quintessentiallyhome, Mapletree, JLL, Savills Singapore, Abacus Property, Colliers International, Rhodo Property & Estate Management Services, ELDA Management Services, Inc and Florida Property Management Services LLC, etc. in 2022, the global top five players had a share approximately % in terms of revenue.
Report Includes
This report presents an overview of global market for Property Management Service market size. Analyses of the global market trends, with historic market revenue data for 2018 - 2022, estimates for 2023, and projections of CAGR through 2029.
This report researches the key producers of Property Management Service, also provides the revenue of main regions and countries. Highlights of the upcoming market potential for Property Management Service, and key regions/countries of focus to forecast this market into various segments and sub-segments. Country specific data and market value analysis for the U.S., Canada, Mexico, Brazil, China, Japan, South Korea, Southeast Asia, India, Germany, the U.K., Italy, Middle East, Africa, and Other Countries.
This report focuses on the Property Management Service revenue, market share and industry ranking of main companies, data from 2018 to 2023. Identification of the major stakeholders in the global Property Management Service market, and analysis of their competitive landscape and market positioning based on recent developments and segmental revenues. This report will help stakeholders to understand the competitive landscape and gain more insights and position their businesses and market strategies in a better way.
This report analyzes the segments data by type and by application, revenue, and growth rate, from 2018 to 2029. Evaluation and forecast the market size for Property Management Service revenue, projected growth trends, production technology, application and end-user industry.
Descriptive company profiles of the major global players, including Quintessentiallyhome, Mapletree, JLL, Savills Singapore, Abacus Property, Colliers International, Rhodo Property & Estate Management Services, ELDA Management Services, Inc and Florida Property Management Services LLC, etc.

Scope of Property Management Service Market Report

Report Metric Details
Report Name Property Management Service Market
Accounted market size in 2023 US$ 16660 million
Forecasted market size in 2029 US$ 26000 million
CAGR 7.7
Base Year 2023
Forecasted years 2023 - 2029
Segment by Type
  • Clean Management
  • Safety Precaution
  • Public Service
  • Equipment Maintenance And Management
  • Others
Segment by Application
  • Own Property Services
  • Outsourcing Services
By Region
  • North America (United States, Canada)
  • Europe (Germany, France, UK, Italy, Russia) Rest of Europe
  • Nordic Countries
  • Asia-Pacific (China, Japan, South Korea)
  • Southeast Asia (India, Australia)
  • Rest of Asia
  • Latin America (Mexico, Brazil)
  • Rest of Latin America
  • Middle East & Africa (Turkey, Saudi Arabia, UAE, Rest of MEA)
By Company Quintessentiallyhome, Mapletree, JLL, Savills Singapore, Abacus Property, Colliers International, Rhodo Property & Estate Management Services, ELDA Management Services, Inc, Florida Property Management Services LLC, Advantage Property Management Services, Alpha Property Management Services, LLC, Rosen Management Services, Premier Property Management Services, Orchard Block Management Services, Southern Property Management Services, Summit Management Property Management Services, Preferred Property Management Services, Accent Property Management Services, Lee & Associates, Hinch Property Management, Vanke Service, Greentown Service Group, CG Services, Poly Property Development, CCPG, Evergrande Group
Forecast units USD million in value
Report coverage Revenue and volume forecast, company share, competitive landscape, growth factors and trends

Chapter Outline

  • Chapter 1: Introduces the report scope of the report, executive summary of different market segments (product type, application, etc.), including the market size of each market segment, future development potential, and so on. It offers a high-level view of the current state of the market and its likely evolution in the short to mid-term, and long term.
  • Chapter 2: Revenue of Property Management Service in global and regional level. It provides a quantitative analysis of the market size and development potential of each region and its main countries and introduces the market development, future development prospects, market space, and capacity of each country in the world. This section also introduces the market dynamics, latest developments of the market, the driving factors and restrictive factors of the market, the challenges and risks faced by companies in the industry, and the analysis of relevant policies in the industry.
  • Chapter 3: Detailed analysis of Property Management Service companies’ competitive landscape, revenue, market share and industry ranking, latest development plan, merger, and acquisition information, etc.
  • Chapter 4: Provides the analysis of various market segments by type, covering the revenue, and development potential of each market segment, to help readers find the blue ocean market in different market segments.
  • Chapter 5: Provides the analysis of various market segments by application, covering the revenue, and development potential of each market segment, to help readers find the blue ocean market in different downstream markets.
  • Chapter 6: North America by type, by application and by country, revenue for each segment.
  • Chapter 7: Europe by type, by application and by country, revenue for each segment.
  • Chapter 8: China by type and by application revenue for each segment.
  • Chapter 9: Asia (excluding China) by type, by application and by region, revenue for each segment.
  • Chapter 10: Middle East, Africa, and Latin America by type, by application and by country, revenue for each segment.
  • Chapter 11: Provides profiles of key companies, introducing the basic situation of the main companies in the market in detail, including product descriptions and specifications, Property Management Service revenue, gross margin, and recent development, etc.
  • Chapter 12: Analyst's Viewpoints/Conclusions

FAQ for this report

How fast is Property Management Service Market growing?

Ans: The Property Management Service Market witnessing a CAGR of 7.7 during the forecast period 2023-2029.

What is the Property Management Service Market size in 2029?

Ans: The global Property Management Service market is projected to grow from US$ 16660 million in 2023 to US$ 26000 million by 2029, at a Compound Annual Growth Rate (CAGR) of 7.7% during the forecast period.

1 Report Overview
1.1 Study Scope
1.2 Market Analysis by Type
1.2.1 Global Property Management Service Market Size Growth Rate by Type, 2018 VS 2022 VS 2029
1.2.2 Clean Management
1.2.3 Safety Precaution
1.2.4 Public Service
1.2.5 Equipment Maintenance And Management
1.2.6 Others
1.3 Market by Application
1.3.1 Global Property Management Service Market Size Growth Rate by Application, 2018 VS 2022 VS 2029
1.3.2 Own Property Services
1.3.3 Outsourcing Services
1.4 Assumptions and Limitations
1.5 Study Objectives
1.6 Years Considered
2 Global Growth Trends
2.1 Global Property Management Service Market Perspective (2018-2029)
2.2 Global Property Management Service Growth Trends by Region
2.2.1 Property Management Service Market Size by Region: 2018 VS 2022 VS 2029
2.2.2 Property Management Service Historic Market Size by Region (2018-2023)
2.2.3 Property Management Service Forecasted Market Size by Region (2024-2029)
2.3 Property Management Service Market Dynamics
2.3.1 Property Management Service Industry Trends
2.3.2 Property Management Service Market Drivers
2.3.3 Property Management Service Market Challenges
2.3.4 Property Management Service Market Restraints
3 Competition Landscape by Key Players
3.1 Global Revenue Property Management Service by Players
3.1.1 Global Property Management Service Revenue by Players (2018-2023)
3.1.2 Global Property Management Service Revenue Market Share by Players (2018-2023)
3.2 Global Property Management Service Market Share by Company Type (Tier 1, Tier 2, and Tier 3)
3.3 Global Key Players of Property Management Service, Ranking by Revenue, 2021 VS 2022 VS 2023
3.4 Global Property Management Service Market Concentration Ratio
3.4.1 Global Property Management Service Market Concentration Ratio (CR5 and HHI)
3.4.2 Global Top 10 and Top 5 Companies by Property Management Service Revenue in 2022
3.5 Global Key Players of Property Management Service Head office and Area Served
3.6 Global Key Players of Property Management Service, Product and Application
3.7 Global Key Players of Property Management Service, Date of Enter into This Industry
3.8 Mergers & Acquisitions, Expansion Plans
4 Property Management Service Breakdown Data by Type
4.1 Global Property Management Service Historic Market Size by Type (2018-2023)
4.2 Global Property Management Service Forecasted Market Size by Type (2024-2029)
5 Property Management Service Breakdown Data by Application
5.1 Global Property Management Service Historic Market Size by Application (2018-2023)
5.2 Global Property Management Service Forecasted Market Size by Application (2024-2029)
6 North America
6.1 North America Property Management Service Market Size (2018-2029)
6.2 North America Property Management Service Market Size by Type
6.2.1 North America Property Management Service Market Size by Type (2018-2023)
6.2.2 North America Property Management Service Market Size by Type (2024-2029)
6.2.3 North America Property Management Service Market Share by Type (2018-2029)
6.3 North America Property Management Service Market Size by Application
6.3.1 North America Property Management Service Market Size by Application (2018-2023)
6.3.2 North America Property Management Service Market Size by Application (2024-2029)
6.3.3 North America Property Management Service Market Share by Application (2018-2029)
6.4 North America Property Management Service Market Size by Country
6.4.1 North America Property Management Service Market Size by Country: 2018 VS 2022 VS 2029
6.4.2 North America Property Management Service Market Size by Country (2018-2023)
6.4.3 North America Property Management Service Market Size by Country (2024-2029)
6.4.4 U.S.
6.4.5 Canada
7 Europe
7.1 Europe Property Management Service Market Size (2018-2029)
7.2 Europe Property Management Service Market Size by Type
7.2.1 Europe Property Management Service Market Size by Type (2018-2023)
7.2.2 Europe Property Management Service Market Size by Type (2024-2029)
7.2.3 Europe Property Management Service Market Share by Type (2018-2029)
7.3 Europe Property Management Service Market Size by Application
7.3.1 Europe Property Management Service Market Size by Application (2018-2023)
7.3.2 Europe Property Management Service Market Size by Application (2024-2029)
7.3.3 Europe Property Management Service Market Share by Application (2018-2029)
7.4 Europe Property Management Service Market Size by Country
7.4.1 Europe Property Management Service Market Size by Country: 2018 VS 2022 VS 2029
7.4.2 Europe Property Management Service Market Size by Country (2018-2023)
7.4.3 Europe Property Management Service Market Size by Country (2024-2029)
7.4.3 Germany
7.4.4 France
7.4.5 U.K.
7.4.6 Italy
7.4.7 Russia
7.4.8 Nordic Countries
8 China
8.1 China Property Management Service Market Size (2018-2029)
8.2 China Property Management Service Market Size by Type
8.2.1 China Property Management Service Market Size by Type (2018-2023)
8.2.2 China Property Management Service Market Size by Type (2024-2029)
8.2.3 China Property Management Service Market Share by Type (2018-2029)
8.3 China Property Management Service Market Size by Application
8.3.1 China Property Management Service Market Size by Application (2018-2023)
8.3.2 China Property Management Service Market Size by Application (2024-2029)
8.3.3 China Property Management Service Market Share by Application (2018-2029)
9 Asia (excluding China)
9.1 Asia Property Management Service Market Size (2018-2029)
9.2 Asia Property Management Service Market Size by Type
9.2.1 Asia Property Management Service Market Size by Type (2018-2023)
9.2.2 Asia Property Management Service Market Size by Type (2024-2029)
9.2.3 Asia Property Management Service Market Share by Type (2018-2029)
9.3 Asia Property Management Service Market Size by Application
9.3.1 Asia Property Management Service Market Size by Application (2018-2023)
9.3.2 Asia Property Management Service Market Size by Application (2024-2029)
9.3.3 Asia Property Management Service Market Share by Application (2018-2029)
9.4 Asia Property Management Service Market Size by Region
9.4.1 Asia Property Management Service Market Size by Region: 2018 VS 2022 VS 2029
9.4.2 Asia Property Management Service Market Size by Region (2018-2023)
9.4.3 Asia Property Management Service Market Size by Region (2024-2029)
9.4.4 Japan
9.4.5 South Korea
9.4.6 China Taiwan
9.4.7 Southeast Asia
9.4.8 India
9.4.9 Australia
10 Middle East, Africa, and Latin America
10.1 Middle East, Africa, and Latin America Property Management Service Market Size (2018-2029)
10.2 Middle East, Africa, and Latin America Property Management Service Market Size by Type
10.2.1 Middle East, Africa, and Latin America Property Management Service Market Size by Type (2018-2023)
10.2.2 Middle East, Africa, and Latin America Property Management Service Market Size by Type (2024-2029)
10.2.3 Middle East, Africa, and Latin America Property Management Service Market Share by Type (2018-2029)
10.3 Middle East, Africa, and Latin America Property Management Service Market Size by Application
10.3.1 Middle East, Africa, and Latin America Property Management Service Market Size by Application (2018-2023)
10.3.2 Middle East, Africa, and Latin America Property Management Service Market Size by Application (2024-2029)
10.3.3 Middle East, Africa, and Latin America Property Management Service Market Share by Application (2018-2029)
10.4 Middle East, Africa, and Latin America Property Management Service Market Size by Country
10.4.1 Middle East, Africa, and Latin America Property Management Service Market Size by Country: 2018 VS 2022 VS 2029
10.4.2 Middle East, Africa, and Latin America Property Management Service Market Size by Country (2018-2023)
10.4.3 Middle East, Africa, and Latin America Property Management Service Market Size by Country (2024-2029)
10.4.4 Brazil
10.4.5 Mexico
10.4.6 Turkey
10.4.7 Saudi Arabia
10.4.8 Israel
10.4.9 GCC Countries
11 Key Players Profiles
11.1 Quintessentiallyhome
11.1.1 Quintessentiallyhome Company Details
11.1.2 Quintessentiallyhome Business Overview
11.1.3 Quintessentiallyhome Property Management Service Introduction
11.1.4 Quintessentiallyhome Revenue in Property Management Service Business (2018-2023)
11.1.5 Quintessentiallyhome Recent Developments
11.2 Mapletree
11.2.1 Mapletree Company Details
11.2.2 Mapletree Business Overview
11.2.3 Mapletree Property Management Service Introduction
11.2.4 Mapletree Revenue in Property Management Service Business (2018-2023)
11.2.5 Mapletree Recent Developments
11.3 JLL
11.3.1 JLL Company Details
11.3.2 JLL Business Overview
11.3.3 JLL Property Management Service Introduction
11.3.4 JLL Revenue in Property Management Service Business (2018-2023)
11.3.5 JLL Recent Developments
11.4 Savills Singapore
11.4.1 Savills Singapore Company Details
11.4.2 Savills Singapore Business Overview
11.4.3 Savills Singapore Property Management Service Introduction
11.4.4 Savills Singapore Revenue in Property Management Service Business (2018-2023)
11.4.5 Savills Singapore Recent Developments
11.5 Abacus Property
11.5.1 Abacus Property Company Details
11.5.2 Abacus Property Business Overview
11.5.3 Abacus Property Property Management Service Introduction
11.5.4 Abacus Property Revenue in Property Management Service Business (2018-2023)
11.5.5 Abacus Property Recent Developments
11.6 Colliers International
11.6.1 Colliers International Company Details
11.6.2 Colliers International Business Overview
11.6.3 Colliers International Property Management Service Introduction
11.6.4 Colliers International Revenue in Property Management Service Business (2018-2023)
11.6.5 Colliers International Recent Developments
11.7 Rhodo Property & Estate Management Services
11.7.1 Rhodo Property & Estate Management Services Company Details
11.7.2 Rhodo Property & Estate Management Services Business Overview
11.7.3 Rhodo Property & Estate Management Services Property Management Service Introduction
11.7.4 Rhodo Property & Estate Management Services Revenue in Property Management Service Business (2018-2023)
11.7.5 Rhodo Property & Estate Management Services Recent Developments
11.8 ELDA Management Services, Inc
11.8.1 ELDA Management Services, Inc Company Details
11.8.2 ELDA Management Services, Inc Business Overview
11.8.3 ELDA Management Services, Inc Property Management Service Introduction
11.8.4 ELDA Management Services, Inc Revenue in Property Management Service Business (2018-2023)
11.8.5 ELDA Management Services, Inc Recent Developments
11.9 Florida Property Management Services LLC
11.9.1 Florida Property Management Services LLC Company Details
11.9.2 Florida Property Management Services LLC Business Overview
11.9.3 Florida Property Management Services LLC Property Management Service Introduction
11.9.4 Florida Property Management Services LLC Revenue in Property Management Service Business (2018-2023)
11.9.5 Florida Property Management Services LLC Recent Developments
11.10 Advantage Property Management Services
11.10.1 Advantage Property Management Services Company Details
11.10.2 Advantage Property Management Services Business Overview
11.10.3 Advantage Property Management Services Property Management Service Introduction
11.10.4 Advantage Property Management Services Revenue in Property Management Service Business (2018-2023)
11.10.5 Advantage Property Management Services Recent Developments
11.11 Alpha Property Management Services, LLC
11.11.1 Alpha Property Management Services, LLC Company Details
11.11.2 Alpha Property Management Services, LLC Business Overview
11.11.3 Alpha Property Management Services, LLC Property Management Service Introduction
11.11.4 Alpha Property Management Services, LLC Revenue in Property Management Service Business (2018-2023)
11.11.5 Alpha Property Management Services, LLC Recent Developments
11.12 Rosen Management Services
11.12.1 Rosen Management Services Company Details
11.12.2 Rosen Management Services Business Overview
11.12.3 Rosen Management Services Property Management Service Introduction
11.12.4 Rosen Management Services Revenue in Property Management Service Business (2018-2023)
11.12.5 Rosen Management Services Recent Developments
11.13 Premier Property Management Services
11.13.1 Premier Property Management Services Company Details
11.13.2 Premier Property Management Services Business Overview
11.13.3 Premier Property Management Services Property Management Service Introduction
11.13.4 Premier Property Management Services Revenue in Property Management Service Business (2018-2023)
11.13.5 Premier Property Management Services Recent Developments
11.14 Orchard Block Management Services
11.14.1 Orchard Block Management Services Company Details
11.14.2 Orchard Block Management Services Business Overview
11.14.3 Orchard Block Management Services Property Management Service Introduction
11.14.4 Orchard Block Management Services Revenue in Property Management Service Business (2018-2023)
11.14.5 Orchard Block Management Services Recent Developments
11.15 Southern Property Management Services
11.15.1 Southern Property Management Services Company Details
11.15.2 Southern Property Management Services Business Overview
11.15.3 Southern Property Management Services Property Management Service Introduction
11.15.4 Southern Property Management Services Revenue in Property Management Service Business (2018-2023)
11.15.5 Southern Property Management Services Recent Developments
11.16 Summit Management Property Management Services
11.16.1 Summit Management Property Management Services Company Details
11.16.2 Summit Management Property Management Services Business Overview
11.16.3 Summit Management Property Management Services Property Management Service Introduction
11.16.4 Summit Management Property Management Services Revenue in Property Management Service Business (2018-2023)
11.16.5 Summit Management Property Management Services Recent Developments
11.17 Preferred Property Management Services
11.17.1 Preferred Property Management Services Company Details
11.17.2 Preferred Property Management Services Business Overview
11.17.3 Preferred Property Management Services Property Management Service Introduction
11.17.4 Preferred Property Management Services Revenue in Property Management Service Business (2018-2023)
11.17.5 Preferred Property Management Services Recent Developments
11.18 Accent Property Management Services
11.18.1 Accent Property Management Services Company Details
11.18.2 Accent Property Management Services Business Overview
11.18.3 Accent Property Management Services Property Management Service Introduction
11.18.4 Accent Property Management Services Revenue in Property Management Service Business (2018-2023)
11.18.5 Accent Property Management Services Recent Developments
11.19 Lee & Associates
11.19.1 Lee & Associates Company Details
11.19.2 Lee & Associates Business Overview
11.19.3 Lee & Associates Property Management Service Introduction
11.19.4 Lee & Associates Revenue in Property Management Service Business (2018-2023)
11.19.5 Lee & Associates Recent Developments
11.20 Hinch Property Management
11.20.1 Hinch Property Management Company Details
11.20.2 Hinch Property Management Business Overview
11.20.3 Hinch Property Management Property Management Service Introduction
11.20.4 Hinch Property Management Revenue in Property Management Service Business (2018-2023)
11.20.5 Hinch Property Management Recent Developments
11.21 Vanke Service
11.21.1 Vanke Service Company Details
11.21.2 Vanke Service Business Overview
11.21.3 Vanke Service Property Management Service Introduction
11.21.4 Vanke Service Revenue in Property Management Service Business (2018-2023)
11.21.5 Vanke Service Recent Developments
11.22 Greentown Service Group
11.22.1 Greentown Service Group Company Details
11.22.2 Greentown Service Group Business Overview
11.22.3 Greentown Service Group Property Management Service Introduction
11.22.4 Greentown Service Group Revenue in Property Management Service Business (2018-2023)
11.22.5 Greentown Service Group Recent Developments
11.23 CG Services
11.23.1 CG Services Company Details
11.23.2 CG Services Business Overview
11.23.3 CG Services Property Management Service Introduction
11.23.4 CG Services Revenue in Property Management Service Business (2018-2023)
11.23.5 CG Services Recent Developments
11.24 Poly Property Development
11.24.1 Poly Property Development Company Details
11.24.2 Poly Property Development Business Overview
11.24.3 Poly Property Development Property Management Service Introduction
11.24.4 Poly Property Development Revenue in Property Management Service Business (2018-2023)
11.24.5 Poly Property Development Recent Developments
11.25 CCPG
11.25.1 CCPG Company Details
11.25.2 CCPG Business Overview
11.25.3 CCPG Property Management Service Introduction
11.25.4 CCPG Revenue in Property Management Service Business (2018-2023)
11.25.5 CCPG Recent Developments
11.26 Evergrande Group
11.26.1 Evergrande Group Company Details
11.26.2 Evergrande Group Business Overview
11.26.3 Evergrande Group Property Management Service Introduction
11.26.4 Evergrande Group Revenue in Property Management Service Business (2018-2023)
11.26.5 Evergrande Group Recent Developments
12 Analyst's Viewpoints/Conclusions
13 Appendix
13.1 Research Methodology
13.1.1 Methodology/Research Approach
13.1.2 Data Source
13.2 Disclaimer
13.3 Author Details
List of Tables
    Table 1. Global Property Management Service Market Size Growth Rate by Type (US$ Million), 2018 VS 2022 VS 2029
    Table 2. Key Players of Clean Management
    Table 3. Key Players of Safety Precaution
    Table 4. Key Players of Public Service
    Table 5. Key Players of Equipment Maintenance And Management
    Table 6. Key Players of Others
    Table 7. Global Property Management Service Market Size Growth Rate by Application (US$ Million), 2018 VS 2022 VS 2029
    Table 8. Global Property Management Service Market Size Growth Rate (CAGR) by Region (US$ Million): 2018 VS 2022 VS 2029
    Table 9. Global Property Management Service Market Size by Region (2018-2023) & (US$ Million)
    Table 10. Global Property Management Service Market Share by Region (2018-2023)
    Table 11. Global Property Management Service Forecasted Market Size by Region (2024-2029) & (US$ Million)
    Table 12. Global Property Management Service Market Share by Region (2024-2029)
    Table 13. Property Management Service Market Trends
    Table 14. Property Management Service Market Drivers
    Table 15. Property Management Service Market Challenges
    Table 16. Property Management Service Market Restraints
    Table 17. Global Property Management Service Revenue by Players (2018-2023) & (US$ Million)
    Table 18. Global Property Management Service Revenue Share by Players (2018-2023)
    Table 19. Global Top Property Management Service by Company Type (Tier 1, Tier 2, and Tier 3) & (based on the Revenue in Property Management Service as of 2022)
    Table 20. Global Property Management Service Industry Ranking 2021 VS 2022 VS 2023
    Table 21. Global 5 Largest Players Market Share by Property Management Service Revenue (CR5 and HHI) & (2018-2023)
    Table 22. Global Key Players of Property Management Service, Headquarters and Area Served
    Table 23. Global Key Players of Property Management Service, Product and Application
    Table 24. Global Key Players of Property Management Service, Product and Application
    Table 25. Mergers & Acquisitions, Expansion Plans
    Table 26. Global Property Management Service Market Size by Type (2018-2023) & (US$ Million)
    Table 27. Global Property Management Service Revenue Market Share by Type (2018-2023)
    Table 28. Global Property Management Service Forecasted Market Size by Type (2024-2029) & (US$ Million)
    Table 29. Global Property Management Service Revenue Market Share by Type (2024-2029)
    Table 30. Global Property Management Service Market Size by Application (2018-2023) & (US$ Million)
    Table 31. Global Property Management Service Revenue Share by Application (2018-2023)
    Table 32. Global Property Management Service Forecasted Market Size by Application (2024-2029) & (US$ Million)
    Table 33. Global Property Management Service Revenue Share by Application (2024-2029)
    Table 34. North America Property Management Service Market Size by Type (2018-2023) & (US$ Million)
    Table 35. North America Property Management Service Market Size by Type (2024-2029) & (US$ Million)
    Table 36. North America Property Management Service Market Size by Application (2018-2023) & (US$ Million)
    Table 37. North America Property Management Service Market Size by Application (2024-2029) & (US$ Million)
    Table 38. North America Property Management Service Growth Rate (CAGR) by Country (US$ Million): 2018 VS 2022 VS 2029
    Table 39. North America Property Management Service Market Size by Country (2018-2023) & (US$ Million)
    Table 40. North America Property Management Service Market Size by Country (2024-2029) & (US$ Million)
    Table 41. Europe Property Management Service Market Size by Type (2018-2023) & (US$ Million)
    Table 42. Europe Property Management Service Market Size by Type (2024-2029) & (US$ Million)
    Table 43. Europe Property Management Service Market Size by Application (2018-2023) & (US$ Million)
    Table 44. Europe Property Management Service Market Size by Application (2024-2029) & (US$ Million)
    Table 45. Europe Property Management Service Growth Rate (CAGR) by Country (US$ Million): 2018 VS 2022 VS 2029
    Table 46. Europe Property Management Service Market Size by Country (2018-2023) & (US$ Million)
    Table 47. Europe Property Management Service Market Size by Country (2024-2029) & (US$ Million)
    Table 48. China Property Management Service Market Size by Type (2018-2023) & (US$ Million)
    Table 49. China Property Management Service Market Size by Type (2024-2029) & (US$ Million)
    Table 50. China Property Management Service Market Size by Application (2018-2023) & (US$ Million)
    Table 51. China Property Management Service Market Size by Application (2024-2029) & (US$ Million)
    Table 52. Asia Property Management Service Market Size by Type (2018-2023) & (US$ Million)
    Table 53. Asia Property Management Service Market Size by Type (2024-2029) & (US$ Million)
    Table 54. Asia Property Management Service Market Size by Application (2018-2023) & (US$ Million)
    Table 55. Asia Property Management Service Market Size by Application (2024-2029) & (US$ Million)
    Table 56. Asia Property Management Service Growth Rate (CAGR) by Region (US$ Million): 2018 VS 2022 VS 2029
    Table 57. Asia Property Management Service Market Size by Region (2018-2023) & (US$ Million)
    Table 58. Asia Property Management Service Market Size by Region (2024-2029) & (US$ Million)
    Table 59. Middle East, Africa, and Latin America Property Management Service Market Size by Type (2018-2023) & (US$ Million)
    Table 60. Middle East, Africa, and Latin America Property Management Service Market Size by Type (2024-2029) & (US$ Million)
    Table 61. Middle East, Africa, and Latin America Property Management Service Market Size by Application (2018-2023) & (US$ Million)
    Table 62. Middle East, Africa, and Latin America Property Management Service Market Size by Application (2024-2029) & (US$ Million)
    Table 63. Middle East, Africa, and Latin America Property Management Service Growth Rate (CAGR) by Country (US$ Million): 2018 VS 2022 VS 2029
    Table 64. Middle East, Africa, and Latin America Property Management Service Market Size by Country (2018-2023) & (US$ Million)
    Table 65. Middle East, Africa, and Latin America Property Management Service Market Size by Country (2024-2029) & (US$ Million)
    Table 66. Quintessentiallyhome Company Details
    Table 67. Quintessentiallyhome Business Overview
    Table 68. Quintessentiallyhome Property Management Service Product
    Table 69. Quintessentiallyhome Revenue in Property Management Service Business (2018-2023) & (US$ Million)
    Table 70. Quintessentiallyhome Recent Developments
    Table 71. Mapletree Company Details
    Table 72. Mapletree Business Overview
    Table 73. Mapletree Property Management Service Product
    Table 74. Mapletree Revenue in Property Management Service Business (2018-2023) & (US$ Million)
    Table 75. Mapletree Recent Developments
    Table 76. JLL Company Details
    Table 77. JLL Business Overview
    Table 78. JLL Property Management Service Product
    Table 79. JLL Revenue in Property Management Service Business (2018-2023) & (US$ Million)
    Table 80. JLL Recent Developments
    Table 81. Savills Singapore Company Details
    Table 82. Savills Singapore Business Overview
    Table 83. Savills Singapore Property Management Service Product
    Table 84. Savills Singapore Revenue in Property Management Service Business (2018-2023) & (US$ Million)
    Table 85. Savills Singapore Recent Developments
    Table 86. Abacus Property Company Details
    Table 87. Abacus Property Business Overview
    Table 88. Abacus Property Property Management Service Product
    Table 89. Abacus Property Revenue in Property Management Service Business (2018-2023) & (US$ Million)
    Table 90. Abacus Property Recent Developments
    Table 91. Colliers International Company Details
    Table 92. Colliers International Business Overview
    Table 93. Colliers International Property Management Service Product
    Table 94. Colliers International Revenue in Property Management Service Business (2018-2023) & (US$ Million)
    Table 95. Colliers International Recent Developments
    Table 96. Rhodo Property & Estate Management Services Company Details
    Table 97. Rhodo Property & Estate Management Services Business Overview
    Table 98. Rhodo Property & Estate Management Services Property Management Service Product
    Table 99. Rhodo Property & Estate Management Services Revenue in Property Management Service Business (2018-2023) & (US$ Million)
    Table 100. Rhodo Property & Estate Management Services Recent Developments
    Table 101. ELDA Management Services, Inc Company Details
    Table 102. ELDA Management Services, Inc Business Overview
    Table 103. ELDA Management Services, Inc Property Management Service Product
    Table 104. ELDA Management Services, Inc Revenue in Property Management Service Business (2018-2023) & (US$ Million)
    Table 105. ELDA Management Services, Inc Recent Developments
    Table 106. Florida Property Management Services LLC Company Details
    Table 107. Florida Property Management Services LLC Business Overview
    Table 108. Florida Property Management Services LLC Property Management Service Product
    Table 109. Florida Property Management Services LLC Revenue in Property Management Service Business (2018-2023) & (US$ Million)
    Table 110. Florida Property Management Services LLC Recent Developments
    Table 111. Advantage Property Management Services Company Details
    Table 112. Advantage Property Management Services Business Overview
    Table 113. Advantage Property Management Services Property Management Service Product
    Table 114. Advantage Property Management Services Revenue in Property Management Service Business (2018-2023) & (US$ Million)
    Table 115. Advantage Property Management Services Recent Developments
    Table 116. Alpha Property Management Services, LLC Company Details
    Table 117. Alpha Property Management Services, LLC Business Overview
    Table 118. Alpha Property Management Services, LLC Property Management Service Product
    Table 119. Alpha Property Management Services, LLC Revenue in Property Management Service Business (2018-2023) & (US$ Million)
    Table 120. Alpha Property Management Services, LLC Recent Developments
    Table 121. Rosen Management Services Company Details
    Table 122. Rosen Management Services Business Overview
    Table 123. Rosen Management Services Property Management Service Product
    Table 124. Rosen Management Services Revenue in Property Management Service Business (2018-2023) & (US$ Million)
    Table 125. Rosen Management Services Recent Developments
    Table 126. Premier Property Management Services Company Details
    Table 127. Premier Property Management Services Business Overview
    Table 128. Premier Property Management Services Property Management Service Product
    Table 129. Premier Property Management Services Revenue in Property Management Service Business (2018-2023) & (US$ Million)
    Table 130. Premier Property Management Services Recent Developments
    Table 131. Orchard Block Management Services Company Details
    Table 132. Orchard Block Management Services Business Overview
    Table 133. Orchard Block Management Services Property Management Service Product
    Table 134. Orchard Block Management Services Revenue in Property Management Service Business (2018-2023) & (US$ Million)
    Table 135. Orchard Block Management Services Recent Developments
    Table 136. Southern Property Management Services Company Details
    Table 137. Southern Property Management Services Business Overview
    Table 138. Southern Property Management Services Property Management Service Product
    Table 139. Southern Property Management Services Revenue in Property Management Service Business (2018-2023) & (US$ Million)
    Table 140. Southern Property Management Services Recent Developments
    Table 141. Summit Management Property Management Services Company Details
    Table 142. Summit Management Property Management Services Business Overview
    Table 143. Summit Management Property Management Services Property Management Service Product
    Table 144. Summit Management Property Management Services Revenue in Property Management Service Business (2018-2023) & (US$ Million)
    Table 145. Summit Management Property Management Services Recent Developments
    Table 146. Preferred Property Management Services Company Details
    Table 147. Preferred Property Management Services Business Overview
    Table 148. Preferred Property Management Services Property Management Service Product
    Table 149. Preferred Property Management Services Revenue in Property Management Service Business (2018-2023) & (US$ Million)
    Table 150. Preferred Property Management Services Recent Developments
    Table 151. Accent Property Management Services Company Details
    Table 152. Accent Property Management Services Business Overview
    Table 153. Accent Property Management Services Property Management Service Product
    Table 154. Accent Property Management Services Revenue in Property Management Service Business (2018-2023) & (US$ Million)
    Table 155. Accent Property Management Services Recent Developments
    Table 156. Lee & Associates Company Details
    Table 157. Lee & Associates Business Overview
    Table 158. Lee & Associates Property Management Service Product
    Table 159. Lee & Associates Revenue in Property Management Service Business (2018-2023) & (US$ Million)
    Table 160. Lee & Associates Recent Developments
    Table 161. Hinch Property Management Company Details
    Table 162. Hinch Property Management Business Overview
    Table 163. Hinch Property Management Property Management Service Product
    Table 164. Hinch Property Management Revenue in Property Management Service Business (2018-2023) & (US$ Million)
    Table 165. Hinch Property Management Recent Developments
    Table 166. Vanke Service Company Details
    Table 167. Vanke Service Business Overview
    Table 168. Vanke Service Property Management Service Product
    Table 169. Vanke Service Revenue in Property Management Service Business (2018-2023) & (US$ Million)
    Table 170. Vanke Service Recent Developments
    Table 171. Greentown Service Group Company Details
    Table 172. Greentown Service Group Business Overview
    Table 173. Greentown Service Group Property Management Service Product
    Table 174. Greentown Service Group Revenue in Property Management Service Business (2018-2023) & (US$ Million)
    Table 175. Greentown Service Group Recent Developments
    Table 176. CG Services Company Details
    Table 177. CG Services Business Overview
    Table 178. CG Services Property Management Service Product
    Table 179. CG Services Revenue in Property Management Service Business (2018-2023) & (US$ Million)
    Table 180. CG Services Recent Developments
    Table 181. Poly Property Development Company Details
    Table 182. Poly Property Development Business Overview
    Table 183. Poly Property Development Property Management Service Product
    Table 184. Poly Property Development Revenue in Property Management Service Business (2018-2023) & (US$ Million)
    Table 185. Poly Property Development Recent Developments
    Table 186. CCPG Company Details
    Table 187. CCPG Business Overview
    Table 188. CCPG Property Management Service Product
    Table 189. CCPG Revenue in Property Management Service Business (2018-2023) & (US$ Million)
    Table 190. CCPG Recent Developments
    Table 191. Evergrande Group Company Details
    Table 192. Evergrande Group Business Overview
    Table 193. Evergrande Group Property Management Service Product
    Table 194. Evergrande Group Revenue in Property Management Service Business (2018-2023) & (US$ Million)
    Table 195. Evergrande Group Recent Developments
    Table 196. Research Programs/Design for This Report
    Table 197. Key Data Information from Secondary Sources
    Table 198. Key Data Information from Primary Sources
List of Figures
    Figure 1. Global Property Management Service Market Size Growth Rate by Type, 2018 VS 2022 VS 2029 (US$ Million)
    Figure 2. Global Property Management Service Market Share by Type: 2022 VS 2029
    Figure 3. Clean Management Features
    Figure 4. Safety Precaution Features
    Figure 5. Public Service Features
    Figure 6. Equipment Maintenance And Management Features
    Figure 7. Others Features
    Figure 8. Global Property Management Service Market Size Growth Rate by Application, 2018 VS 2022 VS 2029 (US$ Million)
    Figure 9. Global Property Management Service Market Share by Application: 2022 VS 2029
    Figure 10. Own Property Services Case Studies
    Figure 11. Outsourcing Services Case Studies
    Figure 12. Property Management Service Report Years Considered
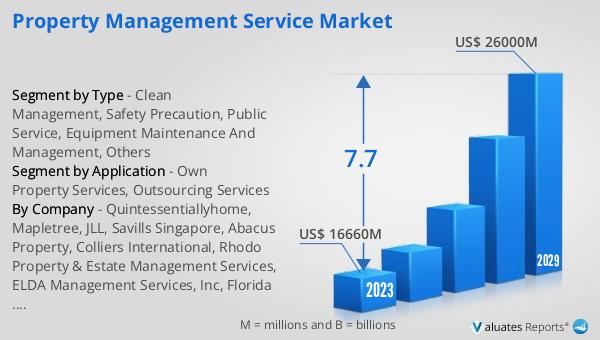
    Figure 13. Global Property Management Service Market Size (US$ Million), Year-over-Year: 2018-2029
    Figure 14. Global Property Management Service Market Size, (US$ Million), 2018 VS 2022 VS 2029
    Figure 15. Global Property Management Service Market Share by Region: 2022 VS 2029
    Figure 16. Global Property Management Service Market Share by Players in 2022
    Figure 17. Global Top Property Management Service Players by Company Type (Tier 1, Tier 2, and Tier 3) & (based on the Revenue in Property Management Service as of 2022)
    Figure 18. The Top 10 and 5 Players Market Share by Property Management Service Revenue in 2022
    Figure 19. North America Property Management Service Market Size YoY Growth (2018-2029) & (US$ Million)
    Figure 20. North America Property Management Service Market Share by Type (2018-2029)
    Figure 21. North America Property Management Service Market Share by Application (2018-2029)
    Figure 22. North America Property Management Service Market Share by Country (2018-2029)
    Figure 23. United States Property Management Service Market Size YoY Growth (2018-2029) & (US$ Million)
    Figure 24. Canada Property Management Service Market Size YoY Growth (2018-2029) & (US$ Million)
    Figure 25. Europe Property Management Service Market Size YoY (2018-2029) & (US$ Million)
    Figure 26. Europe Property Management Service Market Share by Type (2018-2029)
    Figure 27. Europe Property Management Service Market Share by Application (2018-2029)
    Figure 28. Europe Property Management Service Market Share by Country (2018-2029)
    Figure 29. Germany Property Management Service Market Size YoY Growth (2018-2029) & (US$ Million)
    Figure 30. France Property Management Service Market Size YoY Growth (2018-2029) & (US$ Million)
    Figure 31. U.K. Property Management Service Market Size YoY Growth (2018-2029) & (US$ Million)
    Figure 32. Italy Property Management Service Market Size YoY Growth (2018-2029) & (US$ Million)
    Figure 33. Russia Property Management Service Market Size YoY Growth (2018-2029) & (US$ Million)
    Figure 34. Nordic Countries Property Management Service Market Size YoY Growth (2018-2029) & (US$ Million)
    Figure 35. China Property Management Service Market Size YoY (2018-2029) & (US$ Million)
    Figure 36. China Property Management Service Market Share by Type (2018-2029)
    Figure 37. China Property Management Service Market Share by Application (2018-2029)
    Figure 38. Asia Property Management Service Market Size YoY (2018-2029) & (US$ Million)
    Figure 39. Asia Property Management Service Market Share by Type (2018-2029)
    Figure 40. Asia Property Management Service Market Share by Application (2018-2029)
    Figure 41. Asia Property Management Service Market Share by Region (2018-2029)
    Figure 42. Japan Property Management Service Market Size YoY Growth (2018-2029) & (US$ Million)
    Figure 43. South Korea Property Management Service Market Size YoY Growth (2018-2029) & (US$ Million)
    Figure 44. China Taiwan Property Management Service Market Size YoY Growth (2018-2029) & (US$ Million)
    Figure 45. Southeast Asia Property Management Service Market Size YoY Growth (2018-2029) & (US$ Million)
    Figure 46. India Property Management Service Market Size YoY Growth (2018-2029) & (US$ Million)
    Figure 47. Australia Property Management Service Market Size YoY Growth (2018-2029) & (US$ Million)
    Figure 48. Middle East, Africa, and Latin America Property Management Service Market Size YoY (2018-2029) & (US$ Million)
    Figure 49. Middle East, Africa, and Latin America Property Management Service Market Share by Type (2018-2029)
    Figure 50. Middle East, Africa, and Latin America Property Management Service Market Share by Application (2018-2029)
    Figure 51. Middle East, Africa, and Latin America Property Management Service Market Share by Country (2018-2029)
    Figure 52. Brazil Property Management Service Market Size YoY Growth (2018-2029) & (US$ Million)
    Figure 53. Mexico Property Management Service Market Size YoY Growth (2018-2029) & (US$ Million)
    Figure 54. Turkey Property Management Service Market Size YoY Growth (2018-2029) & (US$ Million)
    Figure 55. Saudi Arabia Property Management Service Market Size YoY Growth (2018-2029) & (US$ Million)
    Figure 56. Israel Property Management Service Market Size YoY Growth (2018-2029) & (US$ Million)
    Figure 57. GCC Countries Property Management Service Market Size YoY Growth (2018-2029) & (US$ Million)
    Figure 58. Quintessentiallyhome Revenue Growth Rate in Property Management Service Business (2018-2023)
    Figure 59. Mapletree Revenue Growth Rate in Property Management Service Business (2018-2023)
    Figure 60. JLL Revenue Growth Rate in Property Management Service Business (2018-2023)
    Figure 61. Savills Singapore Revenue Growth Rate in Property Management Service Business (2018-2023)
    Figure 62. Abacus Property Revenue Growth Rate in Property Management Service Business (2018-2023)
    Figure 63. Colliers International Revenue Growth Rate in Property Management Service Business (2018-2023)
    Figure 64. Rhodo Property & Estate Management Services Revenue Growth Rate in Property Management Service Business (2018-2023)
    Figure 65. ELDA Management Services, Inc Revenue Growth Rate in Property Management Service Business (2018-2023)
    Figure 66. Florida Property Management Services LLC Revenue Growth Rate in Property Management Service Business (2018-2023)
    Figure 67. Advantage Property Management Services Revenue Growth Rate in Property Management Service Business (2018-2023)
    Figure 68. Alpha Property Management Services, LLC Revenue Growth Rate in Property Management Service Business (2018-2023)
    Figure 69. Rosen Management Services Revenue Growth Rate in Property Management Service Business (2018-2023)
    Figure 70. Premier Property Management Services Revenue Growth Rate in Property Management Service Business (2018-2023)
    Figure 71. Orchard Block Management Services Revenue Growth Rate in Property Management Service Business (2018-2023)
    Figure 72. Southern Property Management Services Revenue Growth Rate in Property Management Service Business (2018-2023)
    Figure 73. Summit Management Property Management Services Revenue Growth Rate in Property Management Service Business (2018-2023)
    Figure 74. Preferred Property Management Services Revenue Growth Rate in Property Management Service Business (2018-2023)
    Figure 75. Accent Property Management Services Revenue Growth Rate in Property Management Service Business (2018-2023)
    Figure 76. Lee & Associates Revenue Growth Rate in Property Management Service Business (2018-2023)
    Figure 77. Hinch Property Management Revenue Growth Rate in Property Management Service Business (2018-2023)
    Figure 78. Vanke Service Revenue Growth Rate in Property Management Service Business (2018-2023)
    Figure 79. Greentown Service Group Revenue Growth Rate in Property Management Service Business (2018-2023)
    Figure 80. CG Services Revenue Growth Rate in Property Management Service Business (2018-2023)
    Figure 81. Poly Property Development Revenue Growth Rate in Property Management Service Business (2018-2023)
    Figure 82. CCPG Revenue Growth Rate in Property Management Service Business (2018-2023)
    Figure 83. Evergrande Group Revenue Growth Rate in Property Management Service Business (2018-2023)
    Figure 84. Bottom-up and Top-down Approaches for This Report
    Figure 85. Data Triangulation
    Figure 86. Key Executives Interviewed
SELECT A FORMAT
Added to Cart
Electronic (PDF)

$4900

This license allows only one user to access the PDF.
Electronic (PDF)

$7350

This license allows 1 - 5 user to access the PDF, license is suitable for small groups of 5 users working together
Electronic (PDF)

$9800

This license allows users/teams in a same Enterprise to use this report, various departments within an enterpise can use this report
Add to Cart
Buy Now (15% Discount)

OUR CUSTOMER

Accenture

SIMILAR REPORTS


RELATED REPORTS

Global Real Estate Brokerage Services Market Research Report 2024

120 Pages
Type: Report
Code: QYRE-Auto-8K10408
Mon Mar 25 00:00:00 UTC 2024

Add to Cart

Global Real Estate Management Services Market Research Report 2024

120 Pages
Type: Report
Code: QYRE-Auto-22N16574
Wed Mar 20 00:00:00 UTC 2024

Add to Cart

Global Residential Property Management Services Market Research Report 2024

120 Pages
Type: Report
Code: QYRE-Auto-13X16810
Wed Mar 20 00:00:00 UTC 2024

Add to Cart

Global Vacation Rental Property Management Software Market Research Report 2024

120 Pages
Type: Report
Code: QYRE-Auto-35D16580
Fri Mar 15 00:00:00 UTC 2024

Add to Cart