0
U.S. (TOLL FREE)
+1 (315) 215-3225
Automative

0
U.S. (TOLL FREE)
+1 (315) 215-3225
Global Bioplastics & Biopolymers Market Research Report 2023
Published Date: March 2023
|
Report Code: QYRE-Auto-12I9189
Home | Market Reports | Business & Industrial| Chemicals Industry
Global Bioplastics and Biopolymers Market Outlook 2022
BUY CHAPTERS

Global Bioplastics & Biopolymers Market Research Report 2023

Code: QYRE-Auto-12I9189
Report
March 2023
Pages:95
QYResearch
Buy Now with 15% Discount
DESCRIPTION
TABLE OF CONTENT
TABLES & FIGURES

Global Bioplastics & Biopolymers Market

The global Bioplastics & Biopolymers market is projected to grow from US$ 3857 million in 2023 to US$ 4713.9 million by 2029, at a Compound Annual Growth Rate (CAGR) of 3.4% during the forecast period. The influence of COVID-19 and the Russia-Ukraine War were considered while estimating market sizes.

Bioplastics and biopolymers are widely used in the packaging sector. This factor is expected to drive the growth of the Bioplastics and biopolymers market. 

The biopolymers are utilized in packaging, emulsions, drug delivery, packaging for the medical and healthcare industries, and personal care products. Applications for bioplastics include packaging, dishes, cutlery, pots, bowls, and straws. One of the key factors boosting demand for the bioplastics and biopolymers market is the growing desire to replace and lessen reliance on fossil fuels.

Bioplastics & Biopolymers market

Bioplastics & Biopolymers Market Trends

The bioplastics and biopolymers market is primarily driven by rising consumer demand for plastic convenience and high-quality food products, rising urban population, which increases food adoption, rising processed or stored food and packaged food consumption for consumers globally, rising disposable income of eatable food, and multifunctionality of packaging. Packaging is one of the end-use sectors that dominate the bioplastics and biopolymers industry. Due to environmental concerns, bioplastics, especially biodegradable bioplastics, are gaining popularity as alternatives to traditional plastics. Bottles, films, clamshell cartons, garbage collection bags, carrying bags, mulch films, and food service containers are all becoming more and more often made of bioplastics. 

Additionally, the bioplastics and biopolymers market is anticipated to expand as a result of increased packaged food demand, advancements in bioplastic packaging, growing consumer health concerns, and expanding spending power among owners of packaged food businesses on durable goods for the food industry. During the projection period, producers in the global market should benefit from shifting consumer lifestyles in developed nations, expanding pharmaceutical, food, and other industries, and the advent of new product developments in bioplastics and biopolymers goods.

The main factor fueling the growth of the bioplastics and biopolymers market is the growing usage of biopolymers in the automotive and construction industries. The market for bioplastics and biopolymers is anticipated to grow as a result of rising customer preference for environmentally friendly plastic products, increased waste management regulations in Europe, and government emphasis on green procurement policies and regulations. However, the market for bioplastics and biopolymers is constrained by high prices for bioplastics compared to conventional plastics and concerns with performance, while fluctuating oil prices and limited regulations for bioplastics in poorer nations may hinder market expansion.

Bioplastics & Biopolymers Market Share Analysis

Due to the widespread use of bioplastics across a variety of end-user sectors, North America currently dominates the bioplastics and biopolymers market and will maintain this dominance over the projection period. However, due to the region's governments' rigorous rules regarding the use of limited resources, Asia-Pacific will still be predicted to have the highest CAGR for this time period.

NatureWorks, Braskem, Arkema, Novamont, BASF and Kingfa are the main players in this industry. Among them, NatureWorks is the leader in the global market, and it accounted for 13% of the global revenue market share in 2019.

Production areas include North America, Europe, China and Japan. In 2019, the global Bioplastics and Biopolymers market is led by Europe with nearly 47%. USA is the second-largest region-wise market with about 24%.

Bioplastics & Biopolymers market by region

In terms of product types, there are Starch Blends, PLA, Bio-PE, PBAT and Bio-PET. Starch Blends is the largest segment with a market share of nearly 28%, followed by PLA with 19%.

Bioplastics & Biopolymers market by product

Bioplastics and biopolymers can be used in packing industry, consumer products, agriculture & horticulture, automotive industry. The packing industry accounted for about 56 per cent of the global market in 2019.

Bioplastics & Biopolymers market by Application

Key Segmentations

By Company

  • BASF
  • Braskem
  • Metabolix
  • Meredian
  • Plantic
  • Corbion
  • Novamont
  • Natureworks
  • Biome Technologies
  • Indorama Ventures Public Company Limited

Segment by Materials

  • Bio-PE
  • Starch Blends
  • PLA
  • Bio-PET
  • Biodegradable Polyesters
  • Regenerated Cellulose
  • Polylactic Acid
  • Poly Hydroxyalkonoates

Segment by Application

  • Packaging
  • Agriculture
  • Automotive
  • Consumer Products

Production by Region

  • North America
  • Europe
  • China
  • Japan

Consumption by Region

  • North America
  • U.S.
  • Canada
  • Europe
  • Germany
  • France
  • U.K.
  • Italy
  • Russia
  • Asia-Pacific
  • China
  • Japan
  • South Korea
  • Taiwan
  • Southeast Asia
  • India
  • Latin America
  • Mexico
  • Brazil

Core Chapters

  • Chapter 1: Introduces the report scope of the report, executive summary of different market segments (by region, by materials, by application, etc), including the market size of each market segment, future development potential, and so on. It offers a high-level view of the current state of the market and its likely evolution in the short to mid-term, and long term.
  • Chapter 2: Detailed analysis of Bioplastics & Biopolymers manufacturers competitive landscape, price, production and value market share, latest development plan, merger, and acquisition information, etc.
  • Chapter 3: Production/output, value of Bioplastics & Biopolymers by region/country. It provides a quantitative analysis of the market size and development potential of each region in the next six years.
  • Chapter 4: Consumption of Bioplastics & Biopolymers in regional level and country level. It provides a quantitative analysis of the market size and development potential of each region and its main countries and introduces the market development, future development prospects, market space, and production of each country in the world.
  • Chapter 5: Provides the analysis of various market segments by materials, covering the market size and development potential of each market segment, to help readers find the blue ocean market in different market segments.
  • Chapter 6: Provides the analysis of various market segments by application, covering the market size and development potential of each market segment, to help readers find the blue ocean market in different downstream markets.
  • Chapter 7: Provides profiles of key players, introducing the basic situation of the key companies in the market in detail, including product production/output, value, price, gross margin, product introduction, recent development, etc.
  • Chapter 8: Analysis of industrial chain, including the upstream and downstream of the industry.
  • Chapter 9: Introduces the market dynamics, latest developments of the market, the driving factors and restrictive factors of the market, the challenges and risks faced by manufacturers in the industry, and the analysis of relevant policies in the industry.
  • Chapter 10: The main points and conclusions of the report.

Scope of Global Bioplastics & Biopolymers Market Report

Report Metric Details
Report Name Bioplastics & Biopolymers Market
The market size in 2022 USD 3857 Million
The revenue forecast in 2029 USD 4713.9 Million
Growth Rate Compound Annual Growth Rate (CAGR) of 3.4% from 2023 to 2029
Market size available for years 2023-2029
Forecast units Value (USD)
Segments covered By Material, Product, End Use & Regions
Report coverage Revenue & volume forecast, company share, competitive landscape, growth factors, and trends
Geographic regions covered North America, Europe, Asia Pacific, Latin America, Middle East & Africa

Frequently Asked Questions About This Report

1. What will be the global Bioplastics & Biopolymers market size from 2023 to 2029?

Ans. The global Bioplastics & Biopolymers market was valued at US$ 3857 million in 2022 and is anticipated to reach US$ 4713.9 million by 2029, witnessing a CAGR of 3.4% during the forecast period 2023-2029.

2. What are the upcoming trends in Bioplastics & Biopolymers Industry?

Ans. The rising use of bioplastics in the packaging industry, increase in waste management regulations in Europe, favorable government policies, focus on bio-based content rather than biodegradability, and rising concern for human health are driving the demand for bioplastics & biopolymers.

3. What is the growth rate of the global Bioplastics & Biopolymers market during the forecast period?

Ans. The global Bioplastics & Biopolymers market witnessing a CAGR of 3.4% during the forecast period 2023-2029. 

4. Who are the top companies hold the market share in Bioplastics & Biopolymers?

Ans. NatureWorks, Braskem, Arkema, Novamont, BASF and Kingfa are the main players in this industry. Among them, NatureWorks is the leader in the global market, and it accounted for 13% of the global revenue market share in 2019.

1 Bioplastics & Biopolymers Market Overview
1.1 Product Definition
1.2 Bioplastics & Biopolymers Segment by Materials
1.2.1 Global Bioplastics & Biopolymers Market Value Growth Rate Analysis by Materials 2022 VS 2029
1.2.2 Bio-PE
1.2.3 Starch Blends
1.2.4 PLA
1.2.5 Bio-PET
1.2.6 Biodegradable Polyesters
1.2.7 Regenerated Cellulose
1.2.8 Polylactic Acid
1.2.9 Poly Hydroxyalkonoates
1.3 Bioplastics & Biopolymers Segment by Application
1.3.1 Global Bioplastics & Biopolymers Market Value Growth Rate Analysis by Application: 2022 VS 2029
1.3.2 Packaging
1.3.3 Agriculture
1.3.4 Automotive
1.3.5 Consumer Products
1.4 Global Market Growth Prospects
1.4.1 Global Bioplastics & Biopolymers Production Value Estimates and Forecasts (2018-2029)
1.4.2 Global Bioplastics & Biopolymers Production Capacity Estimates and Forecasts (2018-2029)
1.4.3 Global Bioplastics & Biopolymers Production Estimates and Forecasts (2018-2029)
1.4.4 Global Bioplastics & Biopolymers Market Average Price Estimates and Forecasts (2018-2029)
1.5 Assumptions and Limitations
2 Market Competition by Manufacturers
2.1 Global Bioplastics & Biopolymers Production Market Share by Manufacturers (2018-2023)
2.2 Global Bioplastics & Biopolymers Production Value Market Share by Manufacturers (2018-2023)
2.3 Global Key Players of Bioplastics & Biopolymers, Industry Ranking, 2021 VS 2022 VS 2023
2.4 Global Bioplastics & Biopolymers Market Share by Company Type (Tier 1, Tier 2 and Tier 3)
2.5 Global Bioplastics & Biopolymers Average Price by Manufacturers (2018-2023)
2.6 Global Key Manufacturers of Bioplastics & Biopolymers, Manufacturing Base Distribution and Headquarters
2.7 Global Key Manufacturers of Bioplastics & Biopolymers, Product Offered and Application
2.8 Global Key Manufacturers of Bioplastics & Biopolymers, Date of Enter into This Industry
2.9 Bioplastics & Biopolymers Market Competitive Situation and Trends
2.9.1 Bioplastics & Biopolymers Market Concentration Rate
2.9.2 Global 5 and 10 Largest Bioplastics & Biopolymers Players Market Share by Revenue
2.10 Mergers & Acquisitions, Expansion
3 Bioplastics & Biopolymers Production by Region
3.1 Global Bioplastics & Biopolymers Production Value Estimates and Forecasts by Region: 2018 VS 2022 VS 2029
3.2 Global Bioplastics & Biopolymers Production Value by Region (2018-2029)
3.2.1 Global Bioplastics & Biopolymers Production Value Market Share by Region (2018-2023)
3.2.2 Global Forecasted Production Value of Bioplastics & Biopolymers by Region (2024-2029)
3.3 Global Bioplastics & Biopolymers Production Estimates and Forecasts by Region: 2018 VS 2022 VS 2029
3.4 Global Bioplastics & Biopolymers Production by Region (2018-2029)
3.4.1 Global Bioplastics & Biopolymers Production Market Share by Region (2018-2023)
3.4.2 Global Forecasted Production of Bioplastics & Biopolymers by Region (2024-2029)
3.5 Global Bioplastics & Biopolymers Market Price Analysis by Region (2018-2023)
3.6 Global Bioplastics & Biopolymers Production and Value, Year-over-Year Growth
3.6.1 North America Bioplastics & Biopolymers Production Value Estimates and Forecasts (2018-2029)
3.6.2 Europe Bioplastics & Biopolymers Production Value Estimates and Forecasts (2018-2029)
3.6.3 China Bioplastics & Biopolymers Production Value Estimates and Forecasts (2018-2029)
3.6.4 Japan Bioplastics & Biopolymers Production Value Estimates and Forecasts (2018-2029)
4 Bioplastics & Biopolymers Consumption by Region
4.1 Global Bioplastics & Biopolymers Consumption Estimates and Forecasts by Region: 2018 VS 2022 VS 2029
4.2 Global Bioplastics & Biopolymers Consumption by Region (2018-2029)
4.2.1 Global Bioplastics & Biopolymers Consumption by Region (2018-2023)
4.2.2 Global Bioplastics & Biopolymers Forecasted Consumption by Region (2024-2029)
4.3 North America
4.3.1 North America Bioplastics & Biopolymers Consumption Growth Rate by Country: 2018 VS 2022 VS 2029
4.3.2 North America Bioplastics & Biopolymers Consumption by Country (2018-2029)
4.3.3 U.S.
4.3.4 Canada
4.4 Europe
4.4.1 Europe Bioplastics & Biopolymers Consumption Growth Rate by Country: 2018 VS 2022 VS 2029
4.4.2 Europe Bioplastics & Biopolymers Consumption by Country (2018-2029)
4.4.3 Germany
4.4.4 France
4.4.5 U.K.
4.4.6 Italy
4.4.7 Russia
4.5 Asia Pacific
4.5.1 Asia Pacific Bioplastics & Biopolymers Consumption Growth Rate by Region: 2018 VS 2022 VS 2029
4.5.2 Asia Pacific Bioplastics & Biopolymers Consumption by Region (2018-2029)
4.5.3 China
4.5.4 Japan
4.5.5 South Korea
4.5.6 China Taiwan
4.5.7 Southeast Asia
4.5.8 India
4.6 Latin America, Middle East & Africa
4.6.1 Latin America, Middle East & Africa Bioplastics & Biopolymers Consumption Growth Rate by Country: 2018 VS 2022 VS 2029
4.6.2 Latin America, Middle East & Africa Bioplastics & Biopolymers Consumption by Country (2018-2029)
4.6.3 Mexico
4.6.4 Brazil
4.6.5 Turkey
5 Segment by Materials
5.1 Global Bioplastics & Biopolymers Production by Materials (2018-2029)
5.1.1 Global Bioplastics & Biopolymers Production by Materials (2018-2023)
5.1.2 Global Bioplastics & Biopolymers Production by Materials (2024-2029)
5.1.3 Global Bioplastics & Biopolymers Production Market Share by Materials (2018-2029)
5.2 Global Bioplastics & Biopolymers Production Value by Materials (2018-2029)
5.2.1 Global Bioplastics & Biopolymers Production Value by Materials (2018-2023)
5.2.2 Global Bioplastics & Biopolymers Production Value by Materials (2024-2029)
5.2.3 Global Bioplastics & Biopolymers Production Value Market Share by Materials (2018-2029)
5.3 Global Bioplastics & Biopolymers Price by Materials (2018-2029)
6 Segment by Application
6.1 Global Bioplastics & Biopolymers Production by Application (2018-2029)
6.1.1 Global Bioplastics & Biopolymers Production by Application (2018-2023)
6.1.2 Global Bioplastics & Biopolymers Production by Application (2024-2029)
6.1.3 Global Bioplastics & Biopolymers Production Market Share by Application (2018-2029)
6.2 Global Bioplastics & Biopolymers Production Value by Application (2018-2029)
6.2.1 Global Bioplastics & Biopolymers Production Value by Application (2018-2023)
6.2.2 Global Bioplastics & Biopolymers Production Value by Application (2024-2029)
6.2.3 Global Bioplastics & Biopolymers Production Value Market Share by Application (2018-2029)
6.3 Global Bioplastics & Biopolymers Price by Application (2018-2029)
7 Key Companies Profiled
7.1 BASF
7.1.1 BASF Bioplastics & Biopolymers Corporation Information
7.1.2 BASF Bioplastics & Biopolymers Product Portfolio
7.1.3 BASF Bioplastics & Biopolymers Production, Value, Price and Gross Margin (2018-2023)
7.1.4 BASF Main Business and Markets Served
7.1.5 BASF Recent Developments/Updates
7.2 Braskem
7.2.1 Braskem Bioplastics & Biopolymers Corporation Information
7.2.2 Braskem Bioplastics & Biopolymers Product Portfolio
7.2.3 Braskem Bioplastics & Biopolymers Production, Value, Price and Gross Margin (2018-2023)
7.2.4 Braskem Main Business and Markets Served
7.2.5 Braskem Recent Developments/Updates
7.3 Metabolix
7.3.1 Metabolix Bioplastics & Biopolymers Corporation Information
7.3.2 Metabolix Bioplastics & Biopolymers Product Portfolio
7.3.3 Metabolix Bioplastics & Biopolymers Production, Value, Price and Gross Margin (2018-2023)
7.3.4 Metabolix Main Business and Markets Served
7.3.5 Metabolix Recent Developments/Updates
7.4 Meredian
7.4.1 Meredian Bioplastics & Biopolymers Corporation Information
7.4.2 Meredian Bioplastics & Biopolymers Product Portfolio
7.4.3 Meredian Bioplastics & Biopolymers Production, Value, Price and Gross Margin (2018-2023)
7.4.4 Meredian Main Business and Markets Served
7.4.5 Meredian Recent Developments/Updates
7.5 Plantic
7.5.1 Plantic Bioplastics & Biopolymers Corporation Information
7.5.2 Plantic Bioplastics & Biopolymers Product Portfolio
7.5.3 Plantic Bioplastics & Biopolymers Production, Value, Price and Gross Margin (2018-2023)
7.5.4 Plantic Main Business and Markets Served
7.5.5 Plantic Recent Developments/Updates
7.6 Corbion
7.6.1 Corbion Bioplastics & Biopolymers Corporation Information
7.6.2 Corbion Bioplastics & Biopolymers Product Portfolio
7.6.3 Corbion Bioplastics & Biopolymers Production, Value, Price and Gross Margin (2018-2023)
7.6.4 Corbion Main Business and Markets Served
7.6.5 Corbion Recent Developments/Updates
7.7 Novamont
7.7.1 Novamont Bioplastics & Biopolymers Corporation Information
7.7.2 Novamont Bioplastics & Biopolymers Product Portfolio
7.7.3 Novamont Bioplastics & Biopolymers Production, Value, Price and Gross Margin (2018-2023)
7.7.4 Novamont Main Business and Markets Served
7.7.5 Novamont Recent Developments/Updates
7.8 Natureworks
7.8.1 Natureworks Bioplastics & Biopolymers Corporation Information
7.8.2 Natureworks Bioplastics & Biopolymers Product Portfolio
7.8.3 Natureworks Bioplastics & Biopolymers Production, Value, Price and Gross Margin (2018-2023)
7.8.4 Natureworks Main Business and Markets Served
7.7.5 Natureworks Recent Developments/Updates
7.9 Biome Technologies
7.9.1 Biome Technologies Bioplastics & Biopolymers Corporation Information
7.9.2 Biome Technologies Bioplastics & Biopolymers Product Portfolio
7.9.3 Biome Technologies Bioplastics & Biopolymers Production, Value, Price and Gross Margin (2018-2023)
7.9.4 Biome Technologies Main Business and Markets Served
7.9.5 Biome Technologies Recent Developments/Updates
7.10 Indorama Ventures Public Company Limited
7.10.1 Indorama Ventures Public Company Limited Bioplastics & Biopolymers Corporation Information
7.10.2 Indorama Ventures Public Company Limited Bioplastics & Biopolymers Product Portfolio
7.10.3 Indorama Ventures Public Company Limited Bioplastics & Biopolymers Production, Value, Price and Gross Margin (2018-2023)
7.10.4 Indorama Ventures Public Company Limited Main Business and Markets Served
7.10.5 Indorama Ventures Public Company Limited Recent Developments/Updates
8 Industry Chain and Sales Channels Analysis
8.1 Bioplastics & Biopolymers Industry Chain Analysis
8.2 Bioplastics & Biopolymers Key Raw Materials
8.2.1 Key Raw Materials
8.2.2 Raw Materials Key Suppliers
8.3 Bioplastics & Biopolymers Production Mode & Process
8.4 Bioplastics & Biopolymers Sales and Marketing
8.4.1 Bioplastics & Biopolymers Sales Channels
8.4.2 Bioplastics & Biopolymers Distributors
8.5 Bioplastics & Biopolymers Customers
9 Bioplastics & Biopolymers Market Dynamics
9.1 Bioplastics & Biopolymers Industry Trends
9.2 Bioplastics & Biopolymers Market Drivers
9.3 Bioplastics & Biopolymers Market Challenges
9.4 Bioplastics & Biopolymers Market Restraints
10 Research Finding and Conclusion
11 Methodology and Data Source
11.1 Methodology/Research Approach
11.1.1 Research Programs/Design
11.1.2 Market Size Estimation
11.1.3 Market Breakdown and Data Triangulation
11.2 Data Source
11.2.1 Secondary Sources
11.2.2 Primary Sources
11.3 Author List
11.4 Disclaimer
List of Tables
    Table 1. Global Bioplastics & Biopolymers Market Value by Materials, (US$ Million) & (2022 VS 2029)
    Table 2. Global Bioplastics & Biopolymers Market Value by Application, (US$ Million) & (2022 VS 2029)
    Table 3. Global Bioplastics & Biopolymers Production Capacity (MT) by Manufacturers in 2022
    Table 4. Global Bioplastics & Biopolymers Production by Manufacturers (2018-2023) & (MT)
    Table 5. Global Bioplastics & Biopolymers Production Market Share by Manufacturers (2018-2023)
    Table 6. Global Bioplastics & Biopolymers Production Value by Manufacturers (2018-2023) & (US$ Million)
    Table 7. Global Bioplastics & Biopolymers Production Value Share by Manufacturers (2018-2023)
    Table 8. Global Bioplastics & Biopolymers Industry Ranking 2021 VS 2022 VS 2023
    Table 9. Company Type (Tier 1, Tier 2 and Tier 3) & (based on the Revenue in Bioplastics & Biopolymers as of 2022)
    Table 10. Global Market Bioplastics & Biopolymers Average Price by Manufacturers (USD/MT) & (2018-2023)
    Table 11. Manufacturers Bioplastics & Biopolymers Production Sites and Area Served
    Table 12. Manufacturers Bioplastics & Biopolymers Product Types
    Table 13. Global Bioplastics & Biopolymers Manufacturers Market Concentration Ratio (CR5 and HHI)
    Table 14. Mergers & Acquisitions, Expansion
    Table 15. Global Bioplastics & Biopolymers Production Value by Region: 2018 VS 2022 VS 2029 (US$ Million)
    Table 16. Global Bioplastics & Biopolymers Production Value (US$ Million) by Region (2018-2023)
    Table 17. Global Bioplastics & Biopolymers Production Value Market Share by Region (2018-2023)
    Table 18. Global Bioplastics & Biopolymers Production Value (US$ Million) Forecast by Region (2024-2029)
    Table 19. Global Bioplastics & Biopolymers Production Value Market Share Forecast by Region (2024-2029)
    Table 20. Global Bioplastics & Biopolymers Production Comparison by Region: 2018 VS 2022 VS 2029 (MT)
    Table 21. Global Bioplastics & Biopolymers Production (MT) by Region (2018-2023)
    Table 22. Global Bioplastics & Biopolymers Production Market Share by Region (2018-2023)
    Table 23. Global Bioplastics & Biopolymers Production (MT) Forecast by Region (2024-2029)
    Table 24. Global Bioplastics & Biopolymers Production Market Share Forecast by Region (2024-2029)
    Table 25. Global Bioplastics & Biopolymers Market Average Price (USD/MT) by Region (2018-2023)
    Table 26. Global Bioplastics & Biopolymers Market Average Price (USD/MT) by Region (2024-2029)
    Table 27. Global Bioplastics & Biopolymers Consumption Growth Rate by Region: 2018 VS 2022 VS 2029 (MT)
    Table 28. Global Bioplastics & Biopolymers Consumption by Region (2018-2023) & (MT)
    Table 29. Global Bioplastics & Biopolymers Consumption Market Share by Region (2018-2023)
    Table 30. Global Bioplastics & Biopolymers Forecasted Consumption by Region (2024-2029) & (MT)
    Table 31. Global Bioplastics & Biopolymers Forecasted Consumption Market Share by Region (2018-2023)
    Table 32. North America Bioplastics & Biopolymers Consumption Growth Rate by Country: 2018 VS 2022 VS 2029 (MT)
    Table 33. North America Bioplastics & Biopolymers Consumption by Country (2018-2023) & (MT)
    Table 34. North America Bioplastics & Biopolymers Consumption by Country (2024-2029) & (MT)
    Table 35. Europe Bioplastics & Biopolymers Consumption Growth Rate by Country: 2018 VS 2022 VS 2029 (MT)
    Table 36. Europe Bioplastics & Biopolymers Consumption by Country (2018-2023) & (MT)
    Table 37. Europe Bioplastics & Biopolymers Consumption by Country (2024-2029) & (MT)
    Table 38. Asia Pacific Bioplastics & Biopolymers Consumption Growth Rate by Region: 2018 VS 2022 VS 2029 (MT)
    Table 39. Asia Pacific Bioplastics & Biopolymers Consumption by Region (2018-2023) & (MT)
    Table 40. Asia Pacific Bioplastics & Biopolymers Consumption by Region (2024-2029) & (MT)
    Table 41. Latin America, Middle East & Africa Bioplastics & Biopolymers Consumption Growth Rate by Country: 2018 VS 2022 VS 2029 (MT)
    Table 42. Latin America, Middle East & Africa Bioplastics & Biopolymers Consumption by Country (2018-2023) & (MT)
    Table 43. Latin America, Middle East & Africa Bioplastics & Biopolymers Consumption by Country (2024-2029) & (MT)
    Table 44. Global Bioplastics & Biopolymers Production (MT) by Materials (2018-2023)
    Table 45. Global Bioplastics & Biopolymers Production (MT) by Materials (2024-2029)
    Table 46. Global Bioplastics & Biopolymers Production Market Share by Materials (2018-2023)
    Table 47. Global Bioplastics & Biopolymers Production Market Share by Materials (2024-2029)
    Table 48. Global Bioplastics & Biopolymers Production Value (US$ Million) by Materials (2018-2023)
    Table 49. Global Bioplastics & Biopolymers Production Value (US$ Million) by Materials (2024-2029)
    Table 50. Global Bioplastics & Biopolymers Production Value Share by Materials (2018-2023)
    Table 51. Global Bioplastics & Biopolymers Production Value Share by Materials (2024-2029)
    Table 52. Global Bioplastics & Biopolymers Price (USD/MT) by Materials (2018-2023)
    Table 53. Global Bioplastics & Biopolymers Price (USD/MT) by Materials (2024-2029)
    Table 54. Global Bioplastics & Biopolymers Production (MT) by Application (2018-2023)
    Table 55. Global Bioplastics & Biopolymers Production (MT) by Application (2024-2029)
    Table 56. Global Bioplastics & Biopolymers Production Market Share by Application (2018-2023)
    Table 57. Global Bioplastics & Biopolymers Production Market Share by Application (2024-2029)
    Table 58. Global Bioplastics & Biopolymers Production Value (US$ Million) by Application (2018-2023)
    Table 59. Global Bioplastics & Biopolymers Production Value (US$ Million) by Application (2024-2029)
    Table 60. Global Bioplastics & Biopolymers Production Value Share by Application (2018-2023)
    Table 61. Global Bioplastics & Biopolymers Production Value Share by Application (2024-2029)
    Table 62. Global Bioplastics & Biopolymers Price (USD/MT) by Application (2018-2023)
    Table 63. Global Bioplastics & Biopolymers Price (USD/MT) by Application (2024-2029)
    Table 64. BASF Bioplastics & Biopolymers Corporation Information
    Table 65. BASF Specification and Application
    Table 66. BASF Bioplastics & Biopolymers Production (MT), Value (US$ Million), Price (USD/MT) and Gross Margin (2018-2023)
    Table 67. BASF Main Business and Markets Served
    Table 68. BASF Recent Developments/Updates
    Table 69. Braskem Bioplastics & Biopolymers Corporation Information
    Table 70. Braskem Specification and Application
    Table 71. Braskem Bioplastics & Biopolymers Production (MT), Value (US$ Million), Price (USD/MT) and Gross Margin (2018-2023)
    Table 72. Braskem Main Business and Markets Served
    Table 73. Braskem Recent Developments/Updates
    Table 74. Metabolix Bioplastics & Biopolymers Corporation Information
    Table 75. Metabolix Specification and Application
    Table 76. Metabolix Bioplastics & Biopolymers Production (MT), Value (US$ Million), Price (USD/MT) and Gross Margin (2018-2023)
    Table 77. Metabolix Main Business and Markets Served
    Table 78. Metabolix Recent Developments/Updates
    Table 79. Meredian Bioplastics & Biopolymers Corporation Information
    Table 80. Meredian Specification and Application
    Table 81. Meredian Bioplastics & Biopolymers Production (MT), Value (US$ Million), Price (USD/MT) and Gross Margin (2018-2023)
    Table 82. Meredian Main Business and Markets Served
    Table 83. Meredian Recent Developments/Updates
    Table 84. Plantic Bioplastics & Biopolymers Corporation Information
    Table 85. Plantic Specification and Application
    Table 86. Plantic Bioplastics & Biopolymers Production (MT), Value (US$ Million), Price (USD/MT) and Gross Margin (2018-2023)
    Table 87. Plantic Main Business and Markets Served
    Table 88. Plantic Recent Developments/Updates
    Table 89. Corbion Bioplastics & Biopolymers Corporation Information
    Table 90. Corbion Specification and Application
    Table 91. Corbion Bioplastics & Biopolymers Production (MT), Value (US$ Million), Price (USD/MT) and Gross Margin (2018-2023)
    Table 92. Corbion Main Business and Markets Served
    Table 93. Corbion Recent Developments/Updates
    Table 94. Novamont Bioplastics & Biopolymers Corporation Information
    Table 95. Novamont Specification and Application
    Table 96. Novamont Bioplastics & Biopolymers Production (MT), Value (US$ Million), Price (USD/MT) and Gross Margin (2018-2023)
    Table 97. Novamont Main Business and Markets Served
    Table 98. Novamont Recent Developments/Updates
    Table 99. Natureworks Bioplastics & Biopolymers Corporation Information
    Table 100. Natureworks Specification and Application
    Table 101. Natureworks Bioplastics & Biopolymers Production (MT), Value (US$ Million), Price (USD/MT) and Gross Margin (2018-2023)
    Table 102. Natureworks Main Business and Markets Served
    Table 103. Natureworks Recent Developments/Updates
    Table 104. Biome Technologies Bioplastics & Biopolymers Corporation Information
    Table 105. Biome Technologies Specification and Application
    Table 106. Biome Technologies Bioplastics & Biopolymers Production (MT), Value (US$ Million), Price (USD/MT) and Gross Margin (2018-2023)
    Table 107. Biome Technologies Main Business and Markets Served
    Table 108. Biome Technologies Recent Developments/Updates
    Table 109. Indorama Ventures Public Company Limited Bioplastics & Biopolymers Corporation Information
    Table 110. Indorama Ventures Public Company Limited Specification and Application
    Table 111. Indorama Ventures Public Company Limited Bioplastics & Biopolymers Production (MT), Value (US$ Million), Price (USD/MT) and Gross Margin (2018-2023)
    Table 112. Indorama Ventures Public Company Limited Main Business and Markets Served
    Table 113. Indorama Ventures Public Company Limited Recent Developments/Updates
    Table 114. Key Raw Materials Lists
    Table 115. Raw Materials Key Suppliers Lists
    Table 116. Bioplastics & Biopolymers Distributors List
    Table 117. Bioplastics & Biopolymers Customers List
    Table 118. Bioplastics & Biopolymers Market Trends
    Table 119. Bioplastics & Biopolymers Market Drivers
    Table 120. Bioplastics & Biopolymers Market Challenges
    Table 121. Bioplastics & Biopolymers Market Restraints
    Table 122. Research Programs/Design for This Report
    Table 123. Key Data Information from Secondary Sources
    Table 124. Key Data Information from Primary Sources
List of Figures
    Figure 1. Product Picture of Bioplastics & Biopolymers
    Figure 2. Global Bioplastics & Biopolymers Market Value by Materials, (US$ Million) & (2022 VS 2029)
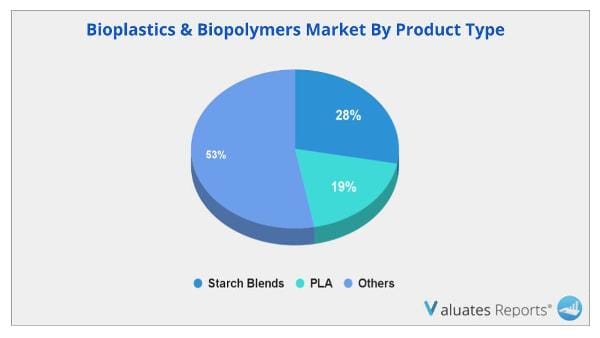
    Figure 3. Global Bioplastics & Biopolymers Market Share by Materials: 2022 VS 2029
    Figure 4. Bio-PE Product Picture
    Figure 5. Starch Blends Product Picture
    Figure 6. PLA Product Picture
    Figure 7. Bio-PET Product Picture
    Figure 8. Biodegradable Polyesters Product Picture
    Figure 9. Regenerated Cellulose Product Picture
    Figure 10. Polylactic Acid Product Picture
    Figure 11. Poly Hydroxyalkonoates Product Picture
    Figure 12. Global Bioplastics & Biopolymers Market Value by Application, (US$ Million) & (2022 VS 2029)
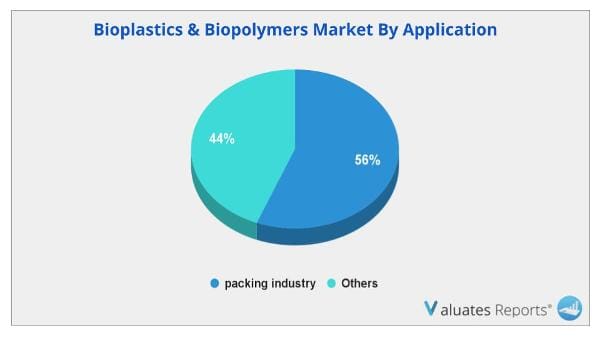
    Figure 13. Global Bioplastics & Biopolymers Market Share by Application: 2022 VS 2029
    Figure 14. Packaging
    Figure 15. Agriculture
    Figure 16. Automotive
    Figure 17. Consumer Products
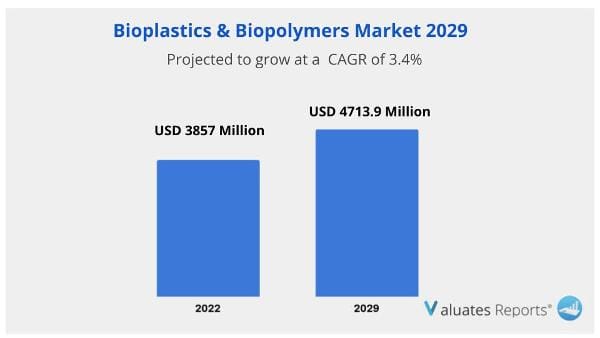
    Figure 18. Global Bioplastics & Biopolymers Production Value (US$ Million), 2018 VS 2022 VS 2029
    Figure 19. Global Bioplastics & Biopolymers Production Value (US$ Million) & (2018-2029)
    Figure 20. Global Bioplastics & Biopolymers Production Capacity (MT) & (2018-2029)
    Figure 21. Global Bioplastics & Biopolymers Production (MT) & (2018-2029)
    Figure 22. Global Bioplastics & Biopolymers Average Price (USD/MT) & (2018-2029)
    Figure 23. Bioplastics & Biopolymers Report Years Considered
    Figure 24. Bioplastics & Biopolymers Production Share by Manufacturers in 2022
    Figure 25. Bioplastics & Biopolymers Market Share by Company Type (Tier 1, Tier 2, and Tier 3): 2018 VS 2022
    Figure 26. The Global 5 and 10 Largest Players: Market Share by Bioplastics & Biopolymers Revenue in 2022
    Figure 27. Global Bioplastics & Biopolymers Production Value by Region: 2018 VS 2022 VS 2029 (US$ Million)
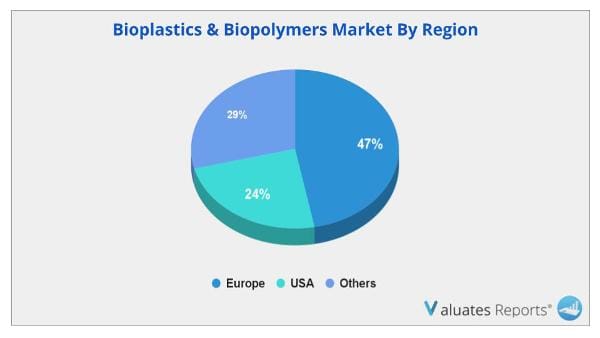
    Figure 28. Global Bioplastics & Biopolymers Production Value Market Share by Region: 2018 VS 2022 VS 2029
    Figure 29. Global Bioplastics & Biopolymers Production Comparison by Region: 2018 VS 2022 VS 2029 (MT)
    Figure 30. Global Bioplastics & Biopolymers Production Market Share by Region: 2018 VS 2022 VS 2029
    Figure 31. North America Bioplastics & Biopolymers Production Value (US$ Million) Growth Rate (2018-2029)
    Figure 32. Europe Bioplastics & Biopolymers Production Value (US$ Million) Growth Rate (2018-2029)
    Figure 33. China Bioplastics & Biopolymers Production Value (US$ Million) Growth Rate (2018-2029)
    Figure 34. Japan Bioplastics & Biopolymers Production Value (US$ Million) Growth Rate (2018-2029)
    Figure 35. Global Bioplastics & Biopolymers Consumption by Region: 2018 VS 2022 VS 2029 (MT)
    Figure 36. Global Bioplastics & Biopolymers Consumption Market Share by Region: 2018 VS 2022 VS 2029
    Figure 37. North America Bioplastics & Biopolymers Consumption and Growth Rate (2018-2023) & (MT)
    Figure 38. North America Bioplastics & Biopolymers Consumption Market Share by Country (2018-2029)
    Figure 39. Canada Bioplastics & Biopolymers Consumption and Growth Rate (2018-2023) & (MT)
    Figure 40. U.S. Bioplastics & Biopolymers Consumption and Growth Rate (2018-2023) & (MT)
    Figure 41. Europe Bioplastics & Biopolymers Consumption and Growth Rate (2018-2023) & (MT)
    Figure 42. Europe Bioplastics & Biopolymers Consumption Market Share by Country (2018-2029)
    Figure 43. Germany Bioplastics & Biopolymers Consumption and Growth Rate (2018-2023) & (MT)
    Figure 44. France Bioplastics & Biopolymers Consumption and Growth Rate (2018-2023) & (MT)
    Figure 45. U.K. Bioplastics & Biopolymers Consumption and Growth Rate (2018-2023) & (MT)
    Figure 46. Italy Bioplastics & Biopolymers Consumption and Growth Rate (2018-2023) & (MT)
    Figure 47. Russia Bioplastics & Biopolymers Consumption and Growth Rate (2018-2023) & (MT)
    Figure 48. Asia Pacific Bioplastics & Biopolymers Consumption and Growth Rate (2018-2023) & (MT)
    Figure 49. Asia Pacific Bioplastics & Biopolymers Consumption Market Share by Regions (2018-2029)
    Figure 50. China Bioplastics & Biopolymers Consumption and Growth Rate (2018-2023) & (MT)
    Figure 51. Japan Bioplastics & Biopolymers Consumption and Growth Rate (2018-2023) & (MT)
    Figure 52. South Korea Bioplastics & Biopolymers Consumption and Growth Rate (2018-2023) & (MT)
    Figure 53. China Taiwan Bioplastics & Biopolymers Consumption and Growth Rate (2018-2023) & (MT)
    Figure 54. Southeast Asia Bioplastics & Biopolymers Consumption and Growth Rate (2018-2023) & (MT)
    Figure 55. India Bioplastics & Biopolymers Consumption and Growth Rate (2018-2023) & (MT)
    Figure 56. Latin America, Middle East & Africa Bioplastics & Biopolymers Consumption and Growth Rate (2018-2023) & (MT)
    Figure 57. Latin America, Middle East & Africa Bioplastics & Biopolymers Consumption Market Share by Country (2018-2029)
    Figure 58. Mexico Bioplastics & Biopolymers Consumption and Growth Rate (2018-2023) & (MT)
    Figure 59. Brazil Bioplastics & Biopolymers Consumption and Growth Rate (2018-2023) & (MT)
    Figure 60. Turkey Bioplastics & Biopolymers Consumption and Growth Rate (2018-2023) & (MT)
    Figure 61. GCC Countries Bioplastics & Biopolymers Consumption and Growth Rate (2018-2023) & (MT)
    Figure 62. Global Production Market Share of Bioplastics & Biopolymers by Materials (2018-2029)
    Figure 63. Global Production Value Market Share of Bioplastics & Biopolymers by Materials (2018-2029)
    Figure 64. Global Bioplastics & Biopolymers Price (USD/MT) by Materials (2018-2029)
    Figure 65. Global Production Market Share of Bioplastics & Biopolymers by Application (2018-2029)
    Figure 66. Global Production Value Market Share of Bioplastics & Biopolymers by Application (2018-2029)
    Figure 67. Global Bioplastics & Biopolymers Price (USD/MT) by Application (2018-2029)
    Figure 68. Bioplastics & Biopolymers Value Chain
    Figure 69. Bioplastics & Biopolymers Production Process
    Figure 70. Channels of Distribution (Direct Vs Distribution)
    Figure 71. Distributors Profiles
    Figure 72. Bottom-up and Top-down Approaches for This Report
    Figure 73. Data Triangulation
SELECT A FORMAT
Added to Cart
Electronic (PDF)

$2900

This license allows only one user to access the PDF.
Electronic (PDF)

$4350

This license allows 1 - 5 user to access the PDF, license is suitable for small groups of 5 users working together
Electronic (PDF)

$5800

This license allows users/teams in a same Enterprise to use this report, various departments within an enterpise can use this report
Add to Cart
Buy Now (15% Discount)

OUR CUSTOMER

SIS Group of Schools

RELATED REPORTS

Global PVD Coating Material Market Research Report 2024

120 Pages
Type: Report
Code: QYRE-Auto-32N8296
Wed Apr 17 00:00:00 UTC 2024

Add to Cart

Global Poly(tetramethylene ether)glycol Market Research Report 2024

120 Pages
Type: Report
Code: QYRE-Auto-34S13095
Wed Apr 17 00:00:00 UTC 2024

Add to Cart

Global PTFE Products Market Research Report 2024

120 Pages
Type: Report
Code: QYRE-Auto-39B8269
Wed Apr 17 00:00:00 UTC 2024

Add to Cart

Global Formaldehyde Analyzer Market Research Report 2024

120 Pages
Type: Report
Code: QYRE-Auto-10G8465
Wed Apr 17 00:00:00 UTC 2024

Add to Cart