
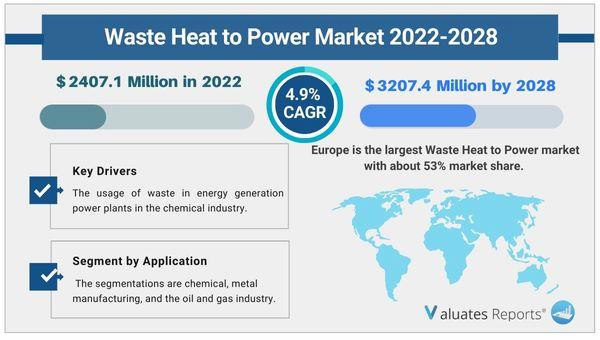
Due to the COVID-19 pandemic, the global Waste Heat to Power market size is estimated to be worth US$ 2407.1 million in 2022 and is forecast to be a readjusted size of US$ 3207.4 million by 2028 with a CAGR of 4.9% during the forecast period. Key drivers of the Waste Heat to Power market include the usage of waste in energy generation power plants in the chemical industry.
Metal manufacturing like steel releases several toxic wastes which are burned in thermoelectric power plants in turn fueling the growth of the waste-to-energy market.
The rising application in the oil and gas industry will propel the market forward in the coming years.
Chemical sector
Chemical wastes like mercury-containing equipment, fluorescent bulbs, and batteries catch fire and explode easily. They are quite harmful to human health. Such solid wastes can be used for generating electricity, heat, or fuel. The conversion from waste to energy is crucial for recycling. Depolymerization uses thermal decomposition to process the organic compounds of waste at high temperatures which are then converted into thermal energy. The Kalina cycle converts this thermal into mechanical energy. In the case of gasification, the carbonaceous substances are converted into carbon dioxide, carbon monoxide, and hydrogen at high temperatures in the presence of oxygen. The resultant synthesis gas is used for generating electricity and heat. Such widespread scope of processes will drive the growth of the waste-to-energy market in the coming years. Plasma arc gasification uses a plasma torch to ionize gas which is produced through compression.
Metal Manufacturing
The production of metals such as steel releases many harmful residual gases with high levels of methane, carbon dioxide, and carbon monoxide. Because of their toxicity and tendency to increase greenhouse gas effect the need for proper disposal and recycling arises. This will push the demand for the waste to energy market in the forthcoming years. The waste gases are therefore burned in the combustion boiler of the thermoelectric plant. It is a highly effective use of contaminated industrial by-products. The generated electricity or heat from the steel gases ends up providing huge environmental benefits by avoiding annual emissions of approximately 1.2 million tonnes of Co2 into the atmosphere.
Oil and Gas Industry
Renewable power generation and waste to energy have emerged as viable alternatives in place of fossil fuels. Several countries are deploying waste-to-energy technology to overcome the reduction in landfill capacity. Oil and refinery by-products serve as potential sources for power generation. Waste sources such as contaminated water, brine, drilling fluids, and mud are toxic to the environment. Several waste disposal strategies exist such as thermal desorption, osmotic filtration, etc. This will boost the growth of the waste-to-energy market in the coming years. Slurry injection and landfilling are the preferred choices for converting waste for power generation. A stringent regulatory environment and R&D initiatives are being done to overcome the problem.
Based on type, the segmentations include the steam Rankine cycle, organic ranking cycle, and Kalina cycle. Kalina Cycle is a thermodynamic process for converting thermal energy into mechanical energy. It utilizes a solution of 2 fluids to achieve boiling points for its working fluid. While Rankine organic cycles use low-temperature heat exploitation. And steam Rankine cycle exploits steam turbines to extract fluid as it moves between a heat source and heat sink.
Based on application, the segmentations are chemical, metal manufacturing, and the oil and gas industry.
Based on region, Europe is expected to dominate in the waste-to-energy market share with a CAGR of 53% due to favorable government policies for waste management and direct subsidies to waste-to-energy plants. While North America is the second largest with a 30% share.
|
Report Metric |
Details |
|
Report Name |
Waste Heat To Power Market |
|
The market size in 2022 |
USD 2407.1 Million |
|
The revenue forecast in 2028 |
USD 3207.4 Million |
|
Growth Rate |
Compound Annual Growth Rate (CAGR) of 4.9% from 2022 to 2028 |
|
Market size available for years |
2022-2028 |
|
Forecast units |
Value (USD) |
|
Segments covered |
By Type, Application, and Region |
|
Report coverage |
Revenue & volume forecast, company share, competitive landscape, growth factors, and trends |
|
Geographic regions covered |
North America, Europe, Asia Pacific, Latin America, Middle East & Africa |
Ans. The global Waste Heat to Power market size is estimated to be worth US$ 2407.1 million in 2022 and is forecast to a readjusted size of US$ 3207.4 million by 2028.
Ans. The global Digital Logistics market is expected to grow at a compound annual growth rate of 4.9% from 2022 to 2028.
Ans. The key players are Siemens, GE, ABB, Amec Foster Wheeler, Ormat, MHI, Exergy, ElectraTherm, Dürr Cyplan, GETEC, CNBM, DaLian East, E-Rational etc. Top 3 companies occupied about 51% market share.
Table of content:
1 Study Coverage
1.1 Waste Heat to Power Product Introduction
1.2 Market by Type
1.2.1 Global Waste Heat to Power Market Size by Type, 2017 VS 2021 VS 2028
1.2.2 Steam Rankine Cycle
1.2.3 Organic Rankine Cycles
1.2.4 Kalina Cycle
1.3 Market by Application
1.3.1 Global Waste Heat to Power Market Size by Application, 2017 VS 2021 VS 2028
1.3.2 Chemical Industry
1.3.3 Metal Manufacturing
1.3.4 Oil and Gas
1.3.5 Others
1.4 Study Objectives
1.5 Years Considered
2 Global Waste Heat to Power Production
2.1 Global Waste Heat to Power Production Capacity (2017-2028)
2.2 Global Waste Heat to Power Production by Region: 2017 VS 2021 VS 2028
2.3 Global Waste Heat to Power Production by Region
2.3.1 Global Waste Heat to Power Historic Production by Region (2017-2022)
2.3.2 Global Waste Heat to Power Forecasted Production by Region (2023-2028)
2.4 North America
2.5 Europe
2.6 China
2.7 Japan
3 Global Waste Heat to Power Sales in Volume & Value Estimates and Forecasts
3.1 Global Waste Heat to Power Sales Estimates and Forecasts 2017-2028
3.2 Global Waste Heat to Power Revenue Estimates and Forecasts 2017-2028
3.3 Global Waste Heat to Power Revenue by Region: 2017 VS 2021 VS 2028
3.4 Global Waste Heat to Power Sales by Region
3.4.1 Global Waste Heat to Power Sales by Region (2017-2022)
3.4.2 Global Sales Waste Heat to Power by Region (2023-2028)
3.5 Global Waste Heat to Power Revenue by Region
3.5.1 Global Waste Heat to Power Revenue by Region (2017-2022)
3.5.2 Global Waste Heat to Power Revenue by Region (2023-2028)
3.6 North America
3.7 Europe
3.8 Asia-Pacific
3.9 Latin America
3.10 Middle East & Africa
4 Competition by Manufactures
4.1 Global Waste Heat to Power Production Capacity by Manufacturers
4.2 Global Waste Heat to Power Sales by Manufacturers
4.2.1 Global Waste Heat to Power Sales by Manufacturers (2017-2022)
4.2.2 Global Waste Heat to Power Sales Market Share by Manufacturers (2017-2022)
4.2.3 Global Top 10 and Top 5 Largest Manufacturers of Waste Heat to Power in 2021
4.3 Global Waste Heat to Power Revenue by Manufacturers
4.3.1 Global Waste Heat to Power Revenue by Manufacturers (2017-2022)
4.3.2 Global Waste Heat to Power Revenue Market Share by Manufacturers (2017-2022)
4.3.3 Global Top 10 and Top 5 Companies by Waste Heat to Power Revenue in 2021
4.4 Global Waste Heat to Power Sales Price by Manufacturers
4.5 Analysis of Competitive Landscape
4.5.1 Manufacturers Market Concentration Ratio (CR5 and HHI)
4.5.2 Global Waste Heat to Power Market Share by Company Type (Tier 1, Tier 2, and Tier 3)
4.5.3 Global Waste Heat to Power Manufacturers Geographical Distribution
4.6 Mergers & Acquisitions, Expansion Plans
5 Market Size by Type
5.1 Global Waste Heat to Power Sales by Type
5.1.1 Global Waste Heat to Power Historical Sales by Type (2017-2022)
5.1.2 Global Waste Heat to Power Forecasted Sales by Type (2023-2028)
5.1.3 Global Waste Heat to Power Sales Market Share by Type (2017-2028)
5.2 Global Waste Heat to Power Revenue by Type
5.2.1 Global Waste Heat to Power Historical Revenue by Type (2017-2022)
5.2.2 Global Waste Heat to Power Forecasted Revenue by Type (2023-2028)
5.2.3 Global Waste Heat to Power Revenue Market Share by Type (2017-2028)
5.3 Global Waste Heat to Power Price by Type
5.3.1 Global Waste Heat to Power Price by Type (2017-2022)
5.3.2 Global Waste Heat to Power Price Forecast by Type (2023-2028)
6 Market Size by Application
6.1 Global Waste Heat to Power Sales by Application
6.1.1 Global Waste Heat to Power Historical Sales by Application (2017-2022)
6.1.2 Global Waste Heat to Power Forecasted Sales by Application (2023-2028)
6.1.3 Global Waste Heat to Power Sales Market Share by Application (2017-2028)
6.2 Global Waste Heat to Power Revenue by Application
6.2.1 Global Waste Heat to Power Historical Revenue by Application (2017-2022)
6.2.2 Global Waste Heat to Power Forecasted Revenue by Application (2023-2028)
6.2.3 Global Waste Heat to Power Revenue Market Share by Application (2017-2028)
6.3 Global Waste Heat to Power Price by Application
6.3.1 Global Waste Heat to Power Price by Application (2017-2022)
6.3.2 Global Waste Heat to Power Price Forecast by Application (2023-2028)
7 North America
7.1 North America Waste Heat to Power Market Size by Type
7.1.1 North America Waste Heat to Power Sales by Type (2017-2028)
7.1.2 North America Waste Heat to Power Revenue by Type (2017-2028)
7.2 North America Waste Heat to Power Market Size by Application
7.2.1 North America Waste Heat to Power Sales by Application (2017-2028)
7.2.2 North America Waste Heat to Power Revenue by Application (2017-2028)
7.3 North America Waste Heat to Power Sales by Country
7.3.1 North America Waste Heat to Power Sales by Country (2017-2028)
7.3.2 North America Waste Heat to Power Revenue by Country (2017-2028)
7.3.3 U.S.
7.3.4 Canada
8 Europe
8.1 Europe Waste Heat to Power Market Size by Type
8.1.1 Europe Waste Heat to Power Sales by Type (2017-2028)
8.1.2 Europe Waste Heat to Power Revenue by Type (2017-2028)
8.2 Europe Waste Heat to Power Market Size by Application
8.2.1 Europe Waste Heat to Power Sales by Application (2017-2028)
8.2.2 Europe Waste Heat to Power Revenue by Application (2017-2028)
8.3 Europe Waste Heat to Power Sales by Country
8.3.1 Europe Waste Heat to Power Sales by Country (2017-2028)
8.3.2 Europe Waste Heat to Power Revenue by Country (2017-2028)
8.3.3 Germany
8.3.4 France
8.3.5 U.K.
8.3.6 Italy
8.3.7 Russia
9 Asia Pacific
9.1 Asia Pacific Waste Heat to Power Market Size by Type
9.1.1 Asia Pacific Waste Heat to Power Sales by Type (2017-2028)
9.1.2 Asia Pacific Waste Heat to Power Revenue by Type (2017-2028)
9.2 Asia Pacific Waste Heat to Power Market Size by Application
9.2.1 Asia Pacific Waste Heat to Power Sales by Application (2017-2028)
9.2.2 Asia Pacific Waste Heat to Power Revenue by Application (2017-2028)
9.3 Asia Pacific Waste Heat to Power Sales by Region
9.3.1 Asia Pacific Waste Heat to Power Sales by Region (2017-2028)
9.3.2 Asia Pacific Waste Heat to Power Revenue by Region (2017-2028)
9.3.3 China
9.3.4 Japan
9.3.5 South Korea
9.3.6 India
9.3.7 Australia
9.3.8 Taiwan
9.3.9 Indonesia
9.3.10 Thailand
9.3.11 Malaysia
9.3.12 Philippines
10 Latin America
10.1 Latin America Waste Heat to Power Market Size by Type
10.1.1 Latin America Waste Heat to Power Sales by Type (2017-2028)
10.1.2 Latin America Waste Heat to Power Revenue by Type (2017-2028)
10.2 Latin America Waste Heat to Power Market Size by Application
10.2.1 Latin America Waste Heat to Power Sales by Application (2017-2028)
10.2.2 Latin America Waste Heat to Power Revenue by Application (2017-2028)
10.3 Latin America Waste Heat to Power Sales by Country
10.3.1 Latin America Waste Heat to Power Sales by Country (2017-2028)
10.3.2 Latin America Waste Heat to Power Revenue by Country (2017-2028)
10.3.3 Mexico
10.3.4 Brazil
10.3.5 Argentina
11 Middle East and Africa
11.1 Middle East and Africa Waste Heat to Power Market Size by Type
11.1.1 Middle East and Africa Waste Heat to Power Sales by Type (2017-2028)
11.1.2 Middle East and Africa Waste Heat to Power Revenue by Type (2017-2028)
11.2 Middle East and Africa Waste Heat to Power Market Size by Application
11.2.1 Middle East and Africa Waste Heat to Power Sales by Application (2017-2028)
11.2.2 Middle East and Africa Waste Heat to Power Revenue by Application (2017-2028)
11.3 Middle East and Africa Waste Heat to Power Sales by Country
11.3.1 Middle East and Africa Waste Heat to Power Sales by Country (2017-2028)
11.3.2 Middle East and Africa Waste Heat to Power Revenue by Country (2017-2028)
11.3.3 Turkey
11.3.4 Saudi Arabia
11.3.5 U.A.E
12 Corporate Profiles
12.1 Siemens
12.1.1 Siemens Corporation Information
12.1.2 Siemens Overview
12.1.3 Siemens Waste Heat to Power Sales, Price, Revenue and Gross Margin (2017-2022)
12.1.4 Siemens Waste Heat to Power Product Model Numbers, Pictures, Descriptions and Specifications
12.1.5 Siemens Recent Developments
12.2 GE
12.2.1 GE Corporation Information
12.2.2 GE Overview
12.2.3 GE Waste Heat to Power Sales, Price, Revenue and Gross Margin (2017-2022)
12.2.4 GE Waste Heat to Power Product Model Numbers, Pictures, Descriptions and Specifications
12.2.5 GE Recent Developments
12.3 ABB
12.3.1 ABB Corporation Information
12.3.2 ABB Overview
12.3.3 ABB Waste Heat to Power Sales, Price, Revenue and Gross Margin (2017-2022)
12.3.4 ABB Waste Heat to Power Product Model Numbers, Pictures, Descriptions and Specifications
12.3.5 ABB Recent Developments
12.4 Amec Foster Wheeler
12.4.1 Amec Foster Wheeler Corporation Information
12.4.2 Amec Foster Wheeler Overview
12.4.3 Amec Foster Wheeler Waste Heat to Power Sales, Price, Revenue and Gross Margin (2017-2022)
12.4.4 Amec Foster Wheeler Waste Heat to Power Product Model Numbers, Pictures, Descriptions and Specifications
12.4.5 Amec Foster Wheeler Recent Developments
12.5 Ormat
12.5.1 Ormat Corporation Information
12.5.2 Ormat Overview
12.5.3 Ormat Waste Heat to Power Sales, Price, Revenue and Gross Margin (2017-2022)
12.5.4 Ormat Waste Heat to Power Product Model Numbers, Pictures, Descriptions and Specifications
12.5.5 Ormat Recent Developments
12.6 MHI
12.6.1 MHI Corporation Information
12.6.2 MHI Overview
12.6.3 MHI Waste Heat to Power Sales, Price, Revenue and Gross Margin (2017-2022)
12.6.4 MHI Waste Heat to Power Product Model Numbers, Pictures, Descriptions and Specifications
12.6.5 MHI Recent Developments
12.7 Exergy
12.7.1 Exergy Corporation Information
12.7.2 Exergy Overview
12.7.3 Exergy Waste Heat to Power Sales, Price, Revenue and Gross Margin (2017-2022)
12.7.4 Exergy Waste Heat to Power Product Model Numbers, Pictures, Descriptions and Specifications
12.7.5 Exergy Recent Developments
12.8 ElectraTherm
12.8.1 ElectraTherm Corporation Information
12.8.2 ElectraTherm Overview
12.8.3 ElectraTherm Waste Heat to Power Sales, Price, Revenue and Gross Margin (2017-2022)
12.8.4 ElectraTherm Waste Heat to Power Product Model Numbers, Pictures, Descriptions and Specifications
12.8.5 ElectraTherm Recent Developments
12.9 Dürr Cyplan
12.9.1 Dürr Cyplan Corporation Information
12.9.2 Dürr Cyplan Overview
12.9.3 Dürr Cyplan Waste Heat to Power Sales, Price, Revenue and Gross Margin (2017-2022)
12.9.4 Dürr Cyplan Waste Heat to Power Product Model Numbers, Pictures, Descriptions and Specifications
12.9.5 Dürr Cyplan Recent Developments
12.10 GETEC
12.10.1 GETEC Corporation Information
12.10.2 GETEC Overview
12.10.3 GETEC Waste Heat to Power Sales, Price, Revenue and Gross Margin (2017-2022)
12.10.4 GETEC Waste Heat to Power Product Model Numbers, Pictures, Descriptions and Specifications
12.10.5 GETEC Recent Developments
12.11 CNBM
12.11.1 CNBM Corporation Information
12.11.2 CNBM Overview
12.11.3 CNBM Waste Heat to Power Sales, Price, Revenue and Gross Margin (2017-2022)
12.11.4 CNBM Waste Heat to Power Product Model Numbers, Pictures, Descriptions and Specifications
12.11.5 CNBM Recent Developments
12.12 DaLian East
12.12.1 DaLian East Corporation Information
12.12.2 DaLian East Overview
12.12.3 DaLian East Waste Heat to Power Sales, Price, Revenue and Gross Margin (2017-2022)
12.12.4 DaLian East Waste Heat to Power Product Model Numbers, Pictures, Descriptions and Specifications
12.12.5 DaLian East Recent Developments
12.13 E-Rational
12.13.1 E-Rational Corporation Information
12.13.2 E-Rational Overview
12.13.3 E-Rational Waste Heat to Power Sales, Price, Revenue and Gross Margin (2017-2022)
12.13.4 E-Rational Waste Heat to Power Product Model Numbers, Pictures, Descriptions and Specifications
12.13.5 E-Rational Recent Developments
13 Industry Chain and Sales Channels Analysis
13.1 Waste Heat to Power Industry Chain Analysis
13.2 Waste Heat to Power Key Raw Materials
13.2.1 Key Raw Materials
13.2.2 Raw Materials Key Suppliers
13.3 Waste Heat to Power Production Mode & Process
13.4 Waste Heat to Power Sales and Marketing
13.4.1 Waste Heat to Power Sales Channels
13.4.2 Waste Heat to Power Distributors
13.5 Waste Heat to Power Customers
14 Market Drivers, Opportunities, Challenges and Risks Factors Analysis
14.1 Waste Heat to Power Industry Trends
14.2 Waste Heat to Power Market Drivers
14.3 Waste Heat to Power Market Challenges
14.4 Waste Heat to Power Market Restraints
15 Key Finding in The Global Waste Heat to Power Study
16 Appendix
16.1 Research Methodology
16.1.1 Methodology/Research Approach
16.1.2 Data Source
16.2 Author Details
16.3 Disclaimer
List of Tables
Table 1. Global Waste Heat to Power Market Size Growth Rate by Type, 2017 VS 2021 VS 2028 (US$ Million)
Table 2. Major Manufacturers of Steam Rankine Cycle
Table 3. Major Manufacturers of Organic Rankine Cycles
Table 4. Major Manufacturers of Kalina Cycle
Table 5. Global Waste Heat to Power Market Size Growth Rate by Application, 2017 VS 2021 2028 (US$ Million)
Table 6. Global Waste Heat to Power Production by Region: 2017 VS 2021 VS 2028 (MW)
Table 7. Global Waste Heat to Power Production by Region (2017-2022) & (MW)
Table 8. Global Waste Heat to Power Production Market Share by Region (2017-2022)
Table 9. Global Waste Heat to Power Production by Region (2023-2028) & (MW)
Table 10. Global Waste Heat to Power Production Market Share by Region (2023-2028)
Table 11. Global Waste Heat to Power Revenue by Region: 2017 VS 2021 VS 2028 (US$ Million)
Table 12. Global Waste Heat to Power Sales by Region (2017-2022) & (MW)
Table 13. Global Waste Heat to Power Sales Market Share by Region (2017-2022)
Table 14. Global Waste Heat to Power Sales by Region (2023-2028) & (MW)
Table 15. Global Waste Heat to Power Sales Market Share by Region (2023-2028)
Table 16. Global Waste Heat to Power Revenue by Region (2017-2022) & (US$ Million)
Table 17. Global Waste Heat to Power Revenue Market Share by Region (2017-2022)
Table 18. Global Waste Heat to Power Revenue by Region (2023-2028) & (US$ Million)
Table 19. Global Waste Heat to Power Revenue Market Share by Region (2023-2028)
Table 20. Global Waste Heat to Power Production Capacity by Manufacturers (2017-2022) & (MW)
Table 21. Global Waste Heat to Power Capacity Market Share by Manufacturers (2017-2022)
Table 22. Global Waste Heat to Power Sales by Manufacturers (2017-2022) & (MW)
Table 23. Global Waste Heat to Power Sales Market Share by Manufacturers (2017-2022)
Table 24. Global Waste Heat to Power Revenue by Manufacturers (2017-2022) & (US$ Million)
Table 25. Global Waste Heat to Power Revenue Share by Manufacturers (2017-2022)
Table 26. Waste Heat to Power Price by Manufacturers 2017-2022 (USD/KW)
Table 27. Global Waste Heat to Power Manufacturers Market Concentration Ratio (CR5 and HHI)
Table 28. Global Waste Heat to Power by Company Type (Tier 1, Tier 2, and Tier 3) & (based on the Revenue in Waste Heat to Power as of 2021)
Table 29. Waste Heat to Power Manufacturing Base Distribution and Headquarters
Table 30. Manufacturers Waste Heat to Power Product Offered
Table 31. Date of Manufacturers Enter into Waste Heat to Power Market
Table 32. Mergers & Acquisitions, Expansion Plans
Table 33. Global Waste Heat to Power Sales by Type (2017-2022) & (MW)
Table 34. Global Waste Heat to Power Sales by Type (2023-2028) & (MW)
Table 35. Global Waste Heat to Power Sales Share by Type (2017-2022)
Table 36. Global Waste Heat to Power Sales Share by Type (2023-2028)
Table 37. Global Waste Heat to Power Revenue by Type (2017-2022) & (US$ Million)
Table 38. Global Waste Heat to Power Revenue by Type (2023-2028) & (US$ Million)
Table 39. Global Waste Heat to Power Revenue Share by Type (2017-2022)
Table 40. Global Waste Heat to Power Revenue Share by Type (2023-2028)
Table 41. Waste Heat to Power Price by Type (2017-2022) & (USD/KW)
Table 42. Global Waste Heat to Power Price Forecast by Type (2023-2028) & (USD/KW)
Table 43. Global Waste Heat to Power Sales by Application (2017-2022) & (MW)
Table 44. Global Waste Heat to Power Sales by Application (2023-2028) & (MW)
Table 45. Global Waste Heat to Power Sales Share by Application (2017-2022)
Table 46. Global Waste Heat to Power Sales Share by Application (2023-2028)
Table 47. Global Waste Heat to Power Revenue by Application (2017-2022) & (US$ Million)
Table 48. Global Waste Heat to Power Revenue by Application (2023-2028) & (US$ Million)
Table 49. Global Waste Heat to Power Revenue Share by Application (2017-2022)
Table 50. Global Waste Heat to Power Revenue Share by Application (2023-2028)
Table 51. Waste Heat to Power Price by Application (2017-2022) & (USD/KW)
Table 52. Global Waste Heat to Power Price Forecast by Application (2023-2028) & (USD/KW)
Table 53. North America Waste Heat to Power Sales by Type (2017-2022) & (MW)
Table 54. North America Waste Heat to Power Sales by Type (2023-2028) & (MW)
Table 55. North America Waste Heat to Power Revenue by Type (2017-2022) & (US$ Million)
Table 56. North America Waste Heat to Power Revenue by Type (2023-2028) & (US$ Million)
Table 57. North America Waste Heat to Power Sales by Application (2017-2022) & (MW)
Table 58. North America Waste Heat to Power Sales by Application (2023-2028) & (MW)
Table 59. North America Waste Heat to Power Revenue by Application (2017-2022) & (US$ Million)
Table 60. North America Waste Heat to Power Revenue by Application (2023-2028) & (US$ Million)
Table 61. North America Waste Heat to Power Sales by Country (2017-2022) & (MW)
Table 62. North America Waste Heat to Power Sales by Country (2023-2028) & (MW)
Table 63. North America Waste Heat to Power Revenue by Country (2017-2022) & (US$ Million)
Table 64. North America Waste Heat to Power Revenue by Country (2023-2028) & (US$ Million)
Table 65. Europe Waste Heat to Power Sales by Type (2017-2022) & (MW)
Table 66. Europe Waste Heat to Power Sales by Type (2023-2028) & (MW)
Table 67. Europe Waste Heat to Power Revenue by Type (2017-2022) & (US$ Million)
Table 68. Europe Waste Heat to Power Revenue by Type (2023-2028) & (US$ Million)
Table 69. Europe Waste Heat to Power Sales by Application (2017-2022) & (MW)
Table 70. Europe Waste Heat to Power Sales by Application (2023-2028) & (MW)
Table 71. Europe Waste Heat to Power Revenue by Application (2017-2022) & (US$ Million)
Table 72. Europe Waste Heat to Power Revenue by Application (2023-2028) & (US$ Million)
Table 73. Europe Waste Heat to Power Sales by Country (2017-2022) & (MW)
Table 74. Europe Waste Heat to Power Sales by Country (2023-2028) & (MW)
Table 75. Europe Waste Heat to Power Revenue by Country (2017-2022) & (US$ Million)
Table 76. Europe Waste Heat to Power Revenue by Country (2023-2028) & (US$ Million)
Table 77. Asia Pacific Waste Heat to Power Sales by Type (2017-2022) & (MW)
Table 78. Asia Pacific Waste Heat to Power Sales by Type (2023-2028) & (MW)
Table 79. Asia Pacific Waste Heat to Power Revenue by Type (2017-2022) & (US$ Million)
Table 80. Asia Pacific Waste Heat to Power Revenue by Type (2023-2028) & (US$ Million)
Table 81. Asia Pacific Waste Heat to Power Sales by Application (2017-2022) & (MW)
Table 82. Asia Pacific Waste Heat to Power Sales by Application (2023-2028) & (MW)
Table 83. Asia Pacific Waste Heat to Power Revenue by Application (2017-2022) & (US$ Million)
Table 84. Asia Pacific Waste Heat to Power Revenue by Application (2023-2028) & (US$ Million)
Table 85. Asia Pacific Waste Heat to Power Sales by Region (2017-2022) & (MW)
Table 86. Asia Pacific Waste Heat to Power Sales by Region (2023-2028) & (MW)
Table 87. Asia Pacific Waste Heat to Power Revenue by Region (2017-2022) & (US$ Million)
Table 88. Asia Pacific Waste Heat to Power Revenue by Region (2023-2028) & (US$ Million)
Table 89. Latin America Waste Heat to Power Sales by Type (2017-2022) & (MW)
Table 90. Latin America Waste Heat to Power Sales by Type (2023-2028) & (MW)
Table 91. Latin America Waste Heat to Power Revenue by Type (2017-2022) & (US$ Million)
Table 92. Latin America Waste Heat to Power Revenue by Type (2023-2028) & (US$ Million)
Table 93. Latin America Waste Heat to Power Sales by Application (2017-2022) & (MW)
Table 94. Latin America Waste Heat to Power Sales by Application (2023-2028) & (MW)
Table 95. Latin America Waste Heat to Power Revenue by Application (2017-2022) & (US$ Million)
Table 96. Latin America Waste Heat to Power Revenue by Application (2023-2028) & (US$ Million)
Table 97. Latin America Waste Heat to Power Sales by Country (2017-2022) & (MW)
Table 98. Latin America Waste Heat to Power Sales by Country (2023-2028) & (MW)
Table 99. Latin America Waste Heat to Power Revenue by Country (2017-2022) & (US$ Million)
Table 100. Latin America Waste Heat to Power Revenue by Country (2023-2028) & (US$ Million)
Table 101. Middle East and Africa Waste Heat to Power Sales by Type (2017-2022) & (MW)
Table 102. Middle East and Africa Waste Heat to Power Sales by Type (2023-2028) & (MW)
Table 103. Middle East and Africa Waste Heat to Power Revenue by Type (2017-2022) & (US$ Million)
Table 104. Middle East and Africa Waste Heat to Power Revenue by Type (2023-2028) & (US$ Million)
Table 105. Middle East and Africa Waste Heat to Power Sales by Application (2017-2022) & (MW)
Table 106. Middle East and Africa Waste Heat to Power Sales by Application (2023-2028) & (MW)
Table 107. Middle East and Africa Waste Heat to Power Revenue by Application (2017-2022) & (US$ Million)
Table 108. Middle East and Africa Waste Heat to Power Revenue by Application (2023-2028) & (US$ Million)
Table 109. Middle East and Africa Waste Heat to Power Sales by Country (2017-2022) & (MW)
Table 110. Middle East and Africa Waste Heat to Power Sales by Country (2023-2028) & (MW)
Table 111. Middle East and Africa Waste Heat to Power Revenue by Country (2017-2022) & (US$ Million)
Table 112. Middle East and Africa Waste Heat to Power Revenue by Country (2023-2028) & (US$ Million)
Table 113. Siemens Corporation Information
Table 114. Siemens Description and Major Businesses
Table 115. Siemens Waste Heat to Power Sales (MW), Revenue (US$ Million), Price (USD/KW) and Gross Margin (2017-2022)
Table 116. Siemens Waste Heat to Power Product Model Numbers, Pictures, Descriptions and Specifications
Table 117. Siemens Recent Development
Table 118. GE Corporation Information
Table 119. GE Description and Major Businesses
Table 120. GE Waste Heat to Power Sales (MW), Revenue (US$ Million), Price (USD/KW) and Gross Margin (2017-2022)
Table 121. GE Waste Heat to Power Product Model Numbers, Pictures, Descriptions and Specifications
Table 122. GE Recent Development
Table 123. ABB Corporation Information
Table 124. ABB Description and Major Businesses
Table 125. ABB Waste Heat to Power Sales (MW), Revenue (US$ Million), Price (USD/KW) and Gross Margin (2017-2022)
Table 126. ABB Waste Heat to Power Product Model Numbers, Pictures, Descriptions and Specifications
Table 127. ABB Recent Development
Table 128. Amec Foster Wheeler Corporation Information
Table 129. Amec Foster Wheeler Description and Major Businesses
Table 130. Amec Foster Wheeler Waste Heat to Power Sales (MW), Revenue (US$ Million), Price (USD/KW) and Gross Margin (2017-2022)
Table 131. Amec Foster Wheeler Waste Heat to Power Product Model Numbers, Pictures, Descriptions and Specifications
Table 132. Amec Foster Wheeler Recent Development
Table 133. Ormat Corporation Information
Table 134. Ormat Description and Major Businesses
Table 135. Ormat Waste Heat to Power Sales (MW), Revenue (US$ Million), Price (USD/KW) and Gross Margin (2017-2022)
Table 136. Ormat Waste Heat to Power Product Model Numbers, Pictures, Descriptions and Specifications
Table 137. Ormat Recent Development
Table 138. MHI Corporation Information
Table 139. MHI Description and Major Businesses
Table 140. MHI Waste Heat to Power Sales (MW), Revenue (US$ Million), Price (USD/KW) and Gross Margin (2017-2022)
Table 141. MHI Waste Heat to Power Product Model Numbers, Pictures, Descriptions and Specifications
Table 142. MHI Recent Development
Table 143. Exergy Corporation Information
Table 144. Exergy Description and Major Businesses
Table 145. Exergy Waste Heat to Power Sales (MW), Revenue (US$ Million), Price (USD/KW) and Gross Margin (2017-2022)
Table 146. Exergy Waste Heat to Power Product Model Numbers, Pictures, Descriptions and Specifications
Table 147. Exergy Recent Development
Table 148. ElectraTherm Corporation Information
Table 149. ElectraTherm Description and Major Businesses
Table 150. ElectraTherm Waste Heat to Power Sales (MW), Revenue (US$ Million), Price (USD/KW) and Gross Margin (2017-2022)
Table 151. ElectraTherm Waste Heat to Power Product Model Numbers, Pictures, Descriptions and Specifications
Table 152. ElectraTherm Recent Development
Table 153. Dürr Cyplan Corporation Information
Table 154. Dürr Cyplan Description and Major Businesses
Table 155. Dürr Cyplan Waste Heat to Power Sales (MW), Revenue (US$ Million), Price (USD/KW) and Gross Margin (2017-2022)
Table 156. Dürr Cyplan Waste Heat to Power Product Model Numbers, Pictures, Descriptions and Specifications
Table 157. Dürr Cyplan Recent Development
Table 158. GETEC Corporation Information
Table 159. GETEC Description and Major Businesses
Table 160. GETEC Waste Heat to Power Sales (MW), Revenue (US$ Million), Price (USD/KW) and Gross Margin (2017-2022)
Table 161. GETEC Waste Heat to Power Product Model Numbers, Pictures, Descriptions and Specifications
Table 162. GETEC Recent Development
Table 163. CNBM Corporation Information
Table 164. CNBM Description and Major Businesses
Table 165. CNBM Waste Heat to Power Sales (MW), Revenue (US$ Million), Price (USD/KW) and Gross Margin (2017-2022)
Table 166. CNBM Waste Heat to Power Product Model Numbers, Pictures, Descriptions and Specifications
Table 167. CNBM Recent Development
Table 168. DaLian East Corporation Information
Table 169. DaLian East Description and Major Businesses
Table 170. DaLian East Waste Heat to Power Sales (MW), Revenue (US$ Million), Price (USD/KW) and Gross Margin (2017-2022)
Table 171. DaLian East Waste Heat to Power Product Model Numbers, Pictures, Descriptions and Specifications
Table 172. DaLian East Recent Development
Table 173. E-Rational Corporation Information
Table 174. E-Rational Description and Major Businesses
Table 175. E-Rational Waste Heat to Power Sales (MW), Revenue (US$ Million), Price (USD/KW) and Gross Margin (2017-2022)
Table 176. E-Rational Waste Heat to Power Product Model Numbers, Pictures, Descriptions and Specifications
Table 177. E-Rational Recent Development
Table 178. Key Raw Materials Lists
Table 179. Raw Materials Key Suppliers Lists
Table 180. Waste Heat to Power Distributors List
Table 181. Waste Heat to Power Customers List
Table 182. Waste Heat to Power Market Trends
Table 183. Waste Heat to Power Market Drivers
Table 184. Waste Heat to Power Market Challenges
Table 185. Waste Heat to Power Market Restraints
Table 186. Research Programs/Design for This Report
Table 187. Key Data Information from Secondary Sources
Table 188. Key Data Information from Primary Sources
List of Figures
Figure 1. Waste Heat to Power Product Picture
Figure 2. Global Waste Heat to Power Market Share by Type in 2021 & 2028
Figure 3. Steam Rankine Cycle Product Picture
Figure 4. Organic Rankine Cycles Product Picture
Figure 5. Kalina Cycle Product Picture
Figure 6. Global Waste Heat to Power Market Share by Application in 2021 & 2028
Figure 7. Chemical Industry
Figure 8. Metal Manufacturing
Figure 9. Oil and Gas
Figure 10. Others
Figure 11. Waste Heat to Power Report Years Considered
Figure 12. Global Waste Heat to Power Capacity, Production and Utilization (2017-2028) & (MW)
Figure 13. Global Waste Heat to Power Production Market Share by Region in Percentage: 2021 Versus 2028
Figure 14. Global Waste Heat to Power Production Market Share by Region (2017-2022)
Figure 15. Global Waste Heat to Power Production Market Share by Region (2023-2028)
Figure 16. Waste Heat to Power Production Growth Rate in North America (2017-2028) & (MW)
Figure 17. Waste Heat to Power Production Growth Rate in Europe (2017-2028) & (MW)
Figure 18. Waste Heat to Power Production Growth Rate in China (2017-2028) & (MW)
Figure 19. Waste Heat to Power Production Growth Rate in Japan (2017-2028) & (MW)
Figure 20. Global Waste Heat to Power Sales 2017-2028 (MW)
Figure 21. Global Waste Heat to Power Revenue, (US$ Million), 2017 VS 2021 VS 2028
Figure 22. Global Waste Heat to Power Revenue 2017-2028 (US$ Million)
Figure 23. Global Waste Heat to Power Revenue Market Share by Region in Percentage: 2021 Versus 2028
Figure 24. Global Waste Heat to Power Sales Market Share by Region (2017-2022)
Figure 25. Global Waste Heat to Power Sales Market Share by Region (2023-2028)
Figure 26. North America Waste Heat to Power Sales YoY (2017-2028) & (MW)
Figure 27. North America Waste Heat to Power Revenue YoY (2017-2028) & (US$ Million)
Figure 28. Europe Waste Heat to Power Sales YoY (2017-2028) & (MW)
Figure 29. Europe Waste Heat to Power Revenue YoY (2017-2028) & (US$ Million)
Figure 30. Asia-Pacific Waste Heat to Power Sales YoY (2017-2028) & (MW)
Figure 31. Asia-Pacific Waste Heat to Power Revenue YoY (2017-2028) & (US$ Million)
Figure 32. Latin America Waste Heat to Power Sales YoY (2017-2028) & (MW)
Figure 33. Latin America Waste Heat to Power Revenue YoY (2017-2028) & (US$ Million)
Figure 34. Middle East & Africa Waste Heat to Power Sales YoY (2017-2028) & (MW)
Figure 35. Middle East & Africa Waste Heat to Power Revenue YoY (2017-2028) & (US$ Million)
Figure 36. The Waste Heat to Power Market Share of Top 10 and Top 5 Largest Manufacturers Around the World in 2021
Figure 37. The Top 5 and 10 Largest Manufacturers of Waste Heat to Power in the World: Market Share by Waste Heat to Power Revenue in 2021
Figure 38. Waste Heat to Power Market Share by Company Type (Tier 1, Tier 2, and Tier 3): 2017 VS 2021
Figure 39. Global Waste Heat to Power Sales Market Share by Type (2017-2028)
Figure 40. Global Waste Heat to Power Revenue Market Share by Type (2017-2028)
Figure 41. Global Waste Heat to Power Sales Market Share by Application (2017-2028)
Figure 42. Global Waste Heat to Power Revenue Market Share by Application (2017-2028)
Figure 43. North America Waste Heat to Power Sales Market Share by Type (2017-2028)
Figure 44. North America Waste Heat to Power Revenue Market Share by Type (2017-2028)
Figure 45. North America Waste Heat to Power Sales Market Share by Application (2017-2028)
Figure 46. North America Waste Heat to Power Revenue Market Share by Application (2017-2028)
Figure 47. North America Waste Heat to Power Sales Share by Country (2017-2028)
Figure 48. North America Waste Heat to Power Revenue Share by Country (2017-2028)
Figure 49. U.S. Waste Heat to Power Revenue (2017-2028) & (US$ Million)
Figure 50. Canada Waste Heat to Power Revenue (2017-2028) & (US$ Million)
Figure 51. Europe Waste Heat to Power Sales Market Share by Type (2017-2028)
Figure 52. Europe Waste Heat to Power Revenue Market Share by Type (2017-2028)
Figure 53. Europe Waste Heat to Power Sales Market Share by Application (2017-2028)
Figure 54. Europe Waste Heat to Power Revenue Market Share by Application (2017-2028)
Figure 55. Europe Waste Heat to Power Sales Share by Country (2017-2028)
Figure 56. Europe Waste Heat to Power Revenue Share by Country (2017-2028)
Figure 57. Germany Waste Heat to Power Revenue (2017-2028) & (US$ Million)
Figure 58. France Waste Heat to Power Revenue (2017-2028) & (US$ Million)
Figure 59. U.K. Waste Heat to Power Revenue (2017-2028) & (US$ Million)
Figure 60. Italy Waste Heat to Power Revenue (2017-2028) & (US$ Million)
Figure 61. Russia Waste Heat to Power Revenue (2017-2028) & (US$ Million)
Figure 62. Asia Pacific Waste Heat to Power Sales Market Share by Type (2017-2028)
Figure 63. Asia Pacific Waste Heat to Power Revenue Market Share by Type (2017-2028)
Figure 64. Asia Pacific Waste Heat to Power Sales Market Share by Application (2017-2028)
Figure 65. Asia Pacific Waste Heat to Power Revenue Market Share by Application (2017-2028)
Figure 66. Asia Pacific Waste Heat to Power Sales Share by Region (2017-2028)
Figure 67. Asia Pacific Waste Heat to Power Revenue Share by Region (2017-2028)
Figure 68. China Waste Heat to Power Revenue (2017-2028) & (US$ Million)
Figure 69. Japan Waste Heat to Power Revenue (2017-2028) & (US$ Million)
Figure 70. South Korea Waste Heat to Power Revenue (2017-2028) & (US$ Million)
Figure 71. India Waste Heat to Power Revenue (2017-2028) & (US$ Million)
Figure 72. Australia Waste Heat to Power Revenue (2017-2028) & (US$ Million)
Figure 73. Taiwan Waste Heat to Power Revenue (2017-2028) & (US$ Million)
Figure 74. Indonesia Waste Heat to Power Revenue (2017-2028) & (US$ Million)
Figure 75. Thailand Waste Heat to Power Revenue (2017-2028) & (US$ Million)
Figure 76. Malaysia Waste Heat to Power Revenue (2017-2028) & (US$ Million)
Figure 77. Philippines Waste Heat to Power Revenue (2017-2028) & (US$ Million)
Figure 78. Latin America Waste Heat to Power Sales Market Share by Type (2017-2028)
Figure 79. Latin America Waste Heat to Power Revenue Market Share by Type (2017-2028)
Figure 80. Latin America Waste Heat to Power Sales Market Share by Application (2017-2028)
Figure 81. Latin America Waste Heat to Power Revenue Market Share by Application (2017-2028)
Figure 82. Latin America Waste Heat to Power Sales Share by Country (2017-2028)
Figure 83. Latin America Waste Heat to Power Revenue Share by Country (2017-2028)
Figure 84. Mexico Waste Heat to Power Revenue (2017-2028) & (US$ Million)
Figure 85. Brazil Waste Heat to Power Revenue (2017-2028) & (US$ Million)
Figure 86. Argentina Waste Heat to Power Revenue (2017-2028) & (US$ Million)
Figure 87. Middle East and Africa Waste Heat to Power Sales Market Share by Type (2017-2028)
Figure 88. Middle East and Africa Waste Heat to Power Revenue Market Share by Type (2017-2028)
Figure 89. Middle East and Africa Waste Heat to Power Sales Market Share by Application (2017-2028)
Figure 90. Middle East and Africa Waste Heat to Power Revenue Market Share by Application (2017-2028)
Figure 91. Middle East and Africa Waste Heat to Power Sales Share by Country (2017-2028)
Figure 92. Middle East and Africa Waste Heat to Power Revenue Share by Country (2017-2028)
Figure 93. Turkey Waste Heat to Power Revenue (2017-2028) & (US$ Million)
Figure 94. Saudi Arabia Waste Heat to Power Revenue (2017-2028) & (US$ Million)
Figure 95. U.A.E Waste Heat to Power Revenue (2017-2028) & (US$ Million)
Figure 96. Waste Heat to Power Value Chain
Figure 97. Waste Heat to Power Production Process
Figure 98. Channels of Distribution
Figure 99. Distributors Profiles
Figure 100. Bottom-up and Top-down Approaches for This Report
Figure 101. Data Triangulation
Figure 102. Key Executives Interviewed
$4900
$7350
$9800
HAVE A QUERY?
OUR CUSTOMER

SIMILAR REPORTS
Add to Cart
Add to Cart
Add to Cart
Add to Cart