List of Tables
Table 1. Major Company of 3 Strand
Table 2. Major Company of 8 Strand
Table 3. Major Company of 12 Strand
Table 4. Major Company of Others
Table 5. Global Ultra High Molecular Weight Polyethylene (UHMWPE) Ropes Sales by Type 2018 VS 2022 VS 2029 (US$ Million)
Table 6. Global Ultra High Molecular Weight Polyethylene (UHMWPE) Ropes Sales by Type (2018-2023) & (K MT)
Table 7. Global Ultra High Molecular Weight Polyethylene (UHMWPE) Ropes Sales Market Share in Volume by Type (2018-2023)
Table 8. Global Ultra High Molecular Weight Polyethylene (UHMWPE) Ropes Sales by Type (2018-2023) & (US& Million)
Table 9. Global Ultra High Molecular Weight Polyethylene (UHMWPE) Ropes Market Share in Value by Type (2018-2023)
Table 10. Global Ultra High Molecular Weight Polyethylene (UHMWPE) Ropes Price by Type (2018-2023) & (USD/MT)
Table 11. Global Ultra High Molecular Weight Polyethylene (UHMWPE) Ropes Sales by Type (2024-2029) & (K MT)
Table 12. Global Ultra High Molecular Weight Polyethylene (UHMWPE) Ropes Sales Market Share in Volume by Type (2024-2029)
Table 13. Global Ultra High Molecular Weight Polyethylene (UHMWPE) Ropes Sales by Type (2024-2029) & (US$ Million)
Table 14. Global Ultra High Molecular Weight Polyethylene (UHMWPE) Ropes Sales Market Share in Value by Type (2024-2029)
Table 15. Global Ultra High Molecular Weight Polyethylene (UHMWPE) Ropes Price by Type (2024-2029) & (USD/MT)
Table 16. North America Ultra High Molecular Weight Polyethylene (UHMWPE) Ropes Sales by Type (2018-2023) & (K MT)
Table 17. North America Ultra High Molecular Weight Polyethylene (UHMWPE) Ropes Sales by Type (2018-2023) & (US$ Million)
Table 18. Europe Ultra High Molecular Weight Polyethylene (UHMWPE) Ropes Sales (K MT) by Type (2018-2023)
Table 19. Europe Ultra High Molecular Weight Polyethylene (UHMWPE) Ropes Sales by Type (2018-2023) & (US$ Million)
Table 20. Asia-Pacific Ultra High Molecular Weight Polyethylene (UHMWPE) Ropes Sales (K MT) by Type (2018-2023)
Table 21. Asia-Pacific Ultra High Molecular Weight Polyethylene (UHMWPE) Ropes Sales by Type (2018-2023) & (US$ Million)
Table 22. Latin America Ultra High Molecular Weight Polyethylene (UHMWPE) Ropes Sales (K MT) by Type (2018-2023)
Table 23. Latin America Ultra High Molecular Weight Polyethylene (UHMWPE) Ropes Sales by Type (2018-2023) & (US$ Million)
Table 24. Middle East and Africa Ultra High Molecular Weight Polyethylene (UHMWPE) Ropes Sales (K MT) by Type (2018-2023)
Table 25. Middle East and Africa Ultra High Molecular Weight Polyethylene (UHMWPE) Ropes Sales by Type (2018-2023) & (US$ Million)
Table 26. Global Ultra High Molecular Weight Polyethylene (UHMWPE) Ropes Sales by Company (2018-2023) & (K MT)
Table 27. Global Ultra High Molecular Weight Polyethylene (UHMWPE) Ropes Sales Share by Company (2018-2023)
Table 28. Global Ultra High Molecular Weight Polyethylene (UHMWPE) Ropes Revenue by Company (2018-2023) & (US$ Million)
Table 29. Global Ultra High Molecular Weight Polyethylene (UHMWPE) Ropes Revenue Share by Company (2018-2023)
Table 30. Global Market Ultra High Molecular Weight Polyethylene (UHMWPE) Ropes Price by Company (2018-2023) & (USD/MT)
Table 31. Global Ultra High Molecular Weight Polyethylene (UHMWPE) Ropes Top Manufacturers Manufacturing Base Distribution and Sales Area
Table 32. Global Ultra High Molecular Weight Polyethylene (UHMWPE) Ropes Manufacturers Market Concentration Ratio (CR5 and HHI)
Table 33. Global Top Manufacturers Market Share by Company Type (Tier 1, Tier 2 and Tier 3) & (based on the Revenue in Ultra High Molecular Weight Polyethylene (UHMWPE) Ropes as of 2022)
Table 34. Date of Key Manufacturers Enter into Ultra High Molecular Weight Polyethylene (UHMWPE) Ropes Market
Table 35. Key Manufacturers Ultra High Molecular Weight Polyethylene (UHMWPE) Ropes Product Type
Table 36. Mergers & Acquisitions, Expansion Plans
Table 37. Global Ultra High Molecular Weight Polyethylene (UHMWPE) Ropes Market Size Comparison by Region (US$ Million): 2018 VS 2022 VS 2029
Table 38. Global Ultra High Molecular Weight Polyethylene (UHMWPE) Ropes Sales by Region (2018-2023) & (K MT)
Table 39. Global Ultra High Molecular Weight Polyethylene (UHMWPE) Ropes Sales Market Share in Volume by Region (2018-2023)
Table 40. Global Ultra High Molecular Weight Polyethylene (UHMWPE) Ropes Sales by Region (2018-2023) & (US$ Million)
Table 41. Global Ultra High Molecular Weight Polyethylene (UHMWPE) Ropes Sales Market Share in Value by Region (2018-2023)
Table 42. Global Ultra High Molecular Weight Polyethylene (UHMWPE) Ropes Sales (K MT), Revenue (US$ Million), Price (USD/MT) and Gross Margin (2018-2023)
Table 43. Global Ultra High Molecular Weight Polyethylene (UHMWPE) Ropes Sales by Region (2024-2029) & (K MT)
Table 44. Global Ultra High Molecular Weight Polyethylene (UHMWPE) Ropes Sales Market Share in Volume by Region (2024-2029)
Table 45. Global Ultra High Molecular Weight Polyethylene (UHMWPE) Ropes Sales by Region (2024-2029) & (US$ Million)
Table 46. Global Ultra High Molecular Weight Polyethylene (UHMWPE) Ropes Sales Market Share in Value by Region (2024-2029)
Table 47. Global Ultra High Molecular Weight Polyethylene (UHMWPE) Ropes Sales (K MT), Revenue (US$ Million), Price (USD/MT) and Gross Margin (2024-2029)
Table 48. Global Ultra High Molecular Weight Polyethylene (UHMWPE) Ropes Sales by Application: 2018 VS 2022 VS 2029 (US$ Million)
Table 49. Global Ultra High Molecular Weight Polyethylene (UHMWPE) Ropes Sales by Application (2018-2023) & (K MT)
Table 50. Global Ultra High Molecular Weight Polyethylene (UHMWPE) Ropes Sales Market Share in Volume by Application (2018-2023)
Table 51. Global Ultra High Molecular Weight Polyethylene (UHMWPE) Ropes Sales by Application (2018-2023) & (US$ Million)
Table 52. Global Ultra High Molecular Weight Polyethylene (UHMWPE) Ropes Sales Market Share in Value by Application (2018-2023)
Table 53. Global Ultra High Molecular Weight Polyethylene (UHMWPE) Ropes Price by Application (2018-2023) & (USD/MT)
Table 54. Global Ultra High Molecular Weight Polyethylene (UHMWPE) Ropes Sales by Application (2024-2029) & (K MT)
Table 55. Global Ultra High Molecular Weight Polyethylene (UHMWPE) Ropes Sales Market Share in Volume by Application (2024-2029)
Table 56. Global Ultra High Molecular Weight Polyethylene (UHMWPE) Ropes Sales by Application (2024-2029) & (US$ Million)
Table 57. Global Ultra High Molecular Weight Polyethylene (UHMWPE) Ropes Sales Market Share in Value by Application (2024-2029)
Table 58. Global Ultra High Molecular Weight Polyethylene (UHMWPE) Ropes Price by Application (2024-2029) & (USD/MT)
Table 59. North America Ultra High Molecular Weight Polyethylene (UHMWPE) Ropes Sales by Application (2018-2023) (K MT)
Table 60. North America Ultra High Molecular Weight Polyethylene (UHMWPE) Ropes Sales by Application (2018-2023) & (US$ Million)
Table 61. Europe Ultra High Molecular Weight Polyethylene (UHMWPE) Ropes Sales by Application (2018-2023) (K MT)
Table 62. Europe Ultra High Molecular Weight Polyethylene (UHMWPE) Ropes Sales by Application (2018-2023) & (US$ Million)
Table 63. Asia-Pacific Ultra High Molecular Weight Polyethylene (UHMWPE) Ropes Sales by Application (2018-2023) (K MT)
Table 64. Asia-Pacific Ultra High Molecular Weight Polyethylene (UHMWPE) Ropes Sales by Application (2018-2023) & (US$ Million)
Table 65. Latin America Ultra High Molecular Weight Polyethylene (UHMWPE) Ropes Sales by Application (2018-2023) (K MT)
Table 66. Latin America Ultra High Molecular Weight Polyethylene (UHMWPE) Ropes Sales by Application (2018-2023) & (US$ Million)
Table 67. Middle East and Africa Ultra High Molecular Weight Polyethylene (UHMWPE) Ropes Sales by Application (2018-2023) (K MT)
Table 68. Middle East and Africa Ultra High Molecular Weight Polyethylene (UHMWPE) Ropes Sales by Application (2018-2023) & (US$ Million)
Table 69. North America Ultra High Molecular Weight Polyethylene (UHMWPE) Ropes Sales by Country (2018-2023) & (K MT)
Table 70. North America Ultra High Molecular Weight Polyethylene (UHMWPE) Ropes Sales Market Share in Volume by Country (2018-2023)
Table 71. North America Ultra High Molecular Weight Polyethylene (UHMWPE) Ropes Sales by Country (2018-2023) & (US$ Million)
Table 72. North America Ultra High Molecular Weight Polyethylene (UHMWPE) Ropes Sales Market Share in Value by Country (2018-2023)
Table 73. North America Ultra High Molecular Weight Polyethylene (UHMWPE) Ropes Sales by Country (2024-2029) & (K MT)
Table 74. North America Ultra High Molecular Weight Polyethylene (UHMWPE) Ropes Sales Market Share in Volume by Country (2024-2029)
Table 75. North America Ultra High Molecular Weight Polyethylene (UHMWPE) Ropes Sales by Country (2024-2029) & (US$ Million)
Table 76. North America Ultra High Molecular Weight Polyethylene (UHMWPE) Ropes Sales Market Share in Value by Country (2024-2029)
Table 77. Europe Ultra High Molecular Weight Polyethylene (UHMWPE) Ropes Sales by Country (2018-2023) & (K MT)
Table 78. Europe Ultra High Molecular Weight Polyethylene (UHMWPE) Ropes Sales Market Share in Volume by Country (2018-2023)
Table 79. Europe Ultra High Molecular Weight Polyethylene (UHMWPE) Ropes Sales by Country (2018-2023) & (US$ Million)
Table 80. Europe Ultra High Molecular Weight Polyethylene (UHMWPE) Ropes Sales Market Share in Value by Country (2018-2023)
Table 81. Europe Ultra High Molecular Weight Polyethylene (UHMWPE) Ropes Sales by Country (2024-2029) & (K MT)
Table 82. Europe Ultra High Molecular Weight Polyethylene (UHMWPE) Ropes Sales Market Share in Volume by Country (2024-2029)
Table 83. Europe Ultra High Molecular Weight Polyethylene (UHMWPE) Ropes Sales by Country (2024-2029) & (US$ Million)
Table 84. Europe Ultra High Molecular Weight Polyethylene (UHMWPE) Ropes Sales Market Share in Value by Country (2024-2029)
Table 85. Asia-Pacific Ultra High Molecular Weight Polyethylene (UHMWPE) Ropes Sales by Region (2018-2023) & (K MT)
Table 86. Asia-Pacific Ultra High Molecular Weight Polyethylene (UHMWPE) Ropes Sales Market Share in Volume by Region (2018-2023)
Table 87. Asia-Pacific Ultra High Molecular Weight Polyethylene (UHMWPE) Ropes Sales by Region (2018-2023) & (US$ Million)
Table 88. Asia-Pacific Ultra High Molecular Weight Polyethylene (UHMWPE) Ropes Sales Market Share in Value by Region (2018-2023)
Table 89. Asia-Pacific Ultra High Molecular Weight Polyethylene (UHMWPE) Ropes Sales by Region (2024-2029) & (K MT)
Table 90. Asia-Pacific Ultra High Molecular Weight Polyethylene (UHMWPE) Ropes Sales Market Share in Volume by Region (2024-2029)
Table 91. Asia-Pacific Ultra High Molecular Weight Polyethylene (UHMWPE) Ropes Sales by Region (2024-2029) & (US$ Million)
Table 92. Asia-Pacific Ultra High Molecular Weight Polyethylene (UHMWPE) Ropes Sales Market Share in Value by Region (2024-2029)
Table 93. Latin America Ultra High Molecular Weight Polyethylene (UHMWPE) Ropes Sales by Country (2018-2023) & (K MT)
Table 94. Latin America Ultra High Molecular Weight Polyethylene (UHMWPE) Ropes Sales Market Share in Volume by Country (2018-2023)
Table 95. Latin America Ultra High Molecular Weight Polyethylene (UHMWPE) Ropes Sales by Country (2018-2023) & (US$ Million)
Table 96. Latin America Ultra High Molecular Weight Polyethylene (UHMWPE) Ropes Sales Market Share in Value by Country (2018-2023)
Table 97. Latin America Ultra High Molecular Weight Polyethylene (UHMWPE) Ropes Sales by Country (2024-2029) & (K MT)
Table 98. Latin America Ultra High Molecular Weight Polyethylene (UHMWPE) Ropes Sales Market Share in Volume by Country (2024-2029)
Table 99. Latin America Ultra High Molecular Weight Polyethylene (UHMWPE) Ropes Sales by Country (2024-2029) & (US$ Million)
Table 100. Latin America Ultra High Molecular Weight Polyethylene (UHMWPE) Ropes Sales Market Share in Value by Country (2024-2029)
Table 101. Middle East and Africa Ultra High Molecular Weight Polyethylene (UHMWPE) Ropes Sales by Country (2018-2023) & (K MT)
Table 102. Middle East and Africa Ultra High Molecular Weight Polyethylene (UHMWPE) Ropes Sales Market Share in Volume by Country (2018-2023)
Table 103. Middle East and Africa Ultra High Molecular Weight Polyethylene (UHMWPE) Ropes Sales by Country (2018-2023) & (US$ Million)
Table 104. Middle East and Africa Ultra High Molecular Weight Polyethylene (UHMWPE) Ropes Sales Market Share in Value by Country (2018-2023)
Table 105. Middle East and Africa Ultra High Molecular Weight Polyethylene (UHMWPE) Ropes Sales by Country (2024-2029) & (K MT)
Table 106. Middle East and Africa Ultra High Molecular Weight Polyethylene (UHMWPE) Ropes Sales Market Share in Volume by Country (2024-2029)
Table 107. Middle East and Africa Ultra High Molecular Weight Polyethylene (UHMWPE) Ropes Sales by Country (2024-2029) & (US$ Million)
Table 108. Middle East and Africa Ultra High Molecular Weight Polyethylene (UHMWPE) Ropes Sales Market Share in Value by Country (2024-2029)
Table 109. Lankhorst (WireCo) Company Information
Table 110. Lankhorst (WireCo) Introduction and Business Overview
Table 111. Lankhorst (WireCo) Ultra High Molecular Weight Polyethylene (UHMWPE) Ropes Sales (K MT), Revenue (Million USD), Price (USD/MT) and Gross Margin (2018-2023)
Table 112. Lankhorst (WireCo) Ultra High Molecular Weight Polyethylene (UHMWPE) Ropes Product
Table 113. Lankhorst (WireCo) Recent Development
Table 114. Samson Company Information
Table 115. Samson Introduction and Business Overview
Table 116. Samson Ultra High Molecular Weight Polyethylene (UHMWPE) Ropes Sales (K MT), Revenue (Million USD), Price (USD/MT) and Gross Margin (2018-2023)
Table 117. Samson Ultra High Molecular Weight Polyethylene (UHMWPE) Ropes Product
Table 118. Samson Recent Development
Table 119. Bridon Company Information
Table 120. Bridon Introduction and Business Overview
Table 121. Bridon Ultra High Molecular Weight Polyethylene (UHMWPE) Ropes Sales (K MT), Revenue (Million USD), Price (USD/MT) and Gross Margin (2018-2023)
Table 122. Bridon Ultra High Molecular Weight Polyethylene (UHMWPE) Ropes Product
Table 123. Bridon Recent Development
Table 124. English Braids Company Information
Table 125. English Braids Introduction and Business Overview
Table 126. English Braids Ultra High Molecular Weight Polyethylene (UHMWPE) Ropes Sales (K MT), Revenue (Million USD), Price (USD/MT) and Gross Margin (2018-2023)
Table 127. English Braids Ultra High Molecular Weight Polyethylene (UHMWPE) Ropes Product
Table 128. English Braids Recent Development
Table 129. Marlow Ropes Company Information
Table 130. Marlow Ropes Introduction and Business Overview
Table 131. Marlow Ropes Ultra High Molecular Weight Polyethylene (UHMWPE) Ropes Sales (K MT), Revenue (Million USD), Price (USD/MT) and Gross Margin (2018-2023)
Table 132. Marlow Ropes Ultra High Molecular Weight Polyethylene (UHMWPE) Ropes Product
Table 133. Marlow Ropes Recent Development
Table 134. Katradis Company Information
Table 135. Katradis Introduction and Business Overview
Table 136. Katradis Ultra High Molecular Weight Polyethylene (UHMWPE) Ropes Sales (K MT), Revenue (Million USD), Price (USD/MT) and Gross Margin (2018-2023)
Table 137. Katradis Ultra High Molecular Weight Polyethylene (UHMWPE) Ropes Product
Table 138. Katradis Recent Development
Table 139. Southern Ropes Company Information
Table 140. Southern Ropes Introduction and Business Overview
Table 141. Southern Ropes Ultra High Molecular Weight Polyethylene (UHMWPE) Ropes Sales (K MT), Revenue (Million USD), Price (USD/MT) and Gross Margin (2018-2023)
Table 142. Southern Ropes Ultra High Molecular Weight Polyethylene (UHMWPE) Ropes Product
Table 143. Southern Ropes Recent Development
Table 144. Taizhou Hongda Company Information
Table 145. Taizhou Hongda Introduction and Business Overview
Table 146. Taizhou Hongda Ultra High Molecular Weight Polyethylene (UHMWPE) Ropes Sales (K MT), Revenue (Million USD), Price (USD/MT) and Gross Margin (2018-2023)
Table 147. Taizhou Hongda Ultra High Molecular Weight Polyethylene (UHMWPE) Ropes Product
Table 148. Taizhou Hongda Recent Development
Table 149. Jiangsu Shenyun Company Information
Table 150. Jiangsu Shenyun Introduction and Business Overview
Table 151. Jiangsu Shenyun Ultra High Molecular Weight Polyethylene (UHMWPE) Ropes Sales (K MT), Revenue (Million USD), Price (USD/MT) and Gross Margin (2018-2023)
Table 152. Jiangsu Shenyun Ultra High Molecular Weight Polyethylene (UHMWPE) Ropes Product
Table 153. Jiangsu Shenyun Recent Development
Table 154. Hunan Zhongtai Company Information
Table 155. Hunan Zhongtai Introduction and Business Overview
Table 156. Hunan Zhongtai Ultra High Molecular Weight Polyethylene (UHMWPE) Ropes Sales (K MT), Revenue (Million USD), Price (USD/MT) and Gross Margin (2018-2023)
Table 157. Hunan Zhongtai Ultra High Molecular Weight Polyethylene (UHMWPE) Ropes Product
Table 158. Hunan Zhongtai Recent Development
Table 159. Ningbo Dacheng Company Information
Table 160. Ningbo Dacheng Introduction and Business Overview
Table 161. Ningbo Dacheng Ultra High Molecular Weight Polyethylene (UHMWPE) Ropes Sales (K MT), Revenue (Million USD), Price (USD/MT) and Gross Margin (2018-2023)
Table 162. Ningbo Dacheng Ultra High Molecular Weight Polyethylene (UHMWPE) Ropes Product
Table 163. Ningbo Dacheng Recent Development
Table 164. Rope Technology Company Information
Table 165. Rope Technology Introduction and Business Overview
Table 166. Rope Technology Ultra High Molecular Weight Polyethylene (UHMWPE) Ropes Sales (K MT), Revenue (Million USD), Price (USD/MT) and Gross Margin (2018-2023)
Table 167. Rope Technology Ultra High Molecular Weight Polyethylene (UHMWPE) Ropes Product
Table 168. Rope Technology Recent Development
Table 169. Juli Sling Company Information
Table 170. Juli Sling Introduction and Business Overview
Table 171. Juli Sling Ultra High Molecular Weight Polyethylene (UHMWPE) Ropes Sales (K MT), Revenue (Million USD), Price (USD/MT) and Gross Margin (2018-2023)
Table 172. Juli Sling Ultra High Molecular Weight Polyethylene (UHMWPE) Ropes Product
Table 173. Juli Sling Recent Development
Table 174. Key Raw Materials Lists
Table 175. Raw Materials Key Suppliers Lists
Table 176. Ultra High Molecular Weight Polyethylene (UHMWPE) Ropes Market Trends
Table 177. Ultra High Molecular Weight Polyethylene (UHMWPE) Ropes Market Drivers
Table 178. Ultra High Molecular Weight Polyethylene (UHMWPE) Ropes Market Challenges
Table 179. Ultra High Molecular Weight Polyethylene (UHMWPE) Ropes Market Restraints
Table 180. Ultra High Molecular Weight Polyethylene (UHMWPE) Ropes Distributors List
Table 181. Ultra High Molecular Weight Polyethylene (UHMWPE) Ropes Downstream Customers
Table 182. Research Programs/Design for This Report
Table 183. Key Data Information from Secondary Sources
Table 184. Key Data Information from Primary Sources
List of Figures
Figure 1. Ultra High Molecular Weight Polyethylene (UHMWPE) Ropes Product Picture
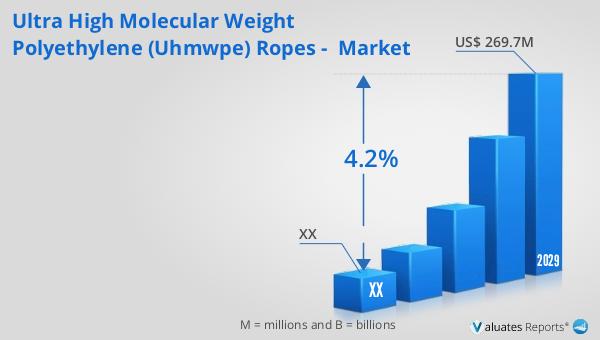
Figure 2. Global Ultra High Molecular Weight Polyethylene (UHMWPE) Ropes Market Size, 2018 VS 2022 VS 2029 (US$ Million)
Figure 3. Global Ultra High Molecular Weight Polyethylene (UHMWPE) Ropes Market Size Status and Outlook (2018-2029) & (US$ Million)
Figure 4. Global Ultra High Molecular Weight Polyethylene (UHMWPE) Ropes Sales Status and Outlook (2018-2029) & (K MT)
Figure 5. Product Picture of 3 Strand
Figure 6. Global 3 Strand Sales YoY Growth (2018-2029) & (K MT)
Figure 7. Product Picture of 8 Strand
Figure 8. Global 8 Strand Sales YoY Growth (2018-2029) & (K MT)
Figure 9. Product Picture of 12 Strand
Figure 10. Global 12 Strand Sales YoY Growth (2018-2029) & (K MT)
Figure 11. Product Picture of Others
Figure 12. Global Others Sales YoY Growth (2018-2029) & (K MT)
Figure 13. Global Ultra High Molecular Weight Polyethylene (UHMWPE) Ropes Sales by Type (2018-2029) & (US$ Million)
Figure 14. Global Ultra High Molecular Weight Polyethylene (UHMWPE) Ropes Sales Market Share by Type in 2022 & 2029
Figure 15. North America Ultra High Molecular Weight Polyethylene (UHMWPE) Ropes Sales Market Share in Volume by Type in 2022
Figure 16. North America Ultra High Molecular Weight Polyethylene (UHMWPE) Ropes Sales Market Share in Value by Type in 2022
Figure 17. Europe Ultra High Molecular Weight Polyethylene (UHMWPE) Ropes Sales Market Share in Volume by Type in 2022
Figure 18. Europe Ultra High Molecular Weight Polyethylene (UHMWPE) Ropes Sales Market Share in Value by Type in 2022
Figure 19. Asia-Pacific Ultra High Molecular Weight Polyethylene (UHMWPE) Ropes Sales Market Share in Volume by Type in 2022
Figure 20. Asia-Pacific Ultra High Molecular Weight Polyethylene (UHMWPE) Ropes Sales Market Share in Value by Type in 2022
Figure 21. Latin America Ultra High Molecular Weight Polyethylene (UHMWPE) Ropes Sales Market Share in Volume by Type in 2022
Figure 22. Latin America Ultra High Molecular Weight Polyethylene (UHMWPE) Ropes Sales Market Share in Value by Type in 2022
Figure 23. Middle East and Africa Ultra High Molecular Weight Polyethylene (UHMWPE) Ropes Sales Market Share in Volume by Type in 2022
Figure 24. Middle East and Africa Ultra High Molecular Weight Polyethylene (UHMWPE) Ropes Sales Market Share in Value by Type in 2022
Figure 25. The 5 and 10 Largest Manufacturers in the World: Market Share by Ultra High Molecular Weight Polyethylene (UHMWPE) Ropes Sales in 2022
Figure 26. The 5 and 10 Largest Manufacturers in the World: Market Share by Ultra High Molecular Weight Polyethylene (UHMWPE) Ropes Revenue in 2022
Figure 27. Ultra High Molecular Weight Polyethylene (UHMWPE) Ropes Market Share by Company Type (Tier 1, Tier 2, and Tier 3): 2018 VS 2022
Figure 28. Product Picture of Aviation and Military
Figure 29. Global Aviation and Military Sales YoY Growth (2018-2029) & (K MT)
Figure 30. Product Picture of Industrial
Figure 31. Global Industrial Sales YoY Growth (2018-2029) & (K MT)
Figure 32. Product Picture of Ocean
Figure 33. Global Ocean Sales YoY Growth (2018-2029) & (K MT)
Figure 34. Product Picture of Leisure
Figure 35. Global Leisure Sales YoY Growth (2018-2029) & (K MT)
Figure 36. Product Picture of Others
Figure 37. Global Others Sales YoY Growth (2018-2029) & (K MT)
Figure 38. Global Ultra High Molecular Weight Polyethylene (UHMWPE) Ropes Sales by Application (2018-2029) & (US$ Million)
Figure 39. Global Ultra High Molecular Weight Polyethylene (UHMWPE) Ropes Sales Market Share by Application in 2022 & 2029
Figure 40. North America Ultra High Molecular Weight Polyethylene (UHMWPE) Ropes Sales Market Share in Volume by Application in 2022
Figure 41. North America Ultra High Molecular Weight Polyethylene (UHMWPE) Ropes Sales Market Share in Value by Application in 2022
Figure 42. Europe Ultra High Molecular Weight Polyethylene (UHMWPE) Ropes Sales Market Share in Volume by Application in 2022
Figure 43. Europe Ultra High Molecular Weight Polyethylene (UHMWPE) Ropes Sales Market Share in Value by Application in 2022
Figure 44. Asia-Pacific Ultra High Molecular Weight Polyethylene (UHMWPE) Ropes Sales Market Share in Volume by Application in 2022
Figure 45. Asia-Pacific Ultra High Molecular Weight Polyethylene (UHMWPE) Ropes Sales Market Share in Value by Application in 2022
Figure 46. Latin America Ultra High Molecular Weight Polyethylene (UHMWPE) Ropes Sales Market Share in Volume by Application in 2022
Figure 47. Latin America Ultra High Molecular Weight Polyethylene (UHMWPE) Ropes Sales Market Share in Value by Application in 2022
Figure 48. Middle East and Africa Ultra High Molecular Weight Polyethylene (UHMWPE) Ropes Sales Market Share in Value by Application in 2022
Figure 49. Key Raw Materials Price
Figure 50. Ultra High Molecular Weight Polyethylene (UHMWPE) Ropes Manufacturing Cost Structure
Figure 51. Ultra High Molecular Weight Polyethylene (UHMWPE) Ropes Industrial Chain Analysis
Figure 52. Channels of Distribution
Figure 53. Distributors Profiles
Figure 54. Bottom-up and Top-down Approaches for This Report
Figure 55. Data Triangulation
Figure 56. Key Executives Interviewed