0
U.S. (TOLL FREE)
+1 (315) 215-3225
Automative

0
U.S. (TOLL FREE)
+1 (315) 215-3225
Global Clinical Oncology Next Generation Sequencing (NGS) Market Research Report 2024
Published Date: January 2024
|
Report Code: QYRE-Auto-26P6039
Home | Market Reports | Business & Industrial| Pharmaceuticals & Biotech
Global Clinical Oncology Next Generation Sequencing NGS Market Insights Forecast to 2028
BUY CHAPTERS

Global Clinical Oncology Next Generation Sequencing (NGS) Market Research Report 2024

Code: QYRE-Auto-26P6039
Report
January 2024
Pages:108
QYResearch
Buy Now with 15% Discount
DESCRIPTION
TABLE OF CONTENT
TABLES & FIGURES

Clinical Oncology Next Generation Sequencing (NGS) Market Size

The global Clinical Oncology Next Generation Sequencing (NGS) market was valued at US$ 704.7 million in 2023 and is anticipated to reach US$ 1429.7 million by 2030, witnessing a CAGR of 10.6% during the forecast period 2024-2030.

Clinical Oncology Next Generation Sequencing (NGS) Market

Clinical Oncology Next Generation Sequencing (NGS) Market

NGS allows the testing of all types of variants including single-nucleotide variations, insertions, deletions, exon duplications, gene copy number changes and translocations.
The key factor contributing to the growth of the NGS market is the improved understanding of the genetic markers of virulence and resistance.
This report aims to provide a comprehensive presentation of the global market for Clinical Oncology Next Generation Sequencing (NGS), with both quantitative and qualitative analysis, to help readers develop business/growth strategies, assess the market competitive situation, analyze their position in the current marketplace, and make informed business decisions regarding Clinical Oncology Next Generation Sequencing (NGS).

Report Scope

The Clinical Oncology Next Generation Sequencing (NGS) market size, estimations, and forecasts are provided in terms of revenue ($ millions), considering 2023 as the base year, with history and forecast data for the period from 2019 to 2030. This report segments the global Clinical Oncology Next Generation Sequencing (NGS) market comprehensively. Regional market sizes, concerning products by Type, by Application, and by players, are also provided.
For a more in-depth understanding of the market, the report provides profiles of the competitive landscape, key competitors, and their respective market ranks. The report also discusses technological trends and new product developments.
The report will help the Clinical Oncology Next Generation Sequencing (NGS) companies, new entrants, and industry chain related companies in this market with information on the revenues, sales volume, and average price for the overall market and the sub-segments across the different segments, by company, by Type, by Application, and by regions.
Market Segmentation

Scope of Clinical Oncology Next Generation Sequencing (NGS) Market Report

Report Metric Details
Report Name Clinical Oncology Next Generation Sequencing (NGS) Market
Accounted market size in 2023 US$ 704.7 million
Forecasted market size in 2030 US$ 1429.7 million
CAGR 10.6%
Base Year 2023
Forecasted years 2024 - 2030
Segment by Type
  • NGS Pre-Sequencing
  • Sequencing
  • NGS Data Analysis
  • Primary, Secondary & Tertiary Data Analysis
Segment by Application
  • Academic & Clinical Research
  • Hospitals & Clinics
  • Pharma & Biotech Entities
By Region
  • North America (United States, Canada)
  • Europe (Germany, France, UK, Italy, Russia) Rest of Europe
  • Nordic Countries
  • Asia-Pacific (China, Japan, South Korea)
  • Southeast Asia (India, Australia)
  • Rest of Asia
  • Latin America (Mexico, Brazil)
  • Rest of Latin America
  • Middle East & Africa (Turkey, Saudi Arabia, UAE, Rest of MEA)
By Company Illumina, Roche, Agilent Technologies, Knome, Genomatix Software, GATC Biotech, Oxford Nanopore Technologies, Macrogen, Life Technologies, DNASTAR, Exosome Diagnostics, Biomatters, CLC Bio, BGI, Qiagen, Perkin Elmer, Pacific Bioscience, Partek, GnuBIO, Foundation Medicine, Paradigm, Caris Life Sciences, Myriad Genetics
Forecast units USD million in value
Report coverage Revenue and volume forecast, company share, competitive landscape, growth factors and trends

Chapter Outline

  • Chapter 1: Introduces the report scope of the report, executive summary of different market segments (by Type, by Application, etc), including the market size of each market segment, future development potential, and so on. It offers a high-level view of the current state of the market and its likely evolution in the short to mid-term, and long term.
  • Chapter 2: Introduces executive summary of global market size, regional market size, this section also introduces the market dynamics, latest developments of the market, the driving factors and restrictive factors of the market, the challenges and risks faced by companies in the industry, and the analysis of relevant policies in the industry.
  • Chapter 3: Detailed analysis of Clinical Oncology Next Generation Sequencing (NGS) companies’ competitive landscape, revenue market share, latest development plan, merger, and acquisition information, etc.
  • Chapter 4: Provides the analysis of various market segments by Type, covering the market size and development potential of each market segment, to help readers find the blue ocean market in different market segments.
  • Chapter 5: Provides the analysis of various market segments by Application, covering the market size and development potential of each market segment, to help readers find the blue ocean market in different downstream markets.
  • Chapter 6, 7, 8, 9, 10: North America, Europe, Asia Pacific, Latin America, Middle East and Africa segment by country. It provides a quantitative analysis of the market size and development potential of each region and its main countries and introduces the market development, future development prospects, market space, and capacity of each country in the world.
  • Chapter 11: Provides profiles of key players, introducing the basic situation of the main companies in the market in detail, including product sales, revenue, price, gross margin, product introduction, recent development, etc.
  • Chapter 12: The main points and conclusions of the report.

FAQ for this report

How fast is Clinical Oncology Next Generation Sequencing (NGS) Market growing?

Ans: The Clinical Oncology Next Generation Sequencing (NGS) Market witnessing a CAGR of 10.6% during the forecast period 2024-2030.

What is the Clinical Oncology Next Generation Sequencing (NGS) Market size in 2030?

Ans: The Clinical Oncology Next Generation Sequencing (NGS) Market size in 2030 will be US$ 1429.7 million.

Who are the main players in the Clinical Oncology Next Generation Sequencing (NGS) Market report?

Ans: The main players in the Clinical Oncology Next Generation Sequencing (NGS) Market are Illumina, Roche, Agilent Technologies, Knome, Genomatix Software, GATC Biotech, Oxford Nanopore Technologies, Macrogen, Life Technologies, DNASTAR, Exosome Diagnostics, Biomatters, CLC Bio, BGI, Qiagen, Perkin Elmer, Pacific Bioscience, Partek, GnuBIO, Foundation Medicine, Paradigm, Caris Life Sciences, Myriad Genetics

What are the Application segmentation covered in the Clinical Oncology Next Generation Sequencing (NGS) Market report?

Ans: The Applications covered in the Clinical Oncology Next Generation Sequencing (NGS) Market report are Academic & Clinical Research, Hospitals & Clinics, Pharma & Biotech Entities

What are the Type segmentation covered in the Clinical Oncology Next Generation Sequencing (NGS) Market report?

Ans: The Types covered in the Clinical Oncology Next Generation Sequencing (NGS) Market report are NGS Pre-Sequencing, Sequencing, NGS Data Analysis, Primary, Secondary & Tertiary Data Analysis

1 Report Overview
1.1 Study Scope
1.2 Market Analysis by Type
1.2.1 Global Clinical Oncology Next Generation Sequencing (NGS) Market Size Growth Rate by Type: 2019 VS 2023 VS 2030
1.2.2 NGS Pre-Sequencing
1.2.3 Sequencing
1.2.4 NGS Data Analysis
1.2.5 Primary, Secondary & Tertiary Data Analysis
1.3 Market by Application
1.3.1 Global Clinical Oncology Next Generation Sequencing (NGS) Market Growth by Application: 2019 VS 2023 VS 2030
1.3.2 Academic & Clinical Research
1.3.3 Hospitals & Clinics
1.3.4 Pharma & Biotech Entities
1.4 Study Objectives
1.5 Years Considered
1.6 Years Considered
2 Global Growth Trends
2.1 Global Clinical Oncology Next Generation Sequencing (NGS) Market Perspective (2019-2030)
2.2 Clinical Oncology Next Generation Sequencing (NGS) Growth Trends by Region
2.2.1 Global Clinical Oncology Next Generation Sequencing (NGS) Market Size by Region: 2019 VS 2023 VS 2030
2.2.2 Clinical Oncology Next Generation Sequencing (NGS) Historic Market Size by Region (2019-2024)
2.2.3 Clinical Oncology Next Generation Sequencing (NGS) Forecasted Market Size by Region (2025-2030)
2.3 Clinical Oncology Next Generation Sequencing (NGS) Market Dynamics
2.3.1 Clinical Oncology Next Generation Sequencing (NGS) Industry Trends
2.3.2 Clinical Oncology Next Generation Sequencing (NGS) Market Drivers
2.3.3 Clinical Oncology Next Generation Sequencing (NGS) Market Challenges
2.3.4 Clinical Oncology Next Generation Sequencing (NGS) Market Restraints
3 Competition Landscape by Key Players
3.1 Global Top Clinical Oncology Next Generation Sequencing (NGS) Players by Revenue
3.1.1 Global Top Clinical Oncology Next Generation Sequencing (NGS) Players by Revenue (2019-2024)
3.1.2 Global Clinical Oncology Next Generation Sequencing (NGS) Revenue Market Share by Players (2019-2024)
3.2 Global Clinical Oncology Next Generation Sequencing (NGS) Market Share by Company Type (Tier 1, Tier 2, and Tier 3)
3.3 Players Covered: Ranking by Clinical Oncology Next Generation Sequencing (NGS) Revenue
3.4 Global Clinical Oncology Next Generation Sequencing (NGS) Market Concentration Ratio
3.4.1 Global Clinical Oncology Next Generation Sequencing (NGS) Market Concentration Ratio (CR5 and HHI)
3.4.2 Global Top 10 and Top 5 Companies by Clinical Oncology Next Generation Sequencing (NGS) Revenue in 2023
3.5 Clinical Oncology Next Generation Sequencing (NGS) Key Players Head office and Area Served
3.6 Key Players Clinical Oncology Next Generation Sequencing (NGS) Product Solution and Service
3.7 Date of Enter into Clinical Oncology Next Generation Sequencing (NGS) Market
3.8 Mergers & Acquisitions, Expansion Plans
4 Clinical Oncology Next Generation Sequencing (NGS) Breakdown Data by Type
4.1 Global Clinical Oncology Next Generation Sequencing (NGS) Historic Market Size by Type (2019-2024)
4.2 Global Clinical Oncology Next Generation Sequencing (NGS) Forecasted Market Size by Type (2025-2030)
5 Clinical Oncology Next Generation Sequencing (NGS) Breakdown Data by Application
5.1 Global Clinical Oncology Next Generation Sequencing (NGS) Historic Market Size by Application (2019-2024)
5.2 Global Clinical Oncology Next Generation Sequencing (NGS) Forecasted Market Size by Application (2025-2030)
6 North America
6.1 North America Clinical Oncology Next Generation Sequencing (NGS) Market Size (2019-2030)
6.2 North America Clinical Oncology Next Generation Sequencing (NGS) Market Growth Rate by Country: 2019 VS 2023 VS 2030
6.3 North America Clinical Oncology Next Generation Sequencing (NGS) Market Size by Country (2019-2024)
6.4 North America Clinical Oncology Next Generation Sequencing (NGS) Market Size by Country (2025-2030)
6.5 United States
6.6 Canada
7 Europe
7.1 Europe Clinical Oncology Next Generation Sequencing (NGS) Market Size (2019-2030)
7.2 Europe Clinical Oncology Next Generation Sequencing (NGS) Market Growth Rate by Country: 2019 VS 2023 VS 2030
7.3 Europe Clinical Oncology Next Generation Sequencing (NGS) Market Size by Country (2019-2024)
7.4 Europe Clinical Oncology Next Generation Sequencing (NGS) Market Size by Country (2025-2030)
7.5 Germany
7.6 France
7.7 U.K.
7.8 Italy
7.9 Russia
7.10 Nordic Countries
8 Asia-Pacific
8.1 Asia-Pacific Clinical Oncology Next Generation Sequencing (NGS) Market Size (2019-2030)
8.2 Asia-Pacific Clinical Oncology Next Generation Sequencing (NGS) Market Growth Rate by Region: 2019 VS 2023 VS 2030
8.3 Asia-Pacific Clinical Oncology Next Generation Sequencing (NGS) Market Size by Region (2019-2024)
8.4 Asia-Pacific Clinical Oncology Next Generation Sequencing (NGS) Market Size by Region (2025-2030)
8.5 China
8.6 Japan
8.7 South Korea
8.8 Southeast Asia
8.9 India
8.10 Australia
9 Latin America
9.1 Latin America Clinical Oncology Next Generation Sequencing (NGS) Market Size (2019-2030)
9.2 Latin America Clinical Oncology Next Generation Sequencing (NGS) Market Growth Rate by Country: 2019 VS 2023 VS 2030
9.3 Latin America Clinical Oncology Next Generation Sequencing (NGS) Market Size by Country (2019-2024)
9.4 Latin America Clinical Oncology Next Generation Sequencing (NGS) Market Size by Country (2025-2030)
9.5 Mexico
9.6 Brazil
10 Middle East & Africa
10.1 Middle East & Africa Clinical Oncology Next Generation Sequencing (NGS) Market Size (2019-2030)
10.2 Middle East & Africa Clinical Oncology Next Generation Sequencing (NGS) Market Growth Rate by Country: 2019 VS 2023 VS 2030
10.3 Middle East & Africa Clinical Oncology Next Generation Sequencing (NGS) Market Size by Country (2019-2024)
10.4 Middle East & Africa Clinical Oncology Next Generation Sequencing (NGS) Market Size by Country (2025-2030)
10.5 Turkey
10.6 Saudi Arabia
10.7 UAE
11 Key Players Profiles
11.1 Illumina
11.1.1 Illumina Company Detail
11.1.2 Illumina Business Overview
11.1.3 Illumina Clinical Oncology Next Generation Sequencing (NGS) Introduction
11.1.4 Illumina Revenue in Clinical Oncology Next Generation Sequencing (NGS) Business (2019-2024)
11.1.5 Illumina Recent Development
11.2 Roche
11.2.1 Roche Company Detail
11.2.2 Roche Business Overview
11.2.3 Roche Clinical Oncology Next Generation Sequencing (NGS) Introduction
11.2.4 Roche Revenue in Clinical Oncology Next Generation Sequencing (NGS) Business (2019-2024)
11.2.5 Roche Recent Development
11.3 Agilent Technologies
11.3.1 Agilent Technologies Company Detail
11.3.2 Agilent Technologies Business Overview
11.3.3 Agilent Technologies Clinical Oncology Next Generation Sequencing (NGS) Introduction
11.3.4 Agilent Technologies Revenue in Clinical Oncology Next Generation Sequencing (NGS) Business (2019-2024)
11.3.5 Agilent Technologies Recent Development
11.4 Knome
11.4.1 Knome Company Detail
11.4.2 Knome Business Overview
11.4.3 Knome Clinical Oncology Next Generation Sequencing (NGS) Introduction
11.4.4 Knome Revenue in Clinical Oncology Next Generation Sequencing (NGS) Business (2019-2024)
11.4.5 Knome Recent Development
11.5 Genomatix Software
11.5.1 Genomatix Software Company Detail
11.5.2 Genomatix Software Business Overview
11.5.3 Genomatix Software Clinical Oncology Next Generation Sequencing (NGS) Introduction
11.5.4 Genomatix Software Revenue in Clinical Oncology Next Generation Sequencing (NGS) Business (2019-2024)
11.5.5 Genomatix Software Recent Development
11.6 GATC Biotech
11.6.1 GATC Biotech Company Detail
11.6.2 GATC Biotech Business Overview
11.6.3 GATC Biotech Clinical Oncology Next Generation Sequencing (NGS) Introduction
11.6.4 GATC Biotech Revenue in Clinical Oncology Next Generation Sequencing (NGS) Business (2019-2024)
11.6.5 GATC Biotech Recent Development
11.7 Oxford Nanopore Technologies
11.7.1 Oxford Nanopore Technologies Company Detail
11.7.2 Oxford Nanopore Technologies Business Overview
11.7.3 Oxford Nanopore Technologies Clinical Oncology Next Generation Sequencing (NGS) Introduction
11.7.4 Oxford Nanopore Technologies Revenue in Clinical Oncology Next Generation Sequencing (NGS) Business (2019-2024)
11.7.5 Oxford Nanopore Technologies Recent Development
11.8 Macrogen
11.8.1 Macrogen Company Detail
11.8.2 Macrogen Business Overview
11.8.3 Macrogen Clinical Oncology Next Generation Sequencing (NGS) Introduction
11.8.4 Macrogen Revenue in Clinical Oncology Next Generation Sequencing (NGS) Business (2019-2024)
11.8.5 Macrogen Recent Development
11.9 Life Technologies
11.9.1 Life Technologies Company Detail
11.9.2 Life Technologies Business Overview
11.9.3 Life Technologies Clinical Oncology Next Generation Sequencing (NGS) Introduction
11.9.4 Life Technologies Revenue in Clinical Oncology Next Generation Sequencing (NGS) Business (2019-2024)
11.9.5 Life Technologies Recent Development
11.10 DNASTAR
11.10.1 DNASTAR Company Detail
11.10.2 DNASTAR Business Overview
11.10.3 DNASTAR Clinical Oncology Next Generation Sequencing (NGS) Introduction
11.10.4 DNASTAR Revenue in Clinical Oncology Next Generation Sequencing (NGS) Business (2019-2024)
11.10.5 DNASTAR Recent Development
11.11 Exosome Diagnostics
11.11.1 Exosome Diagnostics Company Detail
11.11.2 Exosome Diagnostics Business Overview
11.11.3 Exosome Diagnostics Clinical Oncology Next Generation Sequencing (NGS) Introduction
11.11.4 Exosome Diagnostics Revenue in Clinical Oncology Next Generation Sequencing (NGS) Business (2019-2024)
11.11.5 Exosome Diagnostics Recent Development
11.12 Biomatters
11.12.1 Biomatters Company Detail
11.12.2 Biomatters Business Overview
11.12.3 Biomatters Clinical Oncology Next Generation Sequencing (NGS) Introduction
11.12.4 Biomatters Revenue in Clinical Oncology Next Generation Sequencing (NGS) Business (2019-2024)
11.12.5 Biomatters Recent Development
11.13 CLC Bio
11.13.1 CLC Bio Company Detail
11.13.2 CLC Bio Business Overview
11.13.3 CLC Bio Clinical Oncology Next Generation Sequencing (NGS) Introduction
11.13.4 CLC Bio Revenue in Clinical Oncology Next Generation Sequencing (NGS) Business (2019-2024)
11.13.5 CLC Bio Recent Development
11.14 BGI
11.14.1 BGI Company Detail
11.14.2 BGI Business Overview
11.14.3 BGI Clinical Oncology Next Generation Sequencing (NGS) Introduction
11.14.4 BGI Revenue in Clinical Oncology Next Generation Sequencing (NGS) Business (2019-2024)
11.14.5 BGI Recent Development
11.15 Qiagen
11.15.1 Qiagen Company Detail
11.15.2 Qiagen Business Overview
11.15.3 Qiagen Clinical Oncology Next Generation Sequencing (NGS) Introduction
11.15.4 Qiagen Revenue in Clinical Oncology Next Generation Sequencing (NGS) Business (2019-2024)
11.15.5 Qiagen Recent Development
11.16 Perkin Elmer
11.16.1 Perkin Elmer Company Detail
11.16.2 Perkin Elmer Business Overview
11.16.3 Perkin Elmer Clinical Oncology Next Generation Sequencing (NGS) Introduction
11.16.4 Perkin Elmer Revenue in Clinical Oncology Next Generation Sequencing (NGS) Business (2019-2024)
11.16.5 Perkin Elmer Recent Development
11.17 Pacific Bioscience
11.17.1 Pacific Bioscience Company Detail
11.17.2 Pacific Bioscience Business Overview
11.17.3 Pacific Bioscience Clinical Oncology Next Generation Sequencing (NGS) Introduction
11.17.4 Pacific Bioscience Revenue in Clinical Oncology Next Generation Sequencing (NGS) Business (2019-2024)
11.17.5 Pacific Bioscience Recent Development
11.18 Partek
11.18.1 Partek Company Detail
11.18.2 Partek Business Overview
11.18.3 Partek Clinical Oncology Next Generation Sequencing (NGS) Introduction
11.18.4 Partek Revenue in Clinical Oncology Next Generation Sequencing (NGS) Business (2019-2024)
11.18.5 Partek Recent Development
11.19 GnuBIO
11.19.1 GnuBIO Company Detail
11.19.2 GnuBIO Business Overview
11.19.3 GnuBIO Clinical Oncology Next Generation Sequencing (NGS) Introduction
11.19.4 GnuBIO Revenue in Clinical Oncology Next Generation Sequencing (NGS) Business (2019-2024)
11.19.5 GnuBIO Recent Development
11.20 Foundation Medicine
11.20.1 Foundation Medicine Company Detail
11.20.2 Foundation Medicine Business Overview
11.20.3 Foundation Medicine Clinical Oncology Next Generation Sequencing (NGS) Introduction
11.20.4 Foundation Medicine Revenue in Clinical Oncology Next Generation Sequencing (NGS) Business (2019-2024)
11.20.5 Foundation Medicine Recent Development
11.21 Paradigm
11.21.1 Paradigm Company Detail
11.21.2 Paradigm Business Overview
11.21.3 Paradigm Clinical Oncology Next Generation Sequencing (NGS) Introduction
11.21.4 Paradigm Revenue in Clinical Oncology Next Generation Sequencing (NGS) Business (2019-2024)
11.21.5 Paradigm Recent Development
11.22 Caris Life Sciences
11.22.1 Caris Life Sciences Company Detail
11.22.2 Caris Life Sciences Business Overview
11.22.3 Caris Life Sciences Clinical Oncology Next Generation Sequencing (NGS) Introduction
11.22.4 Caris Life Sciences Revenue in Clinical Oncology Next Generation Sequencing (NGS) Business (2019-2024)
11.22.5 Caris Life Sciences Recent Development
11.23 Myriad Genetics
11.23.1 Myriad Genetics Company Detail
11.23.2 Myriad Genetics Business Overview
11.23.3 Myriad Genetics Clinical Oncology Next Generation Sequencing (NGS) Introduction
11.23.4 Myriad Genetics Revenue in Clinical Oncology Next Generation Sequencing (NGS) Business (2019-2024)
11.23.5 Myriad Genetics Recent Development
12 Analyst's Viewpoints/Conclusions
13 Appendix
13.1 Research Methodology
13.1.1 Methodology/Research Approach
13.1.2 Data Source
13.2 Disclaimer
13.3 Author Details
List of Tables
    Table 1. Global Clinical Oncology Next Generation Sequencing (NGS) Market Size Growth Rate by Type (US$ Million): 2019 VS 2023 VS 2030
    Table 2. Key Players of NGS Pre-Sequencing
    Table 3. Key Players of Sequencing
    Table 4. Key Players of NGS Data Analysis
    Table 5. Key Players of Primary, Secondary & Tertiary Data Analysis
    Table 6. Global Clinical Oncology Next Generation Sequencing (NGS) Market Size Growth by Application (US$ Million): 2019 VS 2023 VS 2030
    Table 7. Global Clinical Oncology Next Generation Sequencing (NGS) Market Size by Region (US$ Million): 2019 VS 2023 VS 2030
    Table 8. Global Clinical Oncology Next Generation Sequencing (NGS) Market Size by Region (2019-2024) & (US$ Million)
    Table 9. Global Clinical Oncology Next Generation Sequencing (NGS) Market Share by Region (2019-2024)
    Table 10. Global Clinical Oncology Next Generation Sequencing (NGS) Forecasted Market Size by Region (2025-2030) & (US$ Million)
    Table 11. Global Clinical Oncology Next Generation Sequencing (NGS) Market Share by Region (2025-2030)
    Table 12. Clinical Oncology Next Generation Sequencing (NGS) Market Trends
    Table 13. Clinical Oncology Next Generation Sequencing (NGS) Market Drivers
    Table 14. Clinical Oncology Next Generation Sequencing (NGS) Market Challenges
    Table 15. Clinical Oncology Next Generation Sequencing (NGS) Market Restraints
    Table 16. Global Clinical Oncology Next Generation Sequencing (NGS) Revenue by Players (2019-2024) & (US$ Million)
    Table 17. Global Clinical Oncology Next Generation Sequencing (NGS) Market Share by Players (2019-2024)
    Table 18. Global Top Clinical Oncology Next Generation Sequencing (NGS) Players by Company Type (Tier 1, Tier 2, and Tier 3) & (based on the Revenue in Clinical Oncology Next Generation Sequencing (NGS) as of 2023)
    Table 19. Ranking of Global Top Clinical Oncology Next Generation Sequencing (NGS) Companies by Revenue (US$ Million) in 2023
    Table 20. Global 5 Largest Players Market Share by Clinical Oncology Next Generation Sequencing (NGS) Revenue (CR5 and HHI) & (2019-2024)
    Table 21. Key Players Headquarters and Area Served
    Table 22. Key Players Clinical Oncology Next Generation Sequencing (NGS) Product Solution and Service
    Table 23. Date of Enter into Clinical Oncology Next Generation Sequencing (NGS) Market
    Table 24. Mergers & Acquisitions, Expansion Plans
    Table 25. Global Clinical Oncology Next Generation Sequencing (NGS) Market Size by Type (2019-2024) & (US$ Million)
    Table 26. Global Clinical Oncology Next Generation Sequencing (NGS) Revenue Market Share by Type (2019-2024)
    Table 27. Global Clinical Oncology Next Generation Sequencing (NGS) Forecasted Market Size by Type (2025-2030) & (US$ Million)
    Table 28. Global Clinical Oncology Next Generation Sequencing (NGS) Revenue Market Share by Type (2025-2030)
    Table 29. Global Clinical Oncology Next Generation Sequencing (NGS) Market Size by Application (2019-2024) & (US$ Million)
    Table 30. Global Clinical Oncology Next Generation Sequencing (NGS) Revenue Market Share by Application (2019-2024)
    Table 31. Global Clinical Oncology Next Generation Sequencing (NGS) Forecasted Market Size by Application (2025-2030) & (US$ Million)
    Table 32. Global Clinical Oncology Next Generation Sequencing (NGS) Revenue Market Share by Application (2025-2030)
    Table 33. North America Clinical Oncology Next Generation Sequencing (NGS) Market Size Growth Rate by Country (US$ Million): 2019 VS 2023 VS 2030
    Table 34. North America Clinical Oncology Next Generation Sequencing (NGS) Market Size by Country (2019-2024) & (US$ Million)
    Table 35. North America Clinical Oncology Next Generation Sequencing (NGS) Market Size by Country (2025-2030) & (US$ Million)
    Table 36. Europe Clinical Oncology Next Generation Sequencing (NGS) Market Size Growth Rate by Country (US$ Million): 2019 VS 2023 VS 2030
    Table 37. Europe Clinical Oncology Next Generation Sequencing (NGS) Market Size by Country (2019-2024) & (US$ Million)
    Table 38. Europe Clinical Oncology Next Generation Sequencing (NGS) Market Size by Country (2025-2030) & (US$ Million)
    Table 39. Asia-Pacific Clinical Oncology Next Generation Sequencing (NGS) Market Size Growth Rate by Region (US$ Million): 2019 VS 2023 VS 2030
    Table 40. Asia-Pacific Clinical Oncology Next Generation Sequencing (NGS) Market Size by Region (2019-2024) & (US$ Million)
    Table 41. Asia-Pacific Clinical Oncology Next Generation Sequencing (NGS) Market Size by Region (2025-2030) & (US$ Million)
    Table 42. Latin America Clinical Oncology Next Generation Sequencing (NGS) Market Size Growth Rate by Country (US$ Million): 2019 VS 2023 VS 2030
    Table 43. Latin America Clinical Oncology Next Generation Sequencing (NGS) Market Size by Country (2019-2024) & (US$ Million)
    Table 44. Latin America Clinical Oncology Next Generation Sequencing (NGS) Market Size by Country (2025-2030) & (US$ Million)
    Table 45. Middle East & Africa Clinical Oncology Next Generation Sequencing (NGS) Market Size Growth Rate by Country (US$ Million): 2019 VS 2023 VS 2030
    Table 46. Middle East & Africa Clinical Oncology Next Generation Sequencing (NGS) Market Size by Country (2019-2024) & (US$ Million)
    Table 47. Middle East & Africa Clinical Oncology Next Generation Sequencing (NGS) Market Size by Country (2025-2030) & (US$ Million)
    Table 48. Illumina Company Detail
    Table 49. Illumina Business Overview
    Table 50. Illumina Clinical Oncology Next Generation Sequencing (NGS) Product
    Table 51. Illumina Revenue in Clinical Oncology Next Generation Sequencing (NGS) Business (2019-2024) & (US$ Million)
    Table 52. Illumina Recent Development
    Table 53. Roche Company Detail
    Table 54. Roche Business Overview
    Table 55. Roche Clinical Oncology Next Generation Sequencing (NGS) Product
    Table 56. Roche Revenue in Clinical Oncology Next Generation Sequencing (NGS) Business (2019-2024) & (US$ Million)
    Table 57. Roche Recent Development
    Table 58. Agilent Technologies Company Detail
    Table 59. Agilent Technologies Business Overview
    Table 60. Agilent Technologies Clinical Oncology Next Generation Sequencing (NGS) Product
    Table 61. Agilent Technologies Revenue in Clinical Oncology Next Generation Sequencing (NGS) Business (2019-2024) & (US$ Million)
    Table 62. Agilent Technologies Recent Development
    Table 63. Knome Company Detail
    Table 64. Knome Business Overview
    Table 65. Knome Clinical Oncology Next Generation Sequencing (NGS) Product
    Table 66. Knome Revenue in Clinical Oncology Next Generation Sequencing (NGS) Business (2019-2024) & (US$ Million)
    Table 67. Knome Recent Development
    Table 68. Genomatix Software Company Detail
    Table 69. Genomatix Software Business Overview
    Table 70. Genomatix Software Clinical Oncology Next Generation Sequencing (NGS) Product
    Table 71. Genomatix Software Revenue in Clinical Oncology Next Generation Sequencing (NGS) Business (2019-2024) & (US$ Million)
    Table 72. Genomatix Software Recent Development
    Table 73. GATC Biotech Company Detail
    Table 74. GATC Biotech Business Overview
    Table 75. GATC Biotech Clinical Oncology Next Generation Sequencing (NGS) Product
    Table 76. GATC Biotech Revenue in Clinical Oncology Next Generation Sequencing (NGS) Business (2019-2024) & (US$ Million)
    Table 77. GATC Biotech Recent Development
    Table 78. Oxford Nanopore Technologies Company Detail
    Table 79. Oxford Nanopore Technologies Business Overview
    Table 80. Oxford Nanopore Technologies Clinical Oncology Next Generation Sequencing (NGS) Product
    Table 81. Oxford Nanopore Technologies Revenue in Clinical Oncology Next Generation Sequencing (NGS) Business (2019-2024) & (US$ Million)
    Table 82. Oxford Nanopore Technologies Recent Development
    Table 83. Macrogen Company Detail
    Table 84. Macrogen Business Overview
    Table 85. Macrogen Clinical Oncology Next Generation Sequencing (NGS) Product
    Table 86. Macrogen Revenue in Clinical Oncology Next Generation Sequencing (NGS) Business (2019-2024) & (US$ Million)
    Table 87. Macrogen Recent Development
    Table 88. Life Technologies Company Detail
    Table 89. Life Technologies Business Overview
    Table 90. Life Technologies Clinical Oncology Next Generation Sequencing (NGS) Product
    Table 91. Life Technologies Revenue in Clinical Oncology Next Generation Sequencing (NGS) Business (2019-2024) & (US$ Million)
    Table 92. Life Technologies Recent Development
    Table 93. DNASTAR Company Detail
    Table 94. DNASTAR Business Overview
    Table 95. DNASTAR Clinical Oncology Next Generation Sequencing (NGS) Product
    Table 96. DNASTAR Revenue in Clinical Oncology Next Generation Sequencing (NGS) Business (2019-2024) & (US$ Million)
    Table 97. DNASTAR Recent Development
    Table 98. Exosome Diagnostics Company Detail
    Table 99. Exosome Diagnostics Business Overview
    Table 100. Exosome Diagnostics Clinical Oncology Next Generation Sequencing (NGS) Product
    Table 101. Exosome Diagnostics Revenue in Clinical Oncology Next Generation Sequencing (NGS) Business (2019-2024) & (US$ Million)
    Table 102. Exosome Diagnostics Recent Development
    Table 103. Biomatters Company Detail
    Table 104. Biomatters Business Overview
    Table 105. Biomatters Clinical Oncology Next Generation Sequencing (NGS) Product
    Table 106. Biomatters Revenue in Clinical Oncology Next Generation Sequencing (NGS) Business (2019-2024) & (US$ Million)
    Table 107. Biomatters Recent Development
    Table 108. CLC Bio Company Detail
    Table 109. CLC Bio Business Overview
    Table 110. CLC Bio Clinical Oncology Next Generation Sequencing (NGS) Product
    Table 111. CLC Bio Revenue in Clinical Oncology Next Generation Sequencing (NGS) Business (2019-2024) & (US$ Million)
    Table 112. CLC Bio Recent Development
    Table 113. BGI Company Detail
    Table 114. BGI Business Overview
    Table 115. BGI Clinical Oncology Next Generation Sequencing (NGS) Product
    Table 116. BGI Revenue in Clinical Oncology Next Generation Sequencing (NGS) Business (2019-2024) & (US$ Million)
    Table 117. BGI Recent Development
    Table 118. Qiagen Company Detail
    Table 119. Qiagen Business Overview
    Table 120. Qiagen Clinical Oncology Next Generation Sequencing (NGS) Product
    Table 121. Qiagen Revenue in Clinical Oncology Next Generation Sequencing (NGS) Business (2019-2024) & (US$ Million)
    Table 122. Qiagen Recent Development
    Table 123. Perkin Elmer Company Detail
    Table 124. Perkin Elmer Business Overview
    Table 125. Perkin Elmer Clinical Oncology Next Generation Sequencing (NGS) Product
    Table 126. Perkin Elmer Revenue in Clinical Oncology Next Generation Sequencing (NGS) Business (2019-2024) & (US$ Million)
    Table 127. Perkin Elmer Recent Development
    Table 128. Pacific Bioscience Company Detail
    Table 129. Pacific Bioscience Business Overview
    Table 130. Pacific Bioscience Clinical Oncology Next Generation Sequencing (NGS) Product
    Table 131. Pacific Bioscience Revenue in Clinical Oncology Next Generation Sequencing (NGS) Business (2019-2024) & (US$ Million)
    Table 132. Pacific Bioscience Recent Development
    Table 133. Partek Company Detail
    Table 134. Partek Business Overview
    Table 135. Partek Clinical Oncology Next Generation Sequencing (NGS) Product
    Table 136. Partek Revenue in Clinical Oncology Next Generation Sequencing (NGS) Business (2019-2024) & (US$ Million)
    Table 137. Partek Recent Development
    Table 138. GnuBIO Company Detail
    Table 139. GnuBIO Business Overview
    Table 140. GnuBIO Clinical Oncology Next Generation Sequencing (NGS) Product
    Table 141. GnuBIO Revenue in Clinical Oncology Next Generation Sequencing (NGS) Business (2019-2024) & (US$ Million)
    Table 142. GnuBIO Recent Development
    Table 143. Foundation Medicine Company Detail
    Table 144. Foundation Medicine Business Overview
    Table 145. Foundation Medicine Clinical Oncology Next Generation Sequencing (NGS) Product
    Table 146. Foundation Medicine Revenue in Clinical Oncology Next Generation Sequencing (NGS) Business (2019-2024) & (US$ Million)
    Table 147. Foundation Medicine Recent Development
    Table 148. Paradigm Company Detail
    Table 149. Paradigm Business Overview
    Table 150. Paradigm Clinical Oncology Next Generation Sequencing (NGS) Product
    Table 151. Paradigm Revenue in Clinical Oncology Next Generation Sequencing (NGS) Business (2019-2024) & (US$ Million)
    Table 152. Paradigm Recent Development
    Table 153. Caris Life Sciences Company Detail
    Table 154. Caris Life Sciences Business Overview
    Table 155. Caris Life Sciences Clinical Oncology Next Generation Sequencing (NGS) Product
    Table 156. Caris Life Sciences Revenue in Clinical Oncology Next Generation Sequencing (NGS) Business (2019-2024) & (US$ Million)
    Table 157. Caris Life Sciences Recent Development
    Table 158. Myriad Genetics Company Detail
    Table 159. Myriad Genetics Business Overview
    Table 160. Myriad Genetics Clinical Oncology Next Generation Sequencing (NGS) Product
    Table 161. Myriad Genetics Revenue in Clinical Oncology Next Generation Sequencing (NGS) Business (2019-2024) & (US$ Million)
    Table 162. Myriad Genetics Recent Development
    Table 163. Research Programs/Design for This Report
    Table 164. Key Data Information from Secondary Sources
    Table 165. Key Data Information from Primary Sources
List of Figures
    Figure 1. Global Clinical Oncology Next Generation Sequencing (NGS) Market Size Comparison by Type (2024-2030) & (US$ Million)
    Figure 2. Global Clinical Oncology Next Generation Sequencing (NGS) Market Share by Type: 2023 VS 2030
    Figure 3. NGS Pre-Sequencing Features
    Figure 4. Sequencing Features
    Figure 5. NGS Data Analysis Features
    Figure 6. Primary, Secondary & Tertiary Data Analysis Features
    Figure 7. Global Clinical Oncology Next Generation Sequencing (NGS) Market Size Comparison by Application (2024-2030) & (US$ Million)
    Figure 8. Global Clinical Oncology Next Generation Sequencing (NGS) Market Share by Application: 2023 VS 2030
    Figure 9. Academic & Clinical Research Case Studies
    Figure 10. Hospitals & Clinics Case Studies
    Figure 11. Pharma & Biotech Entities Case Studies
    Figure 12. Clinical Oncology Next Generation Sequencing (NGS) Report Years Considered
    Figure 13. Global Clinical Oncology Next Generation Sequencing (NGS) Market Size (US$ Million), Year-over-Year: 2019-2030
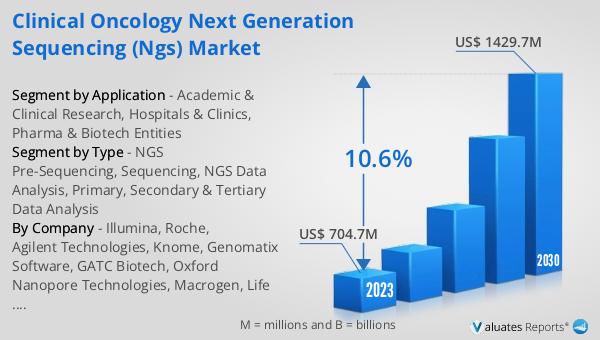
    Figure 14. Global Clinical Oncology Next Generation Sequencing (NGS) Market Size, (US$ Million), 2019 VS 2023 VS 2030
    Figure 15. Global Clinical Oncology Next Generation Sequencing (NGS) Market Share by Region: 2023 VS 2030
    Figure 16. Global Clinical Oncology Next Generation Sequencing (NGS) Market Share by Players in 2023
    Figure 17. Global Top Clinical Oncology Next Generation Sequencing (NGS) Players by Company Type (Tier 1, Tier 2, and Tier 3) & (based on the Revenue in Clinical Oncology Next Generation Sequencing (NGS) as of 2023)
    Figure 18. The Top 10 and 5 Players Market Share by Clinical Oncology Next Generation Sequencing (NGS) Revenue in 2023
    Figure 19. North America Clinical Oncology Next Generation Sequencing (NGS) Market Size YoY Growth (2019-2030) & (US$ Million)
    Figure 20. North America Clinical Oncology Next Generation Sequencing (NGS) Market Share by Country (2019-2030)
    Figure 21. United States Clinical Oncology Next Generation Sequencing (NGS) Market Size YoY Growth (2019-2030) & (US$ Million)
    Figure 22. Canada Clinical Oncology Next Generation Sequencing (NGS) Market Size YoY Growth (2019-2030) & (US$ Million)
    Figure 23. Europe Clinical Oncology Next Generation Sequencing (NGS) Market Size YoY Growth (2019-2030) & (US$ Million)
    Figure 24. Europe Clinical Oncology Next Generation Sequencing (NGS) Market Share by Country (2019-2030)
    Figure 25. Germany Clinical Oncology Next Generation Sequencing (NGS) Market Size YoY Growth (2019-2030) & (US$ Million)
    Figure 26. France Clinical Oncology Next Generation Sequencing (NGS) Market Size YoY Growth (2019-2030) & (US$ Million)
    Figure 27. U.K. Clinical Oncology Next Generation Sequencing (NGS) Market Size YoY Growth (2019-2030) & (US$ Million)
    Figure 28. Italy Clinical Oncology Next Generation Sequencing (NGS) Market Size YoY Growth (2019-2030) & (US$ Million)
    Figure 29. Russia Clinical Oncology Next Generation Sequencing (NGS) Market Size YoY Growth (2019-2030) & (US$ Million)
    Figure 30. Nordic Countries Clinical Oncology Next Generation Sequencing (NGS) Market Size YoY Growth (2019-2030) & (US$ Million)
    Figure 31. Asia-Pacific Clinical Oncology Next Generation Sequencing (NGS) Market Size YoY Growth (2019-2030) & (US$ Million)
    Figure 32. Asia-Pacific Clinical Oncology Next Generation Sequencing (NGS) Market Share by Region (2019-2030)
    Figure 33. China Clinical Oncology Next Generation Sequencing (NGS) Market Size YoY Growth (2019-2030) & (US$ Million)
    Figure 34. Japan Clinical Oncology Next Generation Sequencing (NGS) Market Size YoY Growth (2019-2030) & (US$ Million)
    Figure 35. South Korea Clinical Oncology Next Generation Sequencing (NGS) Market Size YoY Growth (2019-2030) & (US$ Million)
    Figure 36. Southeast Asia Clinical Oncology Next Generation Sequencing (NGS) Market Size YoY Growth (2019-2030) & (US$ Million)
    Figure 37. India Clinical Oncology Next Generation Sequencing (NGS) Market Size YoY Growth (2019-2030) & (US$ Million)
    Figure 38. Australia Clinical Oncology Next Generation Sequencing (NGS) Market Size YoY Growth (2019-2030) & (US$ Million)
    Figure 39. Latin America Clinical Oncology Next Generation Sequencing (NGS) Market Size YoY Growth (2019-2030) & (US$ Million)
    Figure 40. Latin America Clinical Oncology Next Generation Sequencing (NGS) Market Share by Country (2019-2030)
    Figure 41. Mexico Clinical Oncology Next Generation Sequencing (NGS) Market Size YoY Growth (2019-2030) & (US$ Million)
    Figure 42. Brazil Clinical Oncology Next Generation Sequencing (NGS) Market Size YoY Growth (2019-2030) & (US$ Million)
    Figure 43. Middle East & Africa Clinical Oncology Next Generation Sequencing (NGS) Market Size YoY Growth (2019-2030) & (US$ Million)
    Figure 44. Middle East & Africa Clinical Oncology Next Generation Sequencing (NGS) Market Share by Country (2019-2030)
    Figure 45. Turkey Clinical Oncology Next Generation Sequencing (NGS) Market Size YoY Growth (2019-2030) & (US$ Million)
    Figure 46. Saudi Arabia Clinical Oncology Next Generation Sequencing (NGS) Market Size YoY Growth (2019-2030) & (US$ Million)
    Figure 47. Illumina Revenue Growth Rate in Clinical Oncology Next Generation Sequencing (NGS) Business (2019-2024)
    Figure 48. Roche Revenue Growth Rate in Clinical Oncology Next Generation Sequencing (NGS) Business (2019-2024)
    Figure 49. Agilent Technologies Revenue Growth Rate in Clinical Oncology Next Generation Sequencing (NGS) Business (2019-2024)
    Figure 50. Knome Revenue Growth Rate in Clinical Oncology Next Generation Sequencing (NGS) Business (2019-2024)
    Figure 51. Genomatix Software Revenue Growth Rate in Clinical Oncology Next Generation Sequencing (NGS) Business (2019-2024)
    Figure 52. GATC Biotech Revenue Growth Rate in Clinical Oncology Next Generation Sequencing (NGS) Business (2019-2024)
    Figure 53. Oxford Nanopore Technologies Revenue Growth Rate in Clinical Oncology Next Generation Sequencing (NGS) Business (2019-2024)
    Figure 54. Macrogen Revenue Growth Rate in Clinical Oncology Next Generation Sequencing (NGS) Business (2019-2024)
    Figure 55. Life Technologies Revenue Growth Rate in Clinical Oncology Next Generation Sequencing (NGS) Business (2019-2024)
    Figure 56. DNASTAR Revenue Growth Rate in Clinical Oncology Next Generation Sequencing (NGS) Business (2019-2024)
    Figure 57. Exosome Diagnostics Revenue Growth Rate in Clinical Oncology Next Generation Sequencing (NGS) Business (2019-2024)
    Figure 58. Biomatters Revenue Growth Rate in Clinical Oncology Next Generation Sequencing (NGS) Business (2019-2024)
    Figure 59. CLC Bio Revenue Growth Rate in Clinical Oncology Next Generation Sequencing (NGS) Business (2019-2024)
    Figure 60. BGI Revenue Growth Rate in Clinical Oncology Next Generation Sequencing (NGS) Business (2019-2024)
    Figure 61. Qiagen Revenue Growth Rate in Clinical Oncology Next Generation Sequencing (NGS) Business (2019-2024)
    Figure 62. Perkin Elmer Revenue Growth Rate in Clinical Oncology Next Generation Sequencing (NGS) Business (2019-2024)
    Figure 63. Pacific Bioscience Revenue Growth Rate in Clinical Oncology Next Generation Sequencing (NGS) Business (2019-2024)
    Figure 64. Partek Revenue Growth Rate in Clinical Oncology Next Generation Sequencing (NGS) Business (2019-2024)
    Figure 65. GnuBIO Revenue Growth Rate in Clinical Oncology Next Generation Sequencing (NGS) Business (2019-2024)
    Figure 66. Foundation Medicine Revenue Growth Rate in Clinical Oncology Next Generation Sequencing (NGS) Business (2019-2024)
    Figure 67. Paradigm Revenue Growth Rate in Clinical Oncology Next Generation Sequencing (NGS) Business (2019-2024)
    Figure 68. Caris Life Sciences Revenue Growth Rate in Clinical Oncology Next Generation Sequencing (NGS) Business (2019-2024)
    Figure 69. Myriad Genetics Revenue Growth Rate in Clinical Oncology Next Generation Sequencing (NGS) Business (2019-2024)
    Figure 70. Bottom-up and Top-down Approaches for This Report
    Figure 71. Data Triangulation
    Figure 72. Key Executives Interviewed
SELECT A FORMAT
Added to Cart
Electronic (PDF)

$2900

This license allows only one user to access the PDF.
Electronic (PDF)

$4350

This license allows 1 - 5 user to access the PDF, license is suitable for small groups of 5 users working together
Electronic (PDF)

$5800

This license allows users/teams in a same Enterprise to use this report, various departments within an enterpise can use this report
Add to Cart
Buy Now (15% Discount)

OUR CUSTOMER

Bioinformatics Barcelona

SIMILAR REPORTS