0
U.S. (TOLL FREE)
+1 (315) 215-3225
Automative

0
U.S. (TOLL FREE)
+1 (315) 215-3225
Military Radars - Global Market Insights and Sales Trends 2024
Published Date: December 2023
|
Report Code: QYRE-Auto-29A6475
Home | Market Reports | Law & Government| Military
Global Military Radars Market Insights Forecast to 2028
BUY CHAPTERS

Military Radars - Global Market Insights and Sales Trends 2024

Code: QYRE-Auto-29A6475
Report
December 2023
Pages:114
QYResearch
Buy Now with 15% Discount
DESCRIPTION
TABLE OF CONTENT
TABLES & FIGURES

Military Radars - Market Size

The global Military Radars market size is expected to reach US$ 13090 million by 2029, growing at a CAGR of 2.7% from 2023 to 2029.

Military Radars -  Market

Military Radars - Market

Military radar is a military electronic equipment that USES electromagnetic waves to detect targets.
The market is mainly driven by the significant applications of Military Radars in various end use industries. The expanding demands from the Weapon Guidance System, Surveillance and Others,, are propelling Military Radars market. Ground Based, one of the segments analysed in this report, is projected to record % CAGR and reach US$ million by the end of the analysis period. Growth in the Naval Based segment is estimated at % CAGR for the next seven-year period.
Several changes in the worldwide radar sector have occurred in the past few years, which have directly impacted the security of nations. As nations move forward with developments in range, electronic warfare and detection, there has been significant growth in radar systems, which are being widely used across different sections of the military forces such as army, navy and air force. Different categories of radar systems used by them are ground-based, naval, airborne, and space-based. Today North America accounts for largest military radar market followed by Asia-Pacific.

Report Objectives

This report provides market insight on the different segments, by players, by Type, by Application. Market size and forecast (2018-2029) has been provided in the report. The primary objectives of this report are to provide 1) global market size and forecasts, growth rates, market dynamics, industry structure and developments, market situation, trends; 2) global market share and ranking by company; 3) comprehensive presentation of the global market for Military Radars, with both quantitative and qualitative analysis through detailed segmentation; 4) detailed value chain analysis and review of growth factors essential for the existing market players and new entrants; 5) emerging opportunities in the market and the future impact of major drivers and restraints of the market.

Key Features of The Study:

This report provides in-depth analysis of the global Military Radars market, and provides market size (US$ million) and CAGR for the forecast period (2023-2029), considering 2022 as the base year.
This report profiles key players in the global Military Radars market based on the following parameters - company details (found date, headquarters, manufacturing bases), products portfolio, Military Radars sales data, market share and ranking.
This report elucidates potential market opportunities across different segments and explains attractive investment proposition matrices for this market.
This report illustrates key insights about market drivers, restraints, opportunities, market trends, regional outlook.
Key companies of Military Radars covered in this report include Lockheed Martin Corporation, Northrop Grumman Corporation, Raytheon Company, Saab Group, Thales Group, Airbus Group, BAE Systems, General Dynamics and Israel Aerospace Industries Ltd., etc.
The global Military Radars market report caters to various stakeholders in this industry including investors, suppliers, product players, distributors, new entrants, and financial analysts.
Market Segmentation
Company Profiles:
Lockheed Martin Corporation
Northrop Grumman Corporation
Raytheon Company
Saab Group
Thales Group
Airbus Group
BAE Systems
General Dynamics
Israel Aerospace Industries Ltd.
Finmeccanica SPA
Harris
Terma
ASELSAN
DRS Technologies
Glarun Technology
Raco
Tianhe Defense Technology

Scope of Military Radars - Market Report

Report Metric Details
Report Name Military Radars - Market
Forecasted market size in 2029 US$ 13090 million
CAGR 2.7%
Forecasted years 2023 - 2029
Global Military Radars market, by region:
  • North America (U.S., Canada, Mexico)
  • Europe (Germany, France, UK, Italy, etc.)
  • Asia Pacific (China, Japan, South Korea, Southeast Asia, India, etc.)
  • South America (Brazil, etc.)
  • Middle East and Africa (Turkey, GCC Countries, Africa, etc.)
Global Military Radars market, Segment by Type:
  • Ground Based
  • Naval Based
  • Airborne Based
  • Others
Global Military Radars market, by Application
  • Weapon Guidance System
  • Surveillance
  • Others
Forecast units USD million in value
Report coverage Revenue and volume forecast, company share, competitive landscape, growth factors and trends

Core Chapters

  • Chapter One: Introduces the report scope of the report, executive summary of global and regional market size and CAGR for the history and forecast period (2018-2023, 2024-2029). It offers a high-level view of the current state of the market and its likely evolution in the short to mid-term, and long term.
  • Chapter Two: Provides the analysis of various market segments by Type, covering the market size and development potential of each market segment, to help readers find the blue ocean market in different market segments.
  • Chapter Three: Provides the analysis of various market segments by Application, covering the market size and development potential of each market segment, to help readers find the blue ocean market in different downstream markets.
  • Chapter Four: Detailed analysis of Military Radars companies’ competitive landscape, revenue, market share and ranking, latest development plan, merger, and acquisition information, etc.
  • Chapter Five: Provides profiles of key players, introducing the basic situation of the main companies in the market in detail, including product introduction, revenue, recent development, etc.
  • Chapter Six, Seven, Eight, Nine and Ten: North America, Europe, Asia Pacific, Latin America, Middle East & Africa, revenue by country.
  • Chapter Eleven: this section also introduces the market dynamics, latest developments of the market, the driving factors and restrictive factors of the market, the challenges and risks faced by companies in the industry, and the analysis of relevant policies in the industry.
  • Chapter Twelve: Research Finding/Conclusion

FAQ for this report

What is the Military Radars - Market size in 2029?

Ans: The Military Radars - Market size in 2029 will be US$ 13090 million.

What are the Application segmentation covered in the Military Radars - Market report?

Ans: The Applications covered in the Military Radars - Market report are Weapon Guidance System, Surveillance, Others

What are the Type segmentation covered in the Military Radars - Market report?

Ans: The Types covered in the Military Radars - Market report are Ground Based, Naval Based, Airborne Based, Others

1 Market Overview of Military Radars
1.1 Military Radars Market Overview
1.1.1 Military Radars Product Scope
1.1.2 Military Radars Market Status and Outlook
1.2 Global Military Radars Market Size Overview by Region 2018 VS 2022 VS 2029
1.3 Global Military Radars Market Size by Region (2018-2029)
1.4 Global Military Radars Historic Market Size by Region (2018-2023)
1.5 Global Military Radars Market Size Forecast by Region (2024-2029)
1.6 Key Regions, Military Radars Market Size (2018-2029)
1.6.1 North America Military Radars Market Size (2018-2029)
1.6.2 Europe Military Radars Market Size (2018-2029)
1.6.3 Asia-Pacific Military Radars Market Size (2018-2029)
1.6.4 Latin America Military Radars Market Size (2018-2029)
1.6.5 Middle East & Africa Military Radars Market Size (2018-2029)
2 Military Radars Market by Type
2.1 Introduction
2.1.1 Ground Based
2.1.2 Naval Based
2.1.3 Airborne Based
2.1.4 Others
2.2 Global Military Radars Market Size by Type: 2018 VS 2022 VS 2029
2.2.1 Global Military Radars Historic Market Size by Type (2018-2023)
2.2.2 Global Military Radars Forecasted Market Size by Type (2024-2029)
2.3 Key Regions Market Size by Type
2.3.1 North America Military Radars Revenue Breakdown by Type (2018-2029)
2.3.2 Europe Military Radars Revenue Breakdown by Type (2018-2029)
2.3.3 Asia-Pacific Military Radars Revenue Breakdown by Type (2018-2029)
2.3.4 Latin America Military Radars Revenue Breakdown by Type (2018-2029)
2.3.5 Middle East and Africa Military Radars Revenue Breakdown by Type (2018-2029)
3 Military Radars Market Overview by Application
3.1 Introduction
3.1.1 Weapon Guidance System
3.1.2 Surveillance
3.1.3 Others
3.2 Global Military Radars Market Size by Application: 2018 VS 2022 VS 2029
3.2.1 Global Military Radars Historic Market Size by Application (2018-2023)
3.2.2 Global Military Radars Forecasted Market Size by Application (2024-2029)
3.3 Key Regions Market Size by Application
3.3.1 North America Military Radars Revenue Breakdown by Application (2018-2029)
3.3.2 Europe Military Radars Revenue Breakdown by Application (2018-2029)
3.3.3 Asia-Pacific Military Radars Revenue Breakdown by Application (2018-2029)
3.3.4 Latin America Military Radars Revenue Breakdown by Application (2018-2029)
3.3.5 Middle East and Africa Military Radars Revenue Breakdown by Application (2018-2029)
4 Military Radars Competition Analysis by Players
4.1 Global Military Radars Market Size by Players (2018-2023)
4.2 Global Top Players by Company Type (Tier 1, Tier 2 and Tier 3) & (based on the Revenue in Military Radars as of 2022)
4.3 Date of Key Players Enter into Military Radars Market
4.4 Global Top Players Military Radars Headquarters and Area Served
4.5 Key Players Military Radars Product Solution and Service
4.6 Competitive Status
4.6.1 Military Radars Market Concentration Rate
4.6.2 Mergers & Acquisitions, Expansion Plans
5 Company (Top Players) Profiles
5.1 Lockheed Martin Corporation
5.1.1 Lockheed Martin Corporation Profile
5.1.2 Lockheed Martin Corporation Main Business
5.1.3 Lockheed Martin Corporation Military Radars Products, Services and Solutions
5.1.4 Lockheed Martin Corporation Military Radars Revenue (US$ Million) & (2018-2023)
5.1.5 Lockheed Martin Corporation Recent Developments
5.2 Northrop Grumman Corporation
5.2.1 Northrop Grumman Corporation Profile
5.2.2 Northrop Grumman Corporation Main Business
5.2.3 Northrop Grumman Corporation Military Radars Products, Services and Solutions
5.2.4 Northrop Grumman Corporation Military Radars Revenue (US$ Million) & (2018-2023)
5.2.5 Northrop Grumman Corporation Recent Developments
5.3 Raytheon Company
5.3.1 Raytheon Company Profile
5.3.2 Raytheon Company Main Business
5.3.3 Raytheon Company Military Radars Products, Services and Solutions
5.3.4 Raytheon Company Military Radars Revenue (US$ Million) & (2018-2023)
5.3.5 Saab Group Recent Developments
5.4 Saab Group
5.4.1 Saab Group Profile
5.4.2 Saab Group Main Business
5.4.3 Saab Group Military Radars Products, Services and Solutions
5.4.4 Saab Group Military Radars Revenue (US$ Million) & (2018-2023)
5.4.5 Saab Group Recent Developments
5.5 Thales Group
5.5.1 Thales Group Profile
5.5.2 Thales Group Main Business
5.5.3 Thales Group Military Radars Products, Services and Solutions
5.5.4 Thales Group Military Radars Revenue (US$ Million) & (2018-2023)
5.5.5 Thales Group Recent Developments
5.6 Airbus Group
5.6.1 Airbus Group Profile
5.6.2 Airbus Group Main Business
5.6.3 Airbus Group Military Radars Products, Services and Solutions
5.6.4 Airbus Group Military Radars Revenue (US$ Million) & (2018-2023)
5.6.5 Airbus Group Recent Developments
5.7 BAE Systems
5.7.1 BAE Systems Profile
5.7.2 BAE Systems Main Business
5.7.3 BAE Systems Military Radars Products, Services and Solutions
5.7.4 BAE Systems Military Radars Revenue (US$ Million) & (2018-2023)
5.7.5 BAE Systems Recent Developments
5.8 General Dynamics
5.8.1 General Dynamics Profile
5.8.2 General Dynamics Main Business
5.8.3 General Dynamics Military Radars Products, Services and Solutions
5.8.4 General Dynamics Military Radars Revenue (US$ Million) & (2018-2023)
5.8.5 General Dynamics Recent Developments
5.9 Israel Aerospace Industries Ltd.
5.9.1 Israel Aerospace Industries Ltd. Profile
5.9.2 Israel Aerospace Industries Ltd. Main Business
5.9.3 Israel Aerospace Industries Ltd. Military Radars Products, Services and Solutions
5.9.4 Israel Aerospace Industries Ltd. Military Radars Revenue (US$ Million) & (2018-2023)
5.9.5 Israel Aerospace Industries Ltd. Recent Developments
5.10 Finmeccanica SPA
5.10.1 Finmeccanica SPA Profile
5.10.2 Finmeccanica SPA Main Business
5.10.3 Finmeccanica SPA Military Radars Products, Services and Solutions
5.10.4 Finmeccanica SPA Military Radars Revenue (US$ Million) & (2018-2023)
5.10.5 Finmeccanica SPA Recent Developments
5.11 Harris
5.11.1 Harris Profile
5.11.2 Harris Main Business
5.11.3 Harris Military Radars Products, Services and Solutions
5.11.4 Harris Military Radars Revenue (US$ Million) & (2018-2023)
5.11.5 Harris Recent Developments
5.12 Terma
5.12.1 Terma Profile
5.12.2 Terma Main Business
5.12.3 Terma Military Radars Products, Services and Solutions
5.12.4 Terma Military Radars Revenue (US$ Million) & (2018-2023)
5.12.5 Terma Recent Developments
5.13 ASELSAN
5.13.1 ASELSAN Profile
5.13.2 ASELSAN Main Business
5.13.3 ASELSAN Military Radars Products, Services and Solutions
5.13.4 ASELSAN Military Radars Revenue (US$ Million) & (2018-2023)
5.13.5 ASELSAN Recent Developments
5.14 DRS Technologies
5.14.1 DRS Technologies Profile
5.14.2 DRS Technologies Main Business
5.14.3 DRS Technologies Military Radars Products, Services and Solutions
5.14.4 DRS Technologies Military Radars Revenue (US$ Million) & (2018-2023)
5.14.5 DRS Technologies Recent Developments
5.15 Glarun Technology
5.15.1 Glarun Technology Profile
5.15.2 Glarun Technology Main Business
5.15.3 Glarun Technology Military Radars Products, Services and Solutions
5.15.4 Glarun Technology Military Radars Revenue (US$ Million) & (2018-2023)
5.15.5 Glarun Technology Recent Developments
5.16 Raco
5.16.1 Raco Profile
5.16.2 Raco Main Business
5.16.3 Raco Military Radars Products, Services and Solutions
5.16.4 Raco Military Radars Revenue (US$ Million) & (2018-2023)
5.16.5 Raco Recent Developments
5.17 Tianhe Defense Technology
5.17.1 Tianhe Defense Technology Profile
5.17.2 Tianhe Defense Technology Main Business
5.17.3 Tianhe Defense Technology Military Radars Products, Services and Solutions
5.17.4 Tianhe Defense Technology Military Radars Revenue (US$ Million) & (2018-2023)
5.17.5 Tianhe Defense Technology Recent Developments
6 North America
6.1 North America Military Radars Market Size by Country (2018-2029)
6.2 U.S.
6.3 Canada
7 Europe
7.1 Europe Military Radars Market Size by Country (2018-2029)
7.2 Germany
7.3 France
7.4 U.K.
7.5 Italy
7.6 Russia
7.7 Nordic Countries
7.8 Rest of Europe
8 Asia-Pacific
8.1 Asia-Pacific Military Radars Market Size by Region (2018-2029)
8.2 China
8.3 Japan
8.4 South Korea
8.5 Southeast Asia
8.6 India
8.7 Australia
8.8 Rest of Asia-Pacific
9 Latin America
9.1 Latin America Military Radars Market Size by Country (2018-2029)
9.2 Mexico
9.3 Brazil
9.4 Rest of Latin America
10 Middle East & Africa
10.1 Middle East & Africa Military Radars Market Size by Country (2018-2029)
10.2 Turkey
10.3 Saudi Arabia
10.4 UAE
10.5 Rest of Middle East & Africa
11 Military Radars Market Dynamics
11.1 Military Radars Industry Trends
11.2 Military Radars Market Drivers
11.3 Military Radars Market Challenges
11.4 Military Radars Market Restraints
12 Research Finding /Conclusion
13 Methodology and Data Source
13.1 Methodology/Research Approach
13.1.1 Research Programs/Design
13.1.2 Market Size Estimation
13.1.3 Market Breakdown and Data Triangulation
13.2 Data Source
13.2.1 Secondary Sources
13.2.2 Primary Sources
13.3 Disclaimer
13.4 Author List
List of Tables
    Table 1. Global Market Military Radars Market Size (US$ Million) Comparison by Region 2018 VS 2022 VS 2029
    Table 2. Global Military Radars Market Size by Region (2018-2023) & (US$ Million)
    Table 3. Global Military Radars Market Size Share by Region (2018-2023)
    Table 4. Global Military Radars Forecasted Market Size by Region (2024-2029) & (US$ Million)
    Table 5. Global Military Radars Forecasted Market Size Share by Region (2024-2029)
    Table 6. Global Military Radars Market Size (US$ Million) by Type: 2018 VS 2022 VS 2029
    Table 7. Global Military Radars Market Size by Type (2018-2023) & (US$ Million)
    Table 8. Global Military Radars Revenue Market Share by Type (2018-2023)
    Table 9. Global Military Radars Forecasted Market Size by Type (2024-2029) & (US$ Million)
    Table 10. Global Military Radars Revenue Market Share by Type (2024-2029)
    Table 11. North America Military Radars Revenue by Type (2018-2023) & (US$ Million)
    Table 12. North America Military Radars Revenue by Type (2024-2029) & (US$ Million)
    Table 13. Europe Military Radars Revenue by Type (2018-2023) & (US$ Million)
    Table 14. Europe Military Radars Revenue by Type (2024-2029) & (US$ Million)
    Table 15. Asia-Pacific Military Radars Revenue by Type (2018-2023) & (US$ Million)
    Table 16. Asia-Pacific Military Radars Revenue by Type (2024-2029) & (US$ Million)
    Table 17. Latin America Military Radars Revenue by Type (2018-2023) & (US$ Million)
    Table 18. Latin America Military Radars Revenue by Type (2024-2029) & (US$ Million)
    Table 19. Middle East and Africa Military Radars Revenue by Type (2018-2023) & (US$ Million)
    Table 20. Middle East and Africa Military Radars Revenue by Type (2024-2029) & (US$ Million)
    Table 21. Global Military Radars Market Size (US$ Million) by Application: 2018 VS 2022 VS 2029
    Table 22. Global Military Radars Market Size by Application (2018-2023) & (US$ Million)
    Table 23. Global Military Radars Revenue Market Share by Application (2018-2023)
    Table 24. Global Military Radars Forecasted Market Size by Application (2024-2029) & (US$ Million)
    Table 25. Global Military Radars Revenue Market Share by Application (2024-2029)
    Table 26. North America Military Radars Revenue by Application (2018-2023) & (US$ Million)
    Table 27. North America Military Radars Revenue by Application (2024-2029) & (US$ Million)
    Table 28. Europe Military Radars Revenue by Application (2018-2023) & (US$ Million)
    Table 29. Europe Military Radars Revenue by Application (2024-2029) & (US$ Million)
    Table 30. Asia-Pacific Military Radars Revenue by Application (2018-2023) & (US$ Million)
    Table 31. Asia-Pacific Military Radars Revenue by Application (2024-2029) & (US$ Million)
    Table 32. Latin America Military Radars Revenue by Application (2018-2023) & (US$ Million)
    Table 33. Latin America Military Radars Revenue by Application (2024-2029) & (US$ Million)
    Table 34. Middle East and Africa Military Radars Revenue by Application (2018-2023) & (US$ Million)
    Table 35. Middle East and Africa Military Radars Revenue by Application (2024-2029) & (US$ Million)
    Table 36. Global Military Radars Revenue (US$ Million) by Players (2018-2023)
    Table 37. Global Military Radars Revenue Market Share by Players (2018-2023)
    Table 38. Global Top Players Market Share by Company Type (Tier 1, Tier 2 and Tier 3) & (based on the Revenue in Military Radars as of 2022)
    Table 39. Date of Key Players Enter into Military Radars Market
    Table 40. Global Military Radars Key Players Headquarters and Area Served
    Table 41. Military Radars Product Solution and Service
    Table 42. Global Military Radars Players Market Concentration Ratio (CR5 and HHI)
    Table 43. Mergers & Acquisitions, Expansion Plans
    Table 44. Lockheed Martin Corporation Basic Information List
    Table 45. Lockheed Martin Corporation Description and Business Overview
    Table 46. Lockheed Martin Corporation Military Radars Products, Services and Solutions
    Table 47. Revenue (US$ Million) in Military Radars Business of Lockheed Martin Corporation (2018-2023)
    Table 48. Lockheed Martin Corporation Recent Developments
    Table 49. Northrop Grumman Corporation Basic Information List
    Table 50. Northrop Grumman Corporation Description and Business Overview
    Table 51. Northrop Grumman Corporation Military Radars Products, Services and Solutions
    Table 52. Revenue (US$ Million) in Military Radars Business of Northrop Grumman Corporation (2018-2023)
    Table 53. Northrop Grumman Corporation Recent Developments
    Table 54. Raytheon Company Basic Information List
    Table 55. Raytheon Company Description and Business Overview
    Table 56. Raytheon Company Military Radars Products, Services and Solutions
    Table 57. Revenue (US$ Million) in Military Radars Business of Raytheon Company (2018-2023)
    Table 58. Raytheon Company Recent Developments
    Table 59. Saab Group Basic Information List
    Table 60. Saab Group Description and Business Overview
    Table 61. Saab Group Military Radars Products, Services and Solutions
    Table 62. Revenue (US$ Million) in Military Radars Business of Saab Group (2018-2023)
    Table 63. Saab Group Recent Developments
    Table 64. Thales Group Basic Information List
    Table 65. Thales Group Description and Business Overview
    Table 66. Thales Group Military Radars Products, Services and Solutions
    Table 67. Revenue (US$ Million) in Military Radars Business of Thales Group (2018-2023)
    Table 68. Thales Group Recent Developments
    Table 69. Airbus Group Basic Information List
    Table 70. Airbus Group Description and Business Overview
    Table 71. Airbus Group Military Radars Products, Services and Solutions
    Table 72. Revenue (US$ Million) in Military Radars Business of Airbus Group (2018-2023)
    Table 73. Airbus Group Recent Developments
    Table 74. BAE Systems Basic Information List
    Table 75. BAE Systems Description and Business Overview
    Table 76. BAE Systems Military Radars Products, Services and Solutions
    Table 77. Revenue (US$ Million) in Military Radars Business of BAE Systems (2018-2023)
    Table 78. BAE Systems Recent Developments
    Table 79. General Dynamics Basic Information List
    Table 80. General Dynamics Description and Business Overview
    Table 81. General Dynamics Military Radars Products, Services and Solutions
    Table 82. Revenue (US$ Million) in Military Radars Business of General Dynamics (2018-2023)
    Table 83. General Dynamics Recent Developments
    Table 84. Israel Aerospace Industries Ltd. Basic Information List
    Table 85. Israel Aerospace Industries Ltd. Description and Business Overview
    Table 86. Israel Aerospace Industries Ltd. Military Radars Products, Services and Solutions
    Table 87. Revenue (US$ Million) in Military Radars Business of Israel Aerospace Industries Ltd. (2018-2023)
    Table 88. Israel Aerospace Industries Ltd. Recent Developments
    Table 89. Finmeccanica SPA Basic Information List
    Table 90. Finmeccanica SPA Description and Business Overview
    Table 91. Finmeccanica SPA Military Radars Products, Services and Solutions
    Table 92. Revenue (US$ Million) in Military Radars Business of Finmeccanica SPA (2018-2023)
    Table 93. Finmeccanica SPA Recent Developments
    Table 94. Harris Basic Information List
    Table 95. Harris Description and Business Overview
    Table 96. Harris Military Radars Products, Services and Solutions
    Table 97. Revenue (US$ Million) in Military Radars Business of Harris (2018-2023)
    Table 98. Harris Recent Developments
    Table 99. Terma Basic Information List
    Table 100. Terma Description and Business Overview
    Table 101. Terma Military Radars Products, Services and Solutions
    Table 102. Revenue (US$ Million) in Military Radars Business of Terma (2018-2023)
    Table 103. Terma Recent Developments
    Table 104. ASELSAN Basic Information List
    Table 105. ASELSAN Description and Business Overview
    Table 106. ASELSAN Military Radars Products, Services and Solutions
    Table 107. Revenue (US$ Million) in Military Radars Business of ASELSAN (2018-2023)
    Table 108. ASELSAN Recent Developments
    Table 109. DRS Technologies Basic Information List
    Table 110. DRS Technologies Description and Business Overview
    Table 111. DRS Technologies Military Radars Products, Services and Solutions
    Table 112. Revenue (US$ Million) in Military Radars Business of DRS Technologies (2018-2023)
    Table 113. DRS Technologies Recent Developments
    Table 114. Glarun Technology Basic Information List
    Table 115. Glarun Technology Description and Business Overview
    Table 116. Glarun Technology Military Radars Products, Services and Solutions
    Table 117. Revenue (US$ Million) in Military Radars Business of Glarun Technology (2018-2023)
    Table 118. Glarun Technology Recent Developments
    Table 119. Raco Basic Information List
    Table 120. Raco Description and Business Overview
    Table 121. Raco Military Radars Products, Services and Solutions
    Table 122. Revenue (US$ Million) in Military Radars Business of Raco (2018-2023)
    Table 123. Raco Recent Developments
    Table 124. Tianhe Defense Technology Basic Information List
    Table 125. Tianhe Defense Technology Description and Business Overview
    Table 126. Tianhe Defense Technology Military Radars Products, Services and Solutions
    Table 127. Revenue (US$ Million) in Military Radars Business of Tianhe Defense Technology (2018-2023)
    Table 128. Tianhe Defense Technology Recent Developments
    Table 129. North America Military Radars Market Size by Country (2018-2023) & (US$ Million)
    Table 130. North America Military Radars Market Size by Country (2024-2029) & (US$ Million)
    Table 131. Europe Military Radars Market Size by Country (2018-2023) & (US$ Million)
    Table 132. Europe Military Radars Market Size by Country (2024-2029) & (US$ Million)
    Table 133. Asia-Pacific Military Radars Market Size Growth Rate (CAGR) by Region (US$ Million): 2018 VS 2022 VS 2029
    Table 134. Asia-Pacific Military Radars Market Size by Region (2018-2023) & (US$ Million)
    Table 135. Asia-Pacific Military Radars Market Size by Region (2024-2029) & (US$ Million)
    Table 136. Asia-Pacific Military Radars Market Share by Region (2018-2023)
    Table 137. Asia-Pacific Military Radars Market Share by Region (2024-2029)
    Table 138. Latin America Military Radars Market Size Growth Rate (CAGR) by Region (US$ Million): 2018 VS 2022 VS 2029
    Table 139. Latin America Military Radars Market Size by Country (2018-2023) & (US$ Million)
    Table 140. Latin America Military Radars Market Size by Country (2024-2029) & (US$ Million)
    Table 141. Middle East & Africa Military Radars Market Size Growth Rate (CAGR) by Region (US$ Million): 2018 VS 2022 VS 2029
    Table 142. Middle East & Africa Military Radars Market Size by Country (2018-2023) & (US$ Million)
    Table 143. Middle East & Africa Military Radars Market Size by Country (2024-2029) & (US$ Million)
    Table 144. Military Radars Market Trends
    Table 145. Military Radars Market Drivers
    Table 146. Military Radars Market Challenges
    Table 147. Military Radars Market Restraints
    Table 148. Research Programs/Design for This Report
    Table 149. Key Data Information from Secondary Sources
    Table 150. Key Data Information from Primary Sources
List of Figures
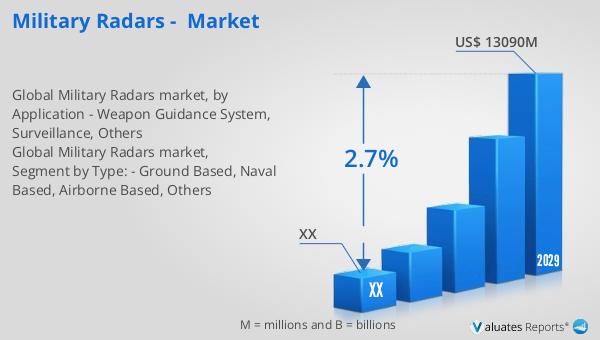
    Figure 1. Global Military Radars Market Size Year-over-Year 2018-2029 & (US$ Million)
    Figure 2. Global Military Radars Market Size (US$ Million), 2018 VS 2022 VS 2029
    Figure 3. Global Military Radars Market Share by Regions: 2022 VS 2029
    Figure 4. Global Military Radars Forecasted Market Size Share by Region (2024-2029)
    Figure 5. North America Military Radars Market Size Growth Rate (2018-2029) & (US$ Million)
    Figure 6. Europe Military Radars Market Size Growth Rate (2018-2029) & (US$ Million)
    Figure 7. Asia-Pacific Military Radars Market Size Growth Rate (2018-2029) & (US$ Million)
    Figure 8. Latin America Military Radars Market Size Growth Rate (2018-2029) & (US$ Million)
    Figure 9. Middle East & Africa Military Radars Market Size Growth Rate (2018-2029) & (US$ Million)
    Figure 10. Product Picture of Ground Based
    Figure 11. Global Ground Based Market Size (US$ Million) & YoY Growth (2018-2029)
    Figure 12. Product Picture of Naval Based
    Figure 13. Global Naval Based Market Size (US$ Million) & YoY Growth (2018-2029)
    Figure 14. Product Picture of Airborne Based
    Figure 15. Global Airborne Based Market Size (US$ Million) & YoY Growth (2018-2029)
    Figure 16. Product Picture of Others
    Figure 17. Global Others Market Size (US$ Million) & YoY Growth (2018-2029)
    Figure 18. Global Military Radars Market Size Share by Type: 2022 & 2029
    Figure 19. North America Military Radars Revenue Market Share by Type (2018-2029)
    Figure 20. Europe Military Radars Revenue Market Share by Type (2018-2029)
    Figure 21. Asia-Pacific Military Radars Revenue Market Share by Type (2018-2029)
    Figure 22. Latin America Military Radars Revenue Market Share by Type (2018-2029)
    Figure 23. Middle East and Africa Military Radars Revenue Market Share by Type (2018-2029)
    Figure 24. Weapon Guidance System Market Size (US$ Million) & YoY Growth (2018-2029)
    Figure 25. Surveillance Market Size (US$ Million) & YoY Growth (2018-2029)
    Figure 26. Others Market Size (US$ Million) & YoY Growth (2018-2029)
    Figure 27. Global Military Radars Market Size Share by Application: 2022 & 2029
    Figure 28. North America Military Radars Revenue Market Share by Application (2018-2029)
    Figure 29. Europe Military Radars Revenue Market Share by Application (2018-2029)
    Figure 30. Asia-Pacific Military Radars Revenue Market Share by Application (2018-2029)
    Figure 31. Latin America Military Radars Revenue Market Share by Application (2018-2029)
    Figure 32. Middle East and Africa Military Radars Revenue Market Share by Application (2018-2029)
    Figure 33. Military Radars Market Share by Company Type (Tier 1, Tier 2 and Tier 3): 2018 VS 2022
    Figure 34. Global Top 5 and Top 10 Players Military Radars Market Share in 2022
    Figure 35. North America Military Radars Market Share by Country (2018-2029)
    Figure 36. U.S. Military Radars Market Size (2018-2029) & (US$ Million)
    Figure 37. Canada Military Radars Market Size (2018-2029) & (US$ Million)
    Figure 38. Germany Military Radars Market Size (2018-2029) & (US$ Million)
    Figure 39. France Military Radars Market Size (2018-2029) & (US$ Million)
    Figure 40. U.K. Military Radars Market Size (2018-2029) & (US$ Million)
    Figure 41. Italy Military Radars Market Size (2018-2029) & (US$ Million)
    Figure 42. Russia Military Radars Market Size (2018-2029) & (US$ Million)
    Figure 43. Nordic Countries Military Radars Market Size (2018-2029) & (US$ Million)
    Figure 44. Asia-Pacific Military Radars Market Share by Region (2018-2029)
    Figure 45. China Military Radars Market Size (2018-2029) & (US$ Million)
    Figure 46. Japan Military Radars Market Size (2018-2029) & (US$ Million)
    Figure 47. South Korea Military Radars Market Size (2018-2029) & (US$ Million)
    Figure 48. Southeast Asia Military Radars Market Size (2018-2029) & (US$ Million)
    Figure 49. India Military Radars Market Size (2018-2029) & (US$ Million)
    Figure 50. Australia Military Radars Market Size (2018-2029) & (US$ Million)
    Figure 51. Latin America Military Radars Market Share by Country (2018-2029)
    Figure 52. Mexico Military Radars Market Size (2018-2029) & (US$ Million)
    Figure 53. Brazil Military Radars Market Size (2018-2029) & (US$ Million)
    Figure 54. Middle East & Africa Military Radars Market Share by Country (2018-2029)
    Figure 55. Turkey Military Radars Market Size (2018-2029) & (US$ Million)
    Figure 56. Saudi Arabia Military Radars Market Size (2018-2029) & (US$ Million)
    Figure 57. UAE Military Radars Market Size (2018-2029) & (US$ Million)
    Figure 58. Bottom-up and Top-down Approaches for This Report
SELECT A FORMAT
Added to Cart
Electronic (PDF)

$3350

This license allows only one user to access the PDF.
Electronic (PDF)

$5025

This license allows 1 - 5 user to access the PDF, license is suitable for small groups of 5 users working together
Electronic (PDF)

$6700

This license allows users/teams in a same Enterprise to use this report, various departments within an enterpise can use this report
Add to Cart
Buy Now (15% Discount)

OUR CUSTOMER

Samsung SD

SIMILAR REPORTS