
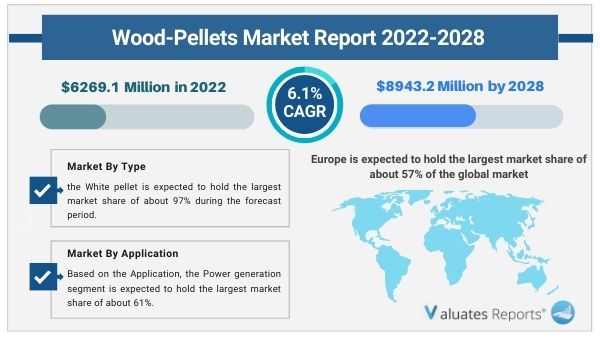
The global Wood-Pellets market size is estimated to be worth US$ 6269.1 million in 2022 and is forecast to a readjusted size of US$ 8943.2 million by 2028 with a Compound Annual Growth Rate (CAGR) of 6.1% during the forecast period.
The increasing use of wood pallets for electricity generation is likely to propel the wood pallets market forward. Pallets made of wood can be used totally or partially with coal (co-firing). Approximately half of the pellets are used in power plants that have switched from coal to pellets or are partially replacing coal (co-firing). The remaining half of pellet usage is used to heat homes (through pellet stoves or pellet boilers), as well as to heat residential blocks, public or commercial buildings, and industrial steam needs. Pellets have the flexibility to be employed at nearly any scale of demand, from small domestic appliances with a few kW of output to enormous power plants with hundreds of MW of capacity, which is one of their biggest advantages.
Market Segments
The authors of this research report have explored the key segments: Type and Application. The report offers an in-depth breakdown of type and application segments and their sub-segments. The lucrativeness and growth potential have been looked into by the industry experts in this report. This section of the report also provides sales and revenue forecast data by type and application segments based on sales, price, and revenue for the period 2017-2028. The specialists, to broaden the understanding of the users, have done value chain and raw material analysis in this section.
Wood-Pellets are mainly classified into the following types: white pellet and black pellet. White pellet is the most widely used type which takes up about 97% of the total sales, while the black pellet has a fast growing speed.
Wood-Pellets have wide range of applications, such as power generation, industrial furnace, civil use etc. And power generation was the most widely used area which took up about 61% of the global total.
Enviva, Pinnacle, Graanul Invest Group, Drax Biomass International, Vyborgskaya Cellulose and Lignetics, etc. are the key suppliers in the global Wood-Pellets market. Top 5 took up about 32% of the global market.
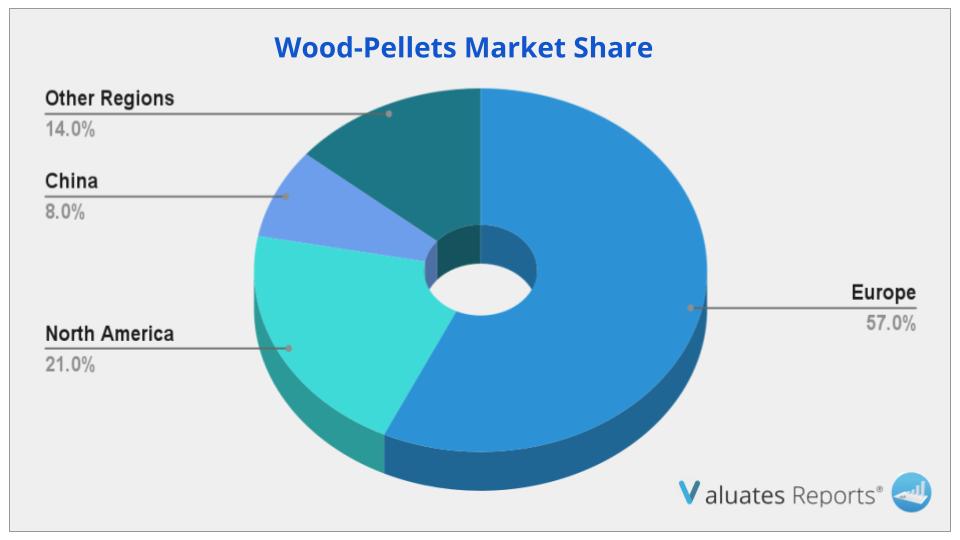
Europe is the largest consumer of Wood-Pellets in the world. European market took up about 57% of the global market, while North America and China were about 21%, 8%.
In terms of sales side, this report focuses on the sales of Wood-Pellets by region (region level and country level), by company, by Type and by Application. from 2017 to 2022 and forecast to 2028.
In terms of production side, this report researches the Wood-Pellets capacity, production, growth rate, market share by manufacturers and by region (region level and country level), from 2017 to 2022, and forecast to 2028.
The authors of this study have enlightened the readers on the rise and effect of the Covid-19 outbreak on the development. They have investigated the changes brought about in the demand/supply side, consumption, supply chain, and production/manufacturing. The readers will get familiar with the measures that have helped the key players to bring the Wood-Pellets market back to the pre-covid levels.
In this segment of the report, the specialists have delved into the key growth opportunities that are likely to emerge. This will aid the key players to simplify complex issues related to business and frame future strategies to compete in this competitive environment. This section will certainly assist the players to boldly position their business.
In this section of the report, the researchers have done a comprehensive analysis of the prominent players operating and the strategies they are focusing on to combat the intense competition. Company profiles and share analysis of the prominent players are also provided in this section. They have also provided reliable sales and revenue data of the manufacturers for the period 2017-2022. With the assistance of this report, key players, stakeholders, and other participants will be able to stay abreast of the recent and upcoming developments in the business, further enabling them to make efficient choices. Mentioned below are the prime players taken into account in this research report:
|
Report Metric |
Details |
|
Base Year: |
2021 |
|
Market Size in 2022: |
USD 6269.1 Million |
|
Forecast Period: |
2022 to 2028 |
|
Forecast Period 2022 to 2028 CAGR: |
6.1% |
|
2028 Value Projection: |
USD 8943.2 Million |
|
No. of Pages: |
125 |
|
Tables & Figures |
151 |
|
Segments covered: |
Type, Application, Region |
Ans. The market size of wood-pellets surpassed USD 6269.1 million in 2022 and will witness a CAGR of over 6.1% through 2028.
Ans. The expansion of the wood-pellet market is fueled by rising interest in and preference for renewable and sustainable energy sources. Wood pallets are utilized in industry for power generation as well as in civil applications such as home heating and pellet stoves.
Ans. The wood-pellets market is segmented on the basis of type, application, and region.
Ans. The wood-pellets market is projected to reach USD 8943.2 million by 2028.
Ans. Based on region, Europe is expected to hold the largest market share of about 57% of the global market, while North America and China held about 21%, 8% respectively.
Ans. Based on type, the White pellet is expected to hold the largest market share of about 97% during the forecast period.
Table of Content
1 Study Coverage
1.1 Wood-Pellets Product Introduction
1.2 Market by Type
1.2.1 Global Wood-Pellets Market Size by Type, 2017 VS 2021 VS 2028
1.2.2 White Pellet
1.2.3 Black Pellet
1.3 Market by Application
1.3.1 Global Wood-Pellets Market Size by Application, 2017 VS 2021 VS 2028
1.3.2 Power Generation
1.3.3 Industrial Furnace
1.3.4 Civil Use
1.3.5 Others
1.4 Study Objectives
1.5 Years Considered
2 Global Wood-Pellets Production
2.1 Global Wood-Pellets Production Capacity (2017-2028)
2.2 Global Wood-Pellets Production by Region: 2017 VS 2021 VS 2028
2.3 Global Wood-Pellets Production by Region
2.3.1 Global Wood-Pellets Historic Production by Region (2017-2022)
2.3.2 Global Wood-Pellets Forecasted Production by Region (2023-2028)
2.4 North America
2.5 Europe
2.6 China
2.7 Japan
3 Global Wood-Pellets Sales in Volume & Value Estimates and Forecasts
3.1 Global Wood-Pellets Sales Estimates and Forecasts 2017-2028
3.2 Global Wood-Pellets Revenue Estimates and Forecasts 2017-2028
3.3 Global Wood-Pellets Revenue by Region: 2017 VS 2021 VS 2028
3.4 Global Wood-Pellets Sales by Region
3.4.1 Global Wood-Pellets Sales by Region (2017-2022)
3.4.2 Global Sales Wood-Pellets by Region (2023-2028)
3.5 Global Wood-Pellets Revenue by Region
3.5.1 Global Wood-Pellets Revenue by Region (2017-2022)
3.5.2 Global Wood-Pellets Revenue by Region (2023-2028)
3.6 North America
3.7 Europe
3.8 Asia-Pacific
3.9 Latin America
3.10 Middle East & Africa
4 Competition by Manufactures
4.1 Global Wood-Pellets Production Capacity by Manufacturers
4.2 Global Wood-Pellets Sales by Manufacturers
4.2.1 Global Wood-Pellets Sales by Manufacturers (2017-2022)
4.2.2 Global Wood-Pellets Sales Market Share by Manufacturers (2017-2022)
4.2.3 Global Top 10 and Top 5 Largest Manufacturers of Wood-Pellets in 2021
4.3 Global Wood-Pellets Revenue by Manufacturers
4.3.1 Global Wood-Pellets Revenue by Manufacturers (2017-2022)
4.3.2 Global Wood-Pellets Revenue Market Share by Manufacturers (2017-2022)
4.3.3 Global Top 10 and Top 5 Companies by Wood-Pellets Revenue in 2021
4.4 Global Wood-Pellets Sales Price by Manufacturers
4.5 Analysis of Competitive Landscape
4.5.1 Manufacturers Market Concentration Ratio (CR5 and HHI)
4.5.2 Global Wood-Pellets Market Share by Company Type (Tier 1, Tier 2, and Tier 3)
4.5.3 Global Wood-Pellets Manufacturers Geographical Distribution
4.6 Mergers & Acquisitions, Expansion Plans
5 Market Size by Type
5.1 Global Wood-Pellets Sales by Type
5.1.1 Global Wood-Pellets Historical Sales by Type (2017-2022)
5.1.2 Global Wood-Pellets Forecasted Sales by Type (2023-2028)
5.1.3 Global Wood-Pellets Sales Market Share by Type (2017-2028)
5.2 Global Wood-Pellets Revenue by Type
5.2.1 Global Wood-Pellets Historical Revenue by Type (2017-2022)
5.2.2 Global Wood-Pellets Forecasted Revenue by Type (2023-2028)
5.2.3 Global Wood-Pellets Revenue Market Share by Type (2017-2028)
5.3 Global Wood-Pellets Price by Type
5.3.1 Global Wood-Pellets Price by Type (2017-2022)
5.3.2 Global Wood-Pellets Price Forecast by Type (2023-2028)
6 Market Size by Application
6.1 Global Wood-Pellets Sales by Application
6.1.1 Global Wood-Pellets Historical Sales by Application (2017-2022)
6.1.2 Global Wood-Pellets Forecasted Sales by Application (2023-2028)
6.1.3 Global Wood-Pellets Sales Market Share by Application (2017-2028)
6.2 Global Wood-Pellets Revenue by Application
6.2.1 Global Wood-Pellets Historical Revenue by Application (2017-2022)
6.2.2 Global Wood-Pellets Forecasted Revenue by Application (2023-2028)
6.2.3 Global Wood-Pellets Revenue Market Share by Application (2017-2028)
6.3 Global Wood-Pellets Price by Application
6.3.1 Global Wood-Pellets Price by Application (2017-2022)
6.3.2 Global Wood-Pellets Price Forecast by Application (2023-2028)
7 North America
7.1 North America Wood-Pellets Market Size by Type
7.1.1 North America Wood-Pellets Sales by Type (2017-2028)
7.1.2 North America Wood-Pellets Revenue by Type (2017-2028)
7.2 North America Wood-Pellets Market Size by Application
7.2.1 North America Wood-Pellets Sales by Application (2017-2028)
7.2.2 North America Wood-Pellets Revenue by Application (2017-2028)
7.3 North America Wood-Pellets Sales by Country
7.3.1 North America Wood-Pellets Sales by Country (2017-2028)
7.3.2 North America Wood-Pellets Revenue by Country (2017-2028)
7.3.3 U.S.
7.3.4 Canada
8 Europe
8.1 Europe Wood-Pellets Market Size by Type
8.1.1 Europe Wood-Pellets Sales by Type (2017-2028)
8.1.2 Europe Wood-Pellets Revenue by Type (2017-2028)
8.2 Europe Wood-Pellets Market Size by Application
8.2.1 Europe Wood-Pellets Sales by Application (2017-2028)
8.2.2 Europe Wood-Pellets Revenue by Application (2017-2028)
8.3 Europe Wood-Pellets Sales by Country
8.3.1 Europe Wood-Pellets Sales by Country (2017-2028)
8.3.2 Europe Wood-Pellets Revenue by Country (2017-2028)
8.3.3 Germany
8.3.4 France
8.3.5 U.K.
8.3.6 Italy
8.3.7 Russia
9 Asia Pacific
9.1 Asia Pacific Wood-Pellets Market Size by Type
9.1.1 Asia Pacific Wood-Pellets Sales by Type (2017-2028)
9.1.2 Asia Pacific Wood-Pellets Revenue by Type (2017-2028)
9.2 Asia Pacific Wood-Pellets Market Size by Application
9.2.1 Asia Pacific Wood-Pellets Sales by Application (2017-2028)
9.2.2 Asia Pacific Wood-Pellets Revenue by Application (2017-2028)
9.3 Asia Pacific Wood-Pellets Sales by Region
9.3.1 Asia Pacific Wood-Pellets Sales by Region (2017-2028)
9.3.2 Asia Pacific Wood-Pellets Revenue by Region (2017-2028)
9.3.3 China
9.3.4 Japan
9.3.5 South Korea
9.3.6 India
9.3.7 Australia
9.3.8 Taiwan
9.3.9 Indonesia
9.3.10 Thailand
9.3.11 Malaysia
9.3.12 Philippines
10 Latin America
10.1 Latin America Wood-Pellets Market Size by Type
10.1.1 Latin America Wood-Pellets Sales by Type (2017-2028)
10.1.2 Latin America Wood-Pellets Revenue by Type (2017-2028)
10.2 Latin America Wood-Pellets Market Size by Application
10.2.1 Latin America Wood-Pellets Sales by Application (2017-2028)
10.2.2 Latin America Wood-Pellets Revenue by Application (2017-2028)
10.3 Latin America Wood-Pellets Sales by Country
10.3.1 Latin America Wood-Pellets Sales by Country (2017-2028)
10.3.2 Latin America Wood-Pellets Revenue by Country (2017-2028)
10.3.3 Mexico
10.3.4 Brazil
10.3.5 Argentina
11 Middle East and Africa
11.1 Middle East and Africa Wood-Pellets Market Size by Type
11.1.1 Middle East and Africa Wood-Pellets Sales by Type (2017-2028)
11.1.2 Middle East and Africa Wood-Pellets Revenue by Type (2017-2028)
11.2 Middle East and Africa Wood-Pellets Market Size by Application
11.2.1 Middle East and Africa Wood-Pellets Sales by Application (2017-2028)
11.2.2 Middle East and Africa Wood-Pellets Revenue by Application (2017-2028)
11.3 Middle East and Africa Wood-Pellets Sales by Country
11.3.1 Middle East and Africa Wood-Pellets Sales by Country (2017-2028)
11.3.2 Middle East and Africa Wood-Pellets Revenue by Country (2017-2028)
11.3.3 Turkey
11.3.4 Saudi Arabia
11.3.5 U.A.E
12 Corporate Profiles
12.1 Enviva
12.1.1 Enviva Corporation Information
12.1.2 Enviva Overview
12.1.3 Enviva Wood-Pellets Sales, Price, Revenue and Gross Margin (2017-2022)
12.1.4 Enviva Wood-Pellets Product Model Numbers, Pictures, Descriptions and Specifications
12.1.5 Enviva Recent Developments
12.2 Pinnacle
12.2.1 Pinnacle Corporation Information
12.2.2 Pinnacle Overview
12.2.3 Pinnacle Wood-Pellets Sales, Price, Revenue and Gross Margin (2017-2022)
12.2.4 Pinnacle Wood-Pellets Product Model Numbers, Pictures, Descriptions and Specifications
12.2.5 Pinnacle Recent Developments
12.3 Vyborgskaya Cellulose
12.3.1 Vyborgskaya Cellulose Corporation Information
12.3.2 Vyborgskaya Cellulose Overview
12.3.3 Vyborgskaya Cellulose Wood-Pellets Sales, Price, Revenue and Gross Margin (2017-2022)
12.3.4 Vyborgskaya Cellulose Wood-Pellets Product Model Numbers, Pictures, Descriptions and Specifications
12.3.5 Vyborgskaya Cellulose Recent Developments
12.4 Rentech
12.4.1 Rentech Corporation Information
12.4.2 Rentech Overview
12.4.3 Rentech Wood-Pellets Sales, Price, Revenue and Gross Margin (2017-2022)
12.4.4 Rentech Wood-Pellets Product Model Numbers, Pictures, Descriptions and Specifications
12.4.5 Rentech Recent Developments
12.5 Innogy
12.5.1 Innogy Corporation Information
12.5.2 Innogy Overview
12.5.3 Innogy Wood-Pellets Sales, Price, Revenue and Gross Margin (2017-2022)
12.5.4 Innogy Wood-Pellets Product Model Numbers, Pictures, Descriptions and Specifications
12.5.5 Innogy Recent Developments
12.6 Graanul Invest Group
12.6.1 Graanul Invest Group Corporation Information
12.6.2 Graanul Invest Group Overview
12.6.3 Graanul Invest Group Wood-Pellets Sales, Price, Revenue and Gross Margin (2017-2022)
12.6.4 Graanul Invest Group Wood-Pellets Product Model Numbers, Pictures, Descriptions and Specifications
12.6.5 Graanul Invest Group Recent Developments
12.7 Zilkha Biomass Energy
12.7.1 Zilkha Biomass Energy Corporation Information
12.7.2 Zilkha Biomass Energy Overview
12.7.3 Zilkha Biomass Energy Wood-Pellets Sales, Price, Revenue and Gross Margin (2017-2022)
12.7.4 Zilkha Biomass Energy Wood-Pellets Product Model Numbers, Pictures, Descriptions and Specifications
12.7.5 Zilkha Biomass Energy Recent Developments
12.8 Canfor
12.8.1 Canfor Corporation Information
12.8.2 Canfor Overview
12.8.3 Canfor Wood-Pellets Sales, Price, Revenue and Gross Margin (2017-2022)
12.8.4 Canfor Wood-Pellets Product Model Numbers, Pictures, Descriptions and Specifications
12.8.5 Canfor Recent Developments
12.9 General Biofuels
12.9.1 General Biofuels Corporation Information
12.9.2 General Biofuels Overview
12.9.3 General Biofuels Wood-Pellets Sales, Price, Revenue and Gross Margin (2017-2022)
12.9.4 General Biofuels Wood-Pellets Product Model Numbers, Pictures, Descriptions and Specifications
12.9.5 General Biofuels Recent Developments
12.10 Pacific BioEnergy
12.10.1 Pacific BioEnergy Corporation Information
12.10.2 Pacific BioEnergy Overview
12.10.3 Pacific BioEnergy Wood-Pellets Sales, Price, Revenue and Gross Margin (2017-2022)
12.10.4 Pacific BioEnergy Wood-Pellets Product Model Numbers, Pictures, Descriptions and Specifications
12.10.5 Pacific BioEnergy Recent Developments
12.11 Protocol Energy
12.11.1 Protocol Energy Corporation Information
12.11.2 Protocol Energy Overview
12.11.3 Protocol Energy Wood-Pellets Sales, Price, Revenue and Gross Margin (2017-2022)
12.11.4 Protocol Energy Wood-Pellets Product Model Numbers, Pictures, Descriptions and Specifications
12.11.5 Protocol Energy Recent Developments
12.12 PFEIFER
12.12.1 PFEIFER Corporation Information
12.12.2 PFEIFER Overview
12.12.3 PFEIFER Wood-Pellets Sales, Price, Revenue and Gross Margin (2017-2022)
12.12.4 PFEIFER Wood-Pellets Product Model Numbers, Pictures, Descriptions and Specifications
12.12.5 PFEIFER Recent Developments
12.13 Biomass Secure Power
12.13.1 Biomass Secure Power Corporation Information
12.13.2 Biomass Secure Power Overview
12.13.3 Biomass Secure Power Wood-Pellets Sales, Price, Revenue and Gross Margin (2017-2022)
12.13.4 Biomass Secure Power Wood-Pellets Product Model Numbers, Pictures, Descriptions and Specifications
12.13.5 Biomass Secure Power Recent Developments
12.14 Viridis Energy
12.14.1 Viridis Energy Corporation Information
12.14.2 Viridis Energy Overview
12.14.3 Viridis Energy Wood-Pellets Sales, Price, Revenue and Gross Margin (2017-2022)
12.14.4 Viridis Energy Wood-Pellets Product Model Numbers, Pictures, Descriptions and Specifications
12.14.5 Viridis Energy Recent Developments
12.15 Westervelt
12.15.1 Westervelt Corporation Information
12.15.2 Westervelt Overview
12.15.3 Westervelt Wood-Pellets Sales, Price, Revenue and Gross Margin (2017-2022)
12.15.4 Westervelt Wood-Pellets Product Model Numbers, Pictures, Descriptions and Specifications
12.15.5 Westervelt Recent Developments
12.16 BTH Quitman Hickory
12.16.1 BTH Quitman Hickory Corporation Information
12.16.2 BTH Quitman Hickory Overview
12.16.3 BTH Quitman Hickory Wood-Pellets Sales, Price, Revenue and Gross Margin (2017-2022)
12.16.4 BTH Quitman Hickory Wood-Pellets Product Model Numbers, Pictures, Descriptions and Specifications
12.16.5 BTH Quitman Hickory Recent Developments
12.17 Energex
12.17.1 Energex Corporation Information
12.17.2 Energex Overview
12.17.3 Energex Wood-Pellets Sales, Price, Revenue and Gross Margin (2017-2022)
12.17.4 Energex Wood-Pellets Product Model Numbers, Pictures, Descriptions and Specifications
12.17.5 Energex Recent Developments
12.18 Lignetics
12.18.1 Lignetics Corporation Information
12.18.2 Lignetics Overview
12.18.3 Lignetics Wood-Pellets Sales, Price, Revenue and Gross Margin (2017-2022)
12.18.4 Lignetics Wood-Pellets Product Model Numbers, Pictures, Descriptions and Specifications
12.18.5 Lignetics Recent Developments
12.19 Equustock
12.19.1 Equustock Corporation Information
12.19.2 Equustock Overview
12.19.3 Equustock Wood-Pellets Sales, Price, Revenue and Gross Margin (2017-2022)
12.19.4 Equustock Wood-Pellets Product Model Numbers, Pictures, Descriptions and Specifications
12.19.5 Equustock Recent Developments
12.20 Fram Renewable Fuels
12.20.1 Fram Renewable Fuels Corporation Information
12.20.2 Fram Renewable Fuels Overview
12.20.3 Fram Renewable Fuels Wood-Pellets Sales, Price, Revenue and Gross Margin (2017-2022)
12.20.4 Fram Renewable Fuels Wood-Pellets Product Model Numbers, Pictures, Descriptions and Specifications
12.20.5 Fram Renewable Fuels Recent Developments
12.21 RusForest
12.21.1 RusForest Corporation Information
12.21.2 RusForest Overview
12.21.3 RusForest Wood-Pellets Sales, Price, Revenue and Gross Margin (2017-2022)
12.21.4 RusForest Wood-Pellets Product Model Numbers, Pictures, Descriptions and Specifications
12.21.5 RusForest Recent Developments
12.22 Neova
12.22.1 Neova Corporation Information
12.22.2 Neova Overview
12.22.3 Neova Wood-Pellets Sales, Price, Revenue and Gross Margin (2017-2022)
12.22.4 Neova Wood-Pellets Product Model Numbers, Pictures, Descriptions and Specifications
12.22.5 Neova Recent Developments
12.23 Drax Biomass International
12.23.1 Drax Biomass International Corporation Information
12.23.2 Drax Biomass International Overview
12.23.3 Drax Biomass International Wood-Pellets Sales, Price, Revenue and Gross Margin (2017-2022)
12.23.4 Drax Biomass International Wood-Pellets Product Model Numbers, Pictures, Descriptions and Specifications
12.23.5 Drax Biomass International Recent Developments
12.24 Enova Energy Group
12.24.1 Enova Energy Group Corporation Information
12.24.2 Enova Energy Group Overview
12.24.3 Enova Energy Group Wood-Pellets Sales, Price, Revenue and Gross Margin (2017-2022)
12.24.4 Enova Energy Group Wood-Pellets Product Model Numbers, Pictures, Descriptions and Specifications
12.24.5 Enova Energy Group Recent Developments
12.25 Aoke Ruifeng
12.25.1 Aoke Ruifeng Corporation Information
12.25.2 Aoke Ruifeng Overview
12.25.3 Aoke Ruifeng Wood-Pellets Sales, Price, Revenue and Gross Margin (2017-2022)
12.25.4 Aoke Ruifeng Wood-Pellets Product Model Numbers, Pictures, Descriptions and Specifications
12.25.5 Aoke Ruifeng Recent Developments
12.26 DEVOTION
12.26.1 DEVOTION Corporation Information
12.26.2 DEVOTION Overview
12.26.3 DEVOTION Wood-Pellets Sales, Price, Revenue and Gross Margin (2017-2022)
12.26.4 DEVOTION Wood-Pellets Product Model Numbers, Pictures, Descriptions and Specifications
12.26.5 DEVOTION Recent Developments
12.27 Dalin Biological
12.27.1 Dalin Biological Corporation Information
12.27.2 Dalin Biological Overview
12.27.3 Dalin Biological Wood-Pellets Sales, Price, Revenue and Gross Margin (2017-2022)
12.27.4 Dalin Biological Wood-Pellets Product Model Numbers, Pictures, Descriptions and Specifications
12.27.5 Dalin Biological Recent Developments
12.28 Senon Renewable Energy
12.28.1 Senon Renewable Energy Corporation Information
12.28.2 Senon Renewable Energy Overview
12.28.3 Senon Renewable Energy Wood-Pellets Sales, Price, Revenue and Gross Margin (2017-2022)
12.28.4 Senon Renewable Energy Wood-Pellets Product Model Numbers, Pictures, Descriptions and Specifications
12.28.5 Senon Renewable Energy Recent Developments
12.29 Xirui New Energy
12.29.1 Xirui New Energy Corporation Information
12.29.2 Xirui New Energy Overview
12.29.3 Xirui New Energy Wood-Pellets Sales, Price, Revenue and Gross Margin (2017-2022)
12.29.4 Xirui New Energy Wood-Pellets Product Model Numbers, Pictures, Descriptions and Specifications
12.29.5 Xirui New Energy Recent Developments
12.30 Weige Bio-tech Energy
12.30.1 Weige Bio-tech Energy Corporation Information
12.30.2 Weige Bio-tech Energy Overview
12.30.3 Weige Bio-tech Energy Wood-Pellets Sales, Price, Revenue and Gross Margin (2017-2022)
12.30.4 Weige Bio-tech Energy Wood-Pellets Product Model Numbers, Pictures, Descriptions and Specifications
12.30.5 Weige Bio-tech Energy Recent Developments
13 Industry Chain and Sales Channels Analysis
13.1 Wood-Pellets Industry Chain Analysis
13.2 Wood-Pellets Key Raw Materials
13.2.1 Key Raw Materials
13.2.2 Raw Materials Key Suppliers
13.3 Wood-Pellets Production Mode & Process
13.4 Wood-Pellets Sales and Marketing
13.4.1 Wood-Pellets Sales Channels
13.4.2 Wood-Pellets Distributors
13.5 Wood-Pellets Customers
14 Market Drivers, Opportunities, Challenges and Risks Factors Analysis
14.1 Wood-Pellets Industry Trends
14.2 Wood-Pellets Market Drivers
14.3 Wood-Pellets Market Challenges
14.4 Wood-Pellets Market Restraints
15 Key Finding in The Global Wood-Pellets Study
16 Appendix
16.1 Research Methodology
16.1.1 Methodology/Research Approach
16.1.2 Data Source
16.2 Author Details
16.3 Disclaimer
Table 1. Global Wood-Pellets Market Size Growth Rate by Type, 2017 VS 2021 VS 2028 (US$ Million)
Table 2. Major Manufacturers of White Pellet
Table 3. Major Manufacturers of Black Pellet
Table 4. Global Wood-Pellets Market Size Growth Rate by Application, 2017 VS 2021 2028 (US$ Million)
Table 5. Global Wood-Pellets Production by Region: 2017 VS 2021 VS 2028 (K MT)
Table 6. Global Wood-Pellets Production by Region (2017-2022) & (K MT)
Table 7. Global Wood-Pellets Production Market Share by Region (2017-2022)
Table 8. Global Wood-Pellets Production by Region (2023-2028) & (K MT)
Table 9. Global Wood-Pellets Production Market Share by Region (2023-2028)
Table 10. Global Wood-Pellets Revenue by Region: 2017 VS 2021 VS 2028 (US$ Million)
Table 11. Global Wood-Pellets Sales by Region (2017-2022) & (K MT)
Table 12. Global Wood-Pellets Sales Market Share by Region (2017-2022)
Table 13. Global Wood-Pellets Sales by Region (2023-2028) & (K MT)
Table 14. Global Wood-Pellets Sales Market Share by Region (2023-2028)
Table 15. Global Wood-Pellets Revenue by Region (2017-2022) & (US$ Million)
Table 16. Global Wood-Pellets Revenue Market Share by Region (2017-2022)
Table 17. Global Wood-Pellets Revenue by Region (2023-2028) & (US$ Million)
Table 18. Global Wood-Pellets Revenue Market Share by Region (2023-2028)
Table 19. Global Wood-Pellets Production Capacity by Manufacturers (2017-2022) & (K MT)
Table 20. Global Wood-Pellets Capacity Market Share by Manufacturers (2017-2022)
Table 21. Global Wood-Pellets Sales by Manufacturers (2017-2022) & (K MT)
Table 22. Global Wood-Pellets Sales Market Share by Manufacturers (2017-2022)
Table 23. Global Wood-Pellets Revenue by Manufacturers (2017-2022) & (US$ Million)
Table 24. Global Wood-Pellets Revenue Share by Manufacturers (2017-2022)
Table 25. Wood-Pellets Price by Manufacturers 2017-2022 (USD/MT)
Table 26. Global Wood-Pellets Manufacturers Market Concentration Ratio (CR5 and HHI)
Table 27. Global Wood-Pellets by Company Type (Tier 1, Tier 2, and Tier 3) & (based on the Revenue in Wood-Pellets as of 2021)
Table 28. Wood-Pellets Manufacturing Base Distribution and Headquarters
Table 29. Manufacturers Wood-Pellets Product Offered
Table 30. Date of Manufacturers Enter into Wood-Pellets Market
Table 31. Mergers & Acquisitions, Expansion Plans
Table 32. Global Wood-Pellets Sales by Type (2017-2022) & (K MT)
Table 33. Global Wood-Pellets Sales by Type (2023-2028) & (K MT)
Table 34. Global Wood-Pellets Sales Share by Type (2017-2022)
Table 35. Global Wood-Pellets Sales Share by Type (2023-2028)
Table 36. Global Wood-Pellets Revenue by Type (2017-2022) & (US$ Million)
Table 37. Global Wood-Pellets Revenue by Type (2023-2028) & (US$ Million)
Table 38. Global Wood-Pellets Revenue Share by Type (2017-2022)
Table 39. Global Wood-Pellets Revenue Share by Type (2023-2028)
Table 40. Wood-Pellets Price by Type (2017-2022) & (USD/MT)
Table 41. Global Wood-Pellets Price Forecast by Type (2023-2028) & (USD/MT)
Table 42. Global Wood-Pellets Sales by Application (2017-2022) & (K MT)
Table 43. Global Wood-Pellets Sales by Application (2023-2028) & (K MT)
Table 44. Global Wood-Pellets Sales Share by Application (2017-2022)
Table 45. Global Wood-Pellets Sales Share by Application (2023-2028)
Table 46. Global Wood-Pellets Revenue by Application (2017-2022) & (US$ Million)
Table 47. Global Wood-Pellets Revenue by Application (2023-2028) & (US$ Million)
Table 48. Global Wood-Pellets Revenue Share by Application (2017-2022)
Table 49. Global Wood-Pellets Revenue Share by Application (2023-2028)
Table 50. Wood-Pellets Price by Application (2017-2022) & (USD/MT)
Table 51. Global Wood-Pellets Price Forecast by Application (2023-2028) & (USD/MT)
Table 52. North America Wood-Pellets Sales by Type (2017-2022) & (K MT)
Table 53. North America Wood-Pellets Sales by Type (2023-2028) & (K MT)
Table 54. North America Wood-Pellets Revenue by Type (2017-2022) & (US$ Million)
Table 55. North America Wood-Pellets Revenue by Type (2023-2028) & (US$ Million)
Table 56. North America Wood-Pellets Sales by Application (2017-2022) & (K MT)
Table 57. North America Wood-Pellets Sales by Application (2023-2028) & (K MT)
Table 58. North America Wood-Pellets Revenue by Application (2017-2022) & (US$ Million)
Table 59. North America Wood-Pellets Revenue by Application (2023-2028) & (US$ Million)
Table 60. North America Wood-Pellets Sales by Country (2017-2022) & (K MT)
Table 61. North America Wood-Pellets Sales by Country (2023-2028) & (K MT)
Table 62. North America Wood-Pellets Revenue by Country (2017-2022) & (US$ Million)
Table 63. North America Wood-Pellets Revenue by Country (2023-2028) & (US$ Million)
Table 64. Europe Wood-Pellets Sales by Type (2017-2022) & (K MT)
Table 65. Europe Wood-Pellets Sales by Type (2023-2028) & (K MT)
Table 66. Europe Wood-Pellets Revenue by Type (2017-2022) & (US$ Million)
Table 67. Europe Wood-Pellets Revenue by Type (2023-2028) & (US$ Million)
Table 68. Europe Wood-Pellets Sales by Application (2017-2022) & (K MT)
Table 69. Europe Wood-Pellets Sales by Application (2023-2028) & (K MT)
Table 70. Europe Wood-Pellets Revenue by Application (2017-2022) & (US$ Million)
Table 71. Europe Wood-Pellets Revenue by Application (2023-2028) & (US$ Million)
Table 72. Europe Wood-Pellets Sales by Country (2017-2022) & (K MT)
Table 73. Europe Wood-Pellets Sales by Country (2023-2028) & (K MT)
Table 74. Europe Wood-Pellets Revenue by Country (2017-2022) & (US$ Million)
Table 75. Europe Wood-Pellets Revenue by Country (2023-2028) & (US$ Million)
Table 76. Asia Pacific Wood-Pellets Sales by Type (2017-2022) & (K MT)
Table 77. Asia Pacific Wood-Pellets Sales by Type (2023-2028) & (K MT)
Table 78. Asia Pacific Wood-Pellets Revenue by Type (2017-2022) & (US$ Million)
Table 79. Asia Pacific Wood-Pellets Revenue by Type (2023-2028) & (US$ Million)
Table 80. Asia Pacific Wood-Pellets Sales by Application (2017-2022) & (K MT)
Table 81. Asia Pacific Wood-Pellets Sales by Application (2023-2028) & (K MT)
Table 82. Asia Pacific Wood-Pellets Revenue by Application (2017-2022) & (US$ Million)
Table 83. Asia Pacific Wood-Pellets Revenue by Application (2023-2028) & (US$ Million)
Table 84. Asia Pacific Wood-Pellets Sales by Region (2017-2022) & (K MT)
Table 85. Asia Pacific Wood-Pellets Sales by Region (2023-2028) & (K MT)
Table 86. Asia Pacific Wood-Pellets Revenue by Region (2017-2022) & (US$ Million)
Table 87. Asia Pacific Wood-Pellets Revenue by Region (2023-2028) & (US$ Million)
Table 88. Latin America Wood-Pellets Sales by Type (2017-2022) & (K MT)
Table 89. Latin America Wood-Pellets Sales by Type (2023-2028) & (K MT)
Table 90. Latin America Wood-Pellets Revenue by Type (2017-2022) & (US$ Million)
Table 91. Latin America Wood-Pellets Revenue by Type (2023-2028) & (US$ Million)
Table 92. Latin America Wood-Pellets Sales by Application (2017-2022) & (K MT)
Table 93. Latin America Wood-Pellets Sales by Application (2023-2028) & (K MT)
Table 94. Latin America Wood-Pellets Revenue by Application (2017-2022) & (US$ Million)
Table 95. Latin America Wood-Pellets Revenue by Application (2023-2028) & (US$ Million)
Table 96. Latin America Wood-Pellets Sales by Country (2017-2022) & (K MT)
Table 97. Latin America Wood-Pellets Sales by Country (2023-2028) & (K MT)
Table 98. Latin America Wood-Pellets Revenue by Country (2017-2022) & (US$ Million)
Table 99. Latin America Wood-Pellets Revenue by Country (2023-2028) & (US$ Million)
Table 100. Middle East and Africa Wood-Pellets Sales by Type (2017-2022) & (K MT)
Table 101. Middle East and Africa Wood-Pellets Sales by Type (2023-2028) & (K MT)
Table 102. Middle East and Africa Wood-Pellets Revenue by Type (2017-2022) & (US$ Million)
Table 103. Middle East and Africa Wood-Pellets Revenue by Type (2023-2028) & (US$ Million)
Table 104. Middle East and Africa Wood-Pellets Sales by Application (2017-2022) & (K MT)
Table 105. Middle East and Africa Wood-Pellets Sales by Application (2023-2028) & (K MT)
Table 106. Middle East and Africa Wood-Pellets Revenue by Application (2017-2022) & (US$ Million)
Table 107. Middle East and Africa Wood-Pellets Revenue by Application (2023-2028) & (US$ Million)
Table 108. Middle East and Africa Wood-Pellets Sales by Country (2017-2022) & (K MT)
Table 109. Middle East and Africa Wood-Pellets Sales by Country (2023-2028) & (K MT)
Table 110. Middle East and Africa Wood-Pellets Revenue by Country (2017-2022) & (US$ Million)
Table 111. Middle East and Africa Wood-Pellets Revenue by Country (2023-2028) & (US$ Million)
Table 112. Enviva Corporation Information
Table 113. Enviva Description and Major Businesses
Table 114. Enviva Wood-Pellets Sales (K MT), Revenue (US$ Million), Price (USD/MT) and Gross Margin (2017-2022)
Table 115. Enviva Wood-Pellets Product Model Numbers, Pictures, Descriptions and Specifications
Table 116. Enviva Recent Development
Table 117. Pinnacle Corporation Information
Table 118. Pinnacle Description and Major Businesses
Table 119. Pinnacle Wood-Pellets Sales (K MT), Revenue (US$ Million), Price (USD/MT) and Gross Margin (2017-2022)
Table 120. Pinnacle Wood-Pellets Product Model Numbers, Pictures, Descriptions and Specifications
Table 121. Pinnacle Recent Development
Table 122. Vyborgskaya Cellulose Corporation Information
Table 123. Vyborgskaya Cellulose Description and Major Businesses
Table 124. Vyborgskaya Cellulose Wood-Pellets Sales (K MT), Revenue (US$ Million), Price (USD/MT) and Gross Margin (2017-2022)
Table 125. Vyborgskaya Cellulose Wood-Pellets Product Model Numbers, Pictures, Descriptions and Specifications
Table 126. Vyborgskaya Cellulose Recent Development
Table 127. Rentech Corporation Information
Table 128. Rentech Description and Major Businesses
Table 129. Rentech Wood-Pellets Sales (K MT), Revenue (US$ Million), Price (USD/MT) and Gross Margin (2017-2022)
Table 130. Rentech Wood-Pellets Product Model Numbers, Pictures, Descriptions and Specifications
Table 131. Rentech Recent Development
Table 132. Innogy Corporation Information
Table 133. Innogy Description and Major Businesses
Table 134. Innogy Wood-Pellets Sales (K MT), Revenue (US$ Million), Price (USD/MT) and Gross Margin (2017-2022)
Table 135. Innogy Wood-Pellets Product Model Numbers, Pictures, Descriptions and Specifications
Table 136. Innogy Recent Development
Table 137. Graanul Invest Group Corporation Information
Table 138. Graanul Invest Group Description and Major Businesses
Table 139. Graanul Invest Group Wood-Pellets Sales (K MT), Revenue (US$ Million), Price (USD/MT) and Gross Margin (2017-2022)
Table 140. Graanul Invest Group Wood-Pellets Product Model Numbers, Pictures, Descriptions and Specifications
Table 141. Graanul Invest Group Recent Development
Table 142. Zilkha Biomass Energy Corporation Information
Table 143. Zilkha Biomass Energy Description and Major Businesses
Table 144. Zilkha Biomass Energy Wood-Pellets Sales (K MT), Revenue (US$ Million), Price (USD/MT) and Gross Margin (2017-2022)
Table 145. Zilkha Biomass Energy Wood-Pellets Product Model Numbers, Pictures, Descriptions and Specifications
Table 146. Zilkha Biomass Energy Recent Development
Table 147. Canfor Corporation Information
Table 148. Canfor Description and Major Businesses
Table 149. Canfor Wood-Pellets Sales (K MT), Revenue (US$ Million), Price (USD/MT) and Gross Margin (2017-2022)
Table 150. Canfor Wood-Pellets Product Model Numbers, Pictures, Descriptions and Specifications
Table 151. Canfor Recent Development
Table 152. General Biofuels Corporation Information
Table 153. General Biofuels Description and Major Businesses
Table 154. General Biofuels Wood-Pellets Sales (K MT), Revenue (US$ Million), Price (USD/MT) and Gross Margin (2017-2022)
Table 155. General Biofuels Wood-Pellets Product Model Numbers, Pictures, Descriptions and Specifications
Table 156. General Biofuels Recent Development
Table 157. Pacific BioEnergy Corporation Information
Table 158. Pacific BioEnergy Description and Major Businesses
Table 159. Pacific BioEnergy Wood-Pellets Sales (K MT), Revenue (US$ Million), Price (USD/MT) and Gross Margin (2017-2022)
Table 160. Pacific BioEnergy Wood-Pellets Product Model Numbers, Pictures, Descriptions and Specifications
Table 161. Pacific BioEnergy Recent Development
Table 162. Protocol Energy Corporation Information
Table 163. Protocol Energy Description and Major Businesses
Table 164. Protocol Energy Wood-Pellets Sales (K MT), Revenue (US$ Million), Price (USD/MT) and Gross Margin (2017-2022)
Table 165. Protocol Energy Wood-Pellets Product Model Numbers, Pictures, Descriptions and Specifications
Table 166. Protocol Energy Recent Development
Table 167. PFEIFER Corporation Information
Table 168. PFEIFER Description and Major Businesses
Table 169. PFEIFER Wood-Pellets Sales (K MT), Revenue (US$ Million), Price (USD/MT) and Gross Margin (2017-2022)
Table 170. PFEIFER Wood-Pellets Product Model Numbers, Pictures, Descriptions and Specifications
Table 171. PFEIFER Recent Development
Table 172. Biomass Secure Power Corporation Information
Table 173. Biomass Secure Power Description and Major Businesses
Table 174. Biomass Secure Power Wood-Pellets Sales (K MT), Revenue (US$ Million), Price (USD/MT) and Gross Margin (2017-2022)
Table 175. Biomass Secure Power Wood-Pellets Product Model Numbers, Pictures, Descriptions and Specifications
Table 176. Biomass Secure Power Recent Development
Table 177. Viridis Energy Corporation Information
Table 178. Viridis Energy Description and Major Businesses
Table 179. Viridis Energy Wood-Pellets Sales (K MT), Revenue (US$ Million), Price (USD/MT) and Gross Margin (2017-2022)
Table 180. Viridis Energy Wood-Pellets Product Model Numbers, Pictures, Descriptions and Specifications
Table 181. Viridis Energy Recent Development
Table 182. Westervelt Corporation Information
Table 183. Westervelt Description and Major Businesses
Table 184. Westervelt Wood-Pellets Sales (K MT), Revenue (US$ Million), Price (USD/MT) and Gross Margin (2017-2022)
Table 185. Westervelt Wood-Pellets Product Model Numbers, Pictures, Descriptions and Specifications
Table 186. Westervelt Recent Development
Table 187. BTH Quitman Hickory Corporation Information
Table 188. BTH Quitman Hickory Description and Major Businesses
Table 189. BTH Quitman Hickory Wood-Pellets Sales (K MT), Revenue (US$ Million), Price (USD/MT) and Gross Margin (2017-2022)
Table 190. BTH Quitman Hickory Wood-Pellets Product Model Numbers, Pictures, Descriptions and Specifications
Table 191. BTH Quitman Hickory Recent Development
Table 192. Energex Corporation Information
Table 193. Energex Description and Major Businesses
Table 194. Energex Wood-Pellets Sales (K MT), Revenue (US$ Million), Price (USD/MT) and Gross Margin (2017-2022)
Table 195. Energex Wood-Pellets Product Model Numbers, Pictures, Descriptions and Specifications
Table 196. Energex Recent Development
Table 197. Lignetics Corporation Information
Table 198. Lignetics Description and Major Businesses
Table 199. Lignetics Wood-Pellets Sales (K MT), Revenue (US$ Million), Price (USD/MT) and Gross Margin (2017-2022)
Table 200. Lignetics Wood-Pellets Product Model Numbers, Pictures, Descriptions and Specifications
Table 201. Lignetics Recent Development
Table 202. Equustock Corporation Information
Table 203. Equustock Description and Major Businesses
Table 204. Equustock Wood-Pellets Sales (K MT), Revenue (US$ Million), Price (USD/MT) and Gross Margin (2017-2022)
Table 205. Equustock Wood-Pellets Product Model Numbers, Pictures, Descriptions and Specifications
Table 206. Equustock Recent Development
Table 207. Fram Renewable Fuels Corporation Information
Table 208. Fram Renewable Fuels Description and Major Businesses
Table 209. Fram Renewable Fuels Wood-Pellets Sales (K MT), Revenue (US$ Million), Price (USD/MT) and Gross Margin (2017-2022)
Table 210. Fram Renewable Fuels Wood-Pellets Product Model Numbers, Pictures, Descriptions and Specifications
Table 211. Fram Renewable Fuels Recent Development
Table 212. RusForest Corporation Information
Table 213. RusForest Description and Major Businesses
Table 214. RusForest Wood-Pellets Sales (K MT), Revenue (US$ Million), Price (USD/MT) and Gross Margin (2017-2022)
Table 215. RusForest Wood-Pellets Product Model Numbers, Pictures, Descriptions and Specifications
Table 216. RusForest Recent Development
Table 217. Neova Corporation Information
Table 218. Neova Description and Major Businesses
Table 219. Neova Wood-Pellets Sales (K MT), Revenue (US$ Million), Price (USD/MT) and Gross Margin (2017-2022)
Table 220. Neova Wood-Pellets Product Model Numbers, Pictures, Descriptions and Specifications
Table 221. Neova Recent Development
Table 222. Drax Biomass International Corporation Information
Table 223. Drax Biomass International Description and Major Businesses
Table 224. Drax Biomass International Wood-Pellets Sales (K MT), Revenue (US$ Million), Price (USD/MT) and Gross Margin (2017-2022)
Table 225. Drax Biomass International Wood-Pellets Product Model Numbers, Pictures, Descriptions and Specifications
Table 226. Drax Biomass International Recent Development
Table 227. Enova Energy Group Corporation Information
Table 228. Enova Energy Group Description and Major Businesses
Table 229. Enova Energy Group Wood-Pellets Sales (K MT), Revenue (US$ Million), Price (USD/MT) and Gross Margin (2017-2022)
Table 230. Enova Energy Group Wood-Pellets Product Model Numbers, Pictures, Descriptions and Specifications
Table 231. Enova Energy Group Recent Development
Table 232. Aoke Ruifeng Corporation Information
Table 233. Aoke Ruifeng Description and Major Businesses
Table 234. Aoke Ruifeng Wood-Pellets Sales (K MT), Revenue (US$ Million), Price (USD/MT) and Gross Margin (2017-2022)
Table 235. Aoke Ruifeng Wood-Pellets Product Model Numbers, Pictures, Descriptions and Specifications
Table 236. Aoke Ruifeng Recent Development
Table 237. DEVOTION Corporation Information
Table 238. DEVOTION Description and Major Businesses
Table 239. DEVOTION Wood-Pellets Sales (K MT), Revenue (US$ Million), Price (USD/MT) and Gross Margin (2017-2022)
Table 240. DEVOTION Wood-Pellets Product Model Numbers, Pictures, Descriptions and Specifications
Table 241. DEVOTION Recent Development
Table 242. Dalin Biological Corporation Information
Table 243. Dalin Biological Description and Major Businesses
Table 244. Dalin Biological Wood-Pellets Sales (K MT), Revenue (US$ Million), Price (USD/MT) and Gross Margin (2017-2022)
Table 245. Dalin Biological Wood-Pellets Product Model Numbers, Pictures, Descriptions and Specifications
Table 246. Dalin Biological Recent Development
Table 247. Senon Renewable Energy Corporation Information
Table 248. Senon Renewable Energy Description and Major Businesses
Table 249. Senon Renewable Energy Wood-Pellets Sales (K MT), Revenue (US$ Million), Price (USD/MT) and Gross Margin (2017-2022)
Table 250. Senon Renewable Energy Wood-Pellets Product Model Numbers, Pictures, Descriptions and Specifications
Table 251. Senon Renewable Energy Recent Development
Table 252. Xirui New Energy Corporation Information
Table 253. Xirui New Energy Description and Major Businesses
Table 254. Xirui New Energy Wood-Pellets Sales (K MT), Revenue (US$ Million), Price (USD/MT) and Gross Margin (2017-2022)
Table 255. Xirui New Energy Wood-Pellets Product Model Numbers, Pictures, Descriptions and Specifications
Table 256. Xirui New Energy Recent Development
Table 257. Weige Bio-tech Energy Corporation Information
Table 258. Weige Bio-tech Energy Description and Major Businesses
Table 259. Weige Bio-tech Energy Wood-Pellets Sales (K MT), Revenue (US$ Million), Price (USD/MT) and Gross Margin (2017-2022)
Table 260. Weige Bio-tech Energy Wood-Pellets Product Model Numbers, Pictures, Descriptions and Specifications
Table 261. Weige Bio-tech Energy Recent Development
Table 262. Key Raw Materials Lists
Table 263. Raw Materials Key Suppliers Lists
Table 264. Wood-Pellets Distributors List
Table 265. Wood-Pellets Customers List
Table 266. Wood-Pellets Market Trends
Table 267. Wood-Pellets Market Drivers
Table 268. Wood-Pellets Market Challenges
Table 269. Wood-Pellets Market Restraints
Table 270. Research Programs/Design for This Report
Table 271. Key Data Information from Secondary Sources
Table 272. Key Data Information from Primary Sources
List of Figures
Figure 1. Wood-Pellets Product Picture
Figure 2. Global Wood-Pellets Market Share by Type in 2021 & 2028
Figure 3. White Pellet Product Picture
Figure 4. Black Pellet Product Picture
Figure 5. Global Wood-Pellets Market Share by Application in 2021 & 2028
Figure 6. Power Generation
Figure 7. Industrial Furnace
Figure 8. Civil Use
Figure 9. Others
Figure 10. Wood-Pellets Report Years Considered
Figure 11. Global Wood-Pellets Capacity, Production and Utilization (2017-2028) & (K MT)
Figure 12. Global Wood-Pellets Production Market Share by Region in Percentage: 2021 Versus 2028
Figure 13. Global Wood-Pellets Production Market Share by Region (2017-2022)
Figure 14. Global Wood-Pellets Production Market Share by Region (2023-2028)
Figure 15. Wood-Pellets Production Growth Rate in North America (2017-2028) & (K MT)
Figure 16. Wood-Pellets Production Growth Rate in Europe (2017-2028) & (K MT)
Figure 17. Wood-Pellets Production Growth Rate in China (2017-2028) & (K MT)
Figure 18. Wood-Pellets Production Growth Rate in Japan (2017-2028) & (K MT)
Figure 19. Global Wood-Pellets Sales 2017-2028 (K MT)
Figure 20. Global Wood-Pellets Revenue, (US$ Million), 2017 VS 2021 VS 2028
Figure 21. Global Wood-Pellets Revenue 2017-2028 (US$ Million)
Figure 22. Global Wood-Pellets Revenue Market Share by Region in Percentage: 2021 Versus 2028
Figure 23. Global Wood-Pellets Sales Market Share by Region (2017-2022)
Figure 24. Global Wood-Pellets Sales Market Share by Region (2023-2028)
Figure 25. North America Wood-Pellets Sales YoY (2017-2028) & (K MT)
Figure 26. North America Wood-Pellets Revenue YoY (2017-2028) & (US$ Million)
Figure 27. Europe Wood-Pellets Sales YoY (2017-2028) & (K MT)
Figure 28. Europe Wood-Pellets Revenue YoY (2017-2028) & (US$ Million)
Figure 29. Asia-Pacific Wood-Pellets Sales YoY (2017-2028) & (K MT)
Figure 30. Asia-Pacific Wood-Pellets Revenue YoY (2017-2028) & (US$ Million)
Figure 31. Latin America Wood-Pellets Sales YoY (2017-2028) & (K MT)
Figure 32. Latin America Wood-Pellets Revenue YoY (2017-2028) & (US$ Million)
Figure 33. Middle East & Africa Wood-Pellets Sales YoY (2017-2028) & (K MT)
Figure 34. Middle East & Africa Wood-Pellets Revenue YoY (2017-2028) & (US$ Million)
Figure 35. The Wood-Pellets Market Share of Top 10 and Top 5 Largest Manufacturers Around the World in 2021
Figure 36. The Top 5 and 10 Largest Manufacturers of Wood-Pellets in the World: Market Share by Wood-Pellets Revenue in 2021
Figure 37. Wood-Pellets Market Share by Company Type (Tier 1, Tier 2, and Tier 3): 2017 VS 2021
Figure 38. Global Wood-Pellets Sales Market Share by Type (2017-2028)
Figure 39. Global Wood-Pellets Revenue Market Share by Type (2017-2028)
Figure 40. Global Wood-Pellets Sales Market Share by Application (2017-2028)
Figure 41. Global Wood-Pellets Revenue Market Share by Application (2017-2028)
Figure 42. North America Wood-Pellets Sales Market Share by Type (2017-2028)
Figure 43. North America Wood-Pellets Revenue Market Share by Type (2017-2028)
Figure 44. North America Wood-Pellets Sales Market Share by Application (2017-2028)
Figure 45. North America Wood-Pellets Revenue Market Share by Application (2017-2028)
Figure 46. North America Wood-Pellets Sales Share by Country (2017-2028)
Figure 47. North America Wood-Pellets Revenue Share by Country (2017-2028)
Figure 48. U.S. Wood-Pellets Revenue (2017-2028) & (US$ Million)
Figure 49. Canada Wood-Pellets Revenue (2017-2028) & (US$ Million)
Figure 50. Europe Wood-Pellets Sales Market Share by Type (2017-2028)
Figure 51. Europe Wood-Pellets Revenue Market Share by Type (2017-2028)
Figure 52. Europe Wood-Pellets Sales Market Share by Application (2017-2028)
Figure 53. Europe Wood-Pellets Revenue Market Share by Application (2017-2028)
Figure 54. Europe Wood-Pellets Sales Share by Country (2017-2028)
Figure 55. Europe Wood-Pellets Revenue Share by Country (2017-2028)
Figure 56. Germany Wood-Pellets Revenue (2017-2028) & (US$ Million)
Figure 57. France Wood-Pellets Revenue (2017-2028) & (US$ Million)
Figure 58. U.K. Wood-Pellets Revenue (2017-2028) & (US$ Million)
Figure 59. Italy Wood-Pellets Revenue (2017-2028) & (US$ Million)
Figure 60. Russia Wood-Pellets Revenue (2017-2028) & (US$ Million)
Figure 61. Asia Pacific Wood-Pellets Sales Market Share by Type (2017-2028)
Figure 62. Asia Pacific Wood-Pellets Revenue Market Share by Type (2017-2028)
Figure 63. Asia Pacific Wood-Pellets Sales Market Share by Application (2017-2028)
Figure 64. Asia Pacific Wood-Pellets Revenue Market Share by Application (2017-2028)
Figure 65. Asia Pacific Wood-Pellets Sales Share by Region (2017-2028)
Figure 66. Asia Pacific Wood-Pellets Revenue Share by Region (2017-2028)
Figure 67. China Wood-Pellets Revenue (2017-2028) & (US$ Million)
Figure 68. Japan Wood-Pellets Revenue (2017-2028) & (US$ Million)
Figure 69. South Korea Wood-Pellets Revenue (2017-2028) & (US$ Million)
Figure 70. India Wood-Pellets Revenue (2017-2028) & (US$ Million)
Figure 71. Australia Wood-Pellets Revenue (2017-2028) & (US$ Million)
Figure 72. Taiwan Wood-Pellets Revenue (2017-2028) & (US$ Million)
Figure 73. Indonesia Wood-Pellets Revenue (2017-2028) & (US$ Million)
Figure 74. Thailand Wood-Pellets Revenue (2017-2028) & (US$ Million)
Figure 75. Malaysia Wood-Pellets Revenue (2017-2028) & (US$ Million)
Figure 76. Philippines Wood-Pellets Revenue (2017-2028) & (US$ Million)
Figure 77. Latin America Wood-Pellets Sales Market Share by Type (2017-2028)
Figure 78. Latin America Wood-Pellets Revenue Market Share by Type (2017-2028)
Figure 79. Latin America Wood-Pellets Sales Market Share by Application (2017-2028)
Figure 80. Latin America Wood-Pellets Revenue Market Share by Application (2017-2028)
Figure 81. Latin America Wood-Pellets Sales Share by Country (2017-2028)
Figure 82. Latin America Wood-Pellets Revenue Share by Country (2017-2028)
Figure 83. Mexico Wood-Pellets Revenue (2017-2028) & (US$ Million)
Figure 84. Brazil Wood-Pellets Revenue (2017-2028) & (US$ Million)
Figure 85. Argentina Wood-Pellets Revenue (2017-2028) & (US$ Million)
Figure 86. Middle East and Africa Wood-Pellets Sales Market Share by Type (2017-2028)
Figure 87. Middle East and Africa Wood-Pellets Revenue Market Share by Type (2017-2028)
Figure 88. Middle East and Africa Wood-Pellets Sales Market Share by Application (2017-2028)
Figure 89. Middle East and Africa Wood-Pellets Revenue Market Share by Application (2017-2028)
Figure 90. Middle East and Africa Wood-Pellets Sales Share by Country (2017-2028)
Figure 91. Middle East and Africa Wood-Pellets Revenue Share by Country (2017-2028)
Figure 92. Turkey Wood-Pellets Revenue (2017-2028) & (US$ Million)
Figure 93. Saudi Arabia Wood-Pellets Revenue (2017-2028) & (US$ Million)
Figure 94. U.A.E Wood-Pellets Revenue (2017-2028) & (US$ Million)
Figure 95. Wood-Pellets Value Chain
Figure 96. Wood-Pellets Production Process
Figure 97. Channels of Distribution
Figure 98. Distributors Profiles
Figure 99. Bottom-up and Top-down Approaches for This Report
Figure 100. Data Triangulation
Figure 101. Key Executives Interviewed
$4900
$7350
$9800

Add to Cart
Add to Cart
Add to Cart
Add to Cart