
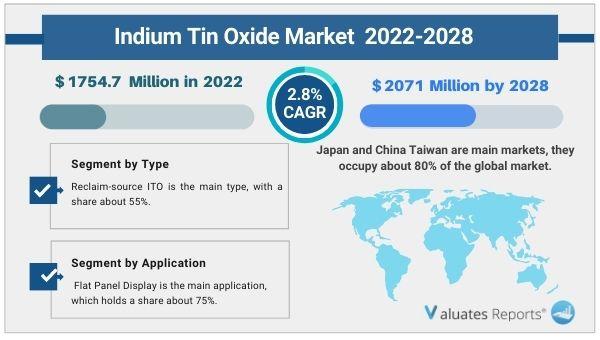
Due to the COVID-19 pandemic, the global Indium Tin Oxide market size is estimated to be worth US$ 1754.7 million in 2022 and is forecast to a readjusted size of US$ 2071 million by 2028 with a CAGR of 2.8% during the review period. Key drivers of the indium tin oxide market include the growing electronic industry and penetration of smart devices. The advent of ADAS systems in the automobile industry will provide huge opportunities for the indium tin oxide market in the coming years.
Moreover, indium tin oxide is used in the manufacturing of thin-film photovoltaic cells as opposed to traditional solar system panels which will surge the market expansion during the forecast period. Street lamps are another excellent use case. However, huge production costs will restrict the market capability during the coming decades.
The rapid proliferation of electronic devices
Indium tin oxide has optical transparency and excellent electrical conductivity. It is used for making the transparent conductive coating for flat panel displays, plasma displays, touch screen applications, LCDs, etc. Due to its low electrical resistivity, it is the best choice for touch screen applications of mobile phones. These factors will spur the development of the indium tin oxide market during the forecast period.
Automobile industry usage
Engineers rely on indium tin oxide for manufacturing touch into devices in autonomous vehicles. Consumers are demanding displays, touchscreens, and self-driver-assisted features in cars due to growing income levels and rising road accidents. It is also used in infrared reflected coatings or hot mirrors. These mirrors are heat reflection filters and are highly transparent. This in turn will push the indium tin oxide market forward in the coming decades.
Solar cells
The power output of Photovoltaic solar cells reduces considerably if the internal resistance goes up even fractionally. A transparent coating of indium tin oxide over the metallic component provides protection against the adhesion and is anti-reflective. The appropriate layer of thickness diffuses the sheet resistance thereby maintaining the proper resistance function. Thus the wide application in solar panel systems will ultimately spur the growth of the indium tin oxide market during the forecasted period.
Huge costs
Indium is a scarce resource which dramatically pushes the price higher. This restricts commercial production. The supply constraints, lack of flexibility, and R&D initiatives into finding alternative solutions will hinder the growth opportunities of the indium tin oxide market in the upcoming years.
Based on the application, the flat panel display will maintain the lead in the indium tin oxide market share with a 75% hold.
Based on region, Asia-Pacific will grow the highest in the indium tin oxide market share with Countries like Japan, China, and Taiwan covering up 80% of the global market.
Based on type, reclaim source ITO will provide lucrative opportunities for growth in the indium tin oxide market share with 55% penetration.
|
Report Metric |
Details |
|
Report Name |
Indium Tin Oxide Market |
|
The market size in 2022 |
USD 1754.7 Million |
|
The revenue forecast in 2028 |
USD 2071 Million |
|
Growth Rate |
Compound Annual Growth Rate (CAGR) of 2.8% from 2022 to 2028 |
|
Market size available for years |
2022-2028 |
|
Forecast units |
Value (USD) |
|
Segments covered |
By Type, Application, and Region |
|
Report coverage |
Revenue & volume forecast, company share, competitive landscape, growth factors, and trends |
|
Geographic regions covered |
North America, Europe, Asia Pacific, Latin America, Middle East & Africa |
Ans. The global Indium Tin Oxide market size is estimated to be worth US$ 1754.7 million in 2022 and is forecast to a readjusted size of US$ 2071 million by 2028.
Ans. The global Indium Tin Oxide market is expected to grow at a compound annual growth rate of 2.8% from 2022 to 2028.
Ans. Some of the major companies are Mitsui Mining & Smelting, JX Nippon Mining & Metals, Corning, Tosoh Corporation, Umicore, Indium Corporation, AM&M, SOLAR, Weihai Blue Fox, Yeke Group, OMAT, Guangxi Crystal Union Photoelectric Materials, China-Tin Group, ShaoGuan Sigma, ENAM OPTOELECTRONIC MATERIAL, Hebei Pengda, Zhuzhou Smelter Group, CNMC (Ningxia) Orient Group.
Table of Contents
1 Study Coverage
1.1 Indium Tin Oxide Product Introduction
1.2 Market by Type
1.2.1 Global Indium Tin Oxide Market Size by Type, 2017 VS 2021 VS 2028
1.2.2 Primary-source ITO
1.2.3 Reclaim-source ITO
1.3 Market by Application
1.3.1 Global Indium Tin Oxide Market Size by Application, 2017 VS 2021 VS 2028
1.3.2 Flat Panel Display
1.3.3 Touch-screen Sensor
1.3.4 Photovoltaic Cells
1.3.5 Others
1.4 Study Objectives
1.5 Years Considered
2 Global Indium Tin Oxide Production
2.1 Global Indium Tin Oxide Production Capacity (2017-2028)
2.2 Global Indium Tin Oxide Production by Region: 2017 VS 2021 VS 2028
2.3 Global Indium Tin Oxide Production by Region
2.3.1 Global Indium Tin Oxide Historic Production by Region (2017-2022)
2.3.2 Global Indium Tin Oxide Forecasted Production by Region (2023-2028)
2.4 Japan
2.5 North America
2.6 China
2.7 China Taiwan
2.8 South Korea
3 Global Indium Tin Oxide Sales in Volume & Value Estimates and Forecasts
3.1 Global Indium Tin Oxide Sales Estimates and Forecasts 2017-2028
3.2 Global Indium Tin Oxide Revenue Estimates and Forecasts 2017-2028
3.3 Global Indium Tin Oxide Revenue by Region: 2017 VS 2021 VS 2028
3.4 Global Indium Tin Oxide Sales by Region
3.4.1 Global Indium Tin Oxide Sales by Region (2017-2022)
3.4.2 Global Sales Indium Tin Oxide by Region (2023-2028)
3.5 Global Indium Tin Oxide Revenue by Region
3.5.1 Global Indium Tin Oxide Revenue by Region (2017-2022)
3.5.2 Global Indium Tin Oxide Revenue by Region (2023-2028)
3.6 North America
3.7 Europe
3.8 Asia-Pacific
3.9 Latin America
3.10 Middle East & Africa
4 Competition by Manufactures
4.1 Global Indium Tin Oxide Production Capacity by Manufacturers
4.2 Global Indium Tin Oxide Sales by Manufacturers
4.2.1 Global Indium Tin Oxide Sales by Manufacturers (2017-2022)
4.2.2 Global Indium Tin Oxide Sales Market Share by Manufacturers (2017-2022)
4.2.3 Global Top 10 and Top 5 Largest Manufacturers of Indium Tin Oxide in 2021
4.3 Global Indium Tin Oxide Revenue by Manufacturers
4.3.1 Global Indium Tin Oxide Revenue by Manufacturers (2017-2022)
4.3.2 Global Indium Tin Oxide Revenue Market Share by Manufacturers (2017-2022)
4.3.3 Global Top 10 and Top 5 Companies by Indium Tin Oxide Revenue in 2021
4.4 Global Indium Tin Oxide Sales Price by Manufacturers
4.5 Analysis of Competitive Landscape
4.5.1 Manufacturers Market Concentration Ratio (CR5 and HHI)
4.5.2 Global Indium Tin Oxide Market Share by Company Type (Tier 1, Tier 2, and Tier 3)
4.5.3 Global Indium Tin Oxide Manufacturers Geographical Distribution
4.6 Mergers & Acquisitions, Expansion Plans
5 Market Size by Type
5.1 Global Indium Tin Oxide Sales by Type
5.1.1 Global Indium Tin Oxide Historical Sales by Type (2017-2022)
5.1.2 Global Indium Tin Oxide Forecasted Sales by Type (2023-2028)
5.1.3 Global Indium Tin Oxide Sales Market Share by Type (2017-2028)
5.2 Global Indium Tin Oxide Revenue by Type
5.2.1 Global Indium Tin Oxide Historical Revenue by Type (2017-2022)
5.2.2 Global Indium Tin Oxide Forecasted Revenue by Type (2023-2028)
5.2.3 Global Indium Tin Oxide Revenue Market Share by Type (2017-2028)
5.3 Global Indium Tin Oxide Price by Type
5.3.1 Global Indium Tin Oxide Price by Type (2017-2022)
5.3.2 Global Indium Tin Oxide Price Forecast by Type (2023-2028)
6 Market Size by Application
6.1 Global Indium Tin Oxide Sales by Application
6.1.1 Global Indium Tin Oxide Historical Sales by Application (2017-2022)
6.1.2 Global Indium Tin Oxide Forecasted Sales by Application (2023-2028)
6.1.3 Global Indium Tin Oxide Sales Market Share by Application (2017-2028)
6.2 Global Indium Tin Oxide Revenue by Application
6.2.1 Global Indium Tin Oxide Historical Revenue by Application (2017-2022)
6.2.2 Global Indium Tin Oxide Forecasted Revenue by Application (2023-2028)
6.2.3 Global Indium Tin Oxide Revenue Market Share by Application (2017-2028)
6.3 Global Indium Tin Oxide Price by Application
6.3.1 Global Indium Tin Oxide Price by Application (2017-2022)
6.3.2 Global Indium Tin Oxide Price Forecast by Application (2023-2028)
7 North America
7.1 North America Indium Tin Oxide Market Size by Type
7.1.1 North America Indium Tin Oxide Sales by Type (2017-2028)
7.1.2 North America Indium Tin Oxide Revenue by Type (2017-2028)
7.2 North America Indium Tin Oxide Market Size by Application
7.2.1 North America Indium Tin Oxide Sales by Application (2017-2028)
7.2.2 North America Indium Tin Oxide Revenue by Application (2017-2028)
7.3 North America Indium Tin Oxide Sales by Country
7.3.1 North America Indium Tin Oxide Sales by Country (2017-2028)
7.3.2 North America Indium Tin Oxide Revenue by Country (2017-2028)
7.3.3 U.S.
7.3.4 Canada
8 Europe
8.1 Europe Indium Tin Oxide Market Size by Type
8.1.1 Europe Indium Tin Oxide Sales by Type (2017-2028)
8.1.2 Europe Indium Tin Oxide Revenue by Type (2017-2028)
8.2 Europe Indium Tin Oxide Market Size by Application
8.2.1 Europe Indium Tin Oxide Sales by Application (2017-2028)
8.2.2 Europe Indium Tin Oxide Revenue by Application (2017-2028)
8.3 Europe Indium Tin Oxide Sales by Country
8.3.1 Europe Indium Tin Oxide Sales by Country (2017-2028)
8.3.2 Europe Indium Tin Oxide Revenue by Country (2017-2028)
8.3.3 Germany
8.3.4 France
8.3.5 U.K.
8.3.6 Italy
8.3.7 Russia
9 Asia Pacific
9.1 Asia Pacific Indium Tin Oxide Market Size by Type
9.1.1 Asia Pacific Indium Tin Oxide Sales by Type (2017-2028)
9.1.2 Asia Pacific Indium Tin Oxide Revenue by Type (2017-2028)
9.2 Asia Pacific Indium Tin Oxide Market Size by Application
9.2.1 Asia Pacific Indium Tin Oxide Sales by Application (2017-2028)
9.2.2 Asia Pacific Indium Tin Oxide Revenue by Application (2017-2028)
9.3 Asia Pacific Indium Tin Oxide Sales by Region
9.3.1 Asia Pacific Indium Tin Oxide Sales by Region (2017-2028)
9.3.2 Asia Pacific Indium Tin Oxide Revenue by Region (2017-2028)
9.3.3 China
9.3.4 Japan
9.3.5 South Korea
9.3.6 India
9.3.7 Australia
9.3.8 China Taiwan
9.3.9 Indonesia
9.3.10 Thailand
9.3.11 Malaysia
10 Latin America
10.1 Latin America Indium Tin Oxide Market Size by Type
10.1.1 Latin America Indium Tin Oxide Sales by Type (2017-2028)
10.1.2 Latin America Indium Tin Oxide Revenue by Type (2017-2028)
10.2 Latin America Indium Tin Oxide Market Size by Application
10.2.1 Latin America Indium Tin Oxide Sales by Application (2017-2028)
10.2.2 Latin America Indium Tin Oxide Revenue by Application (2017-2028)
10.3 Latin America Indium Tin Oxide Sales by Country
10.3.1 Latin America Indium Tin Oxide Sales by Country (2017-2028)
10.3.2 Latin America Indium Tin Oxide Revenue by Country (2017-2028)
10.3.3 Mexico
10.3.4 Brazil
10.3.5 Argentina
11 Middle East and Africa
11.1 Middle East and Africa Indium Tin Oxide Market Size by Type
11.1.1 Middle East and Africa Indium Tin Oxide Sales by Type (2017-2028)
11.1.2 Middle East and Africa Indium Tin Oxide Revenue by Type (2017-2028)
11.2 Middle East and Africa Indium Tin Oxide Market Size by Application
11.2.1 Middle East and Africa Indium Tin Oxide Sales by Application (2017-2028)
11.2.2 Middle East and Africa Indium Tin Oxide Revenue by Application (2017-2028)
11.3 Middle East and Africa Indium Tin Oxide Sales by Country
11.3.1 Middle East and Africa Indium Tin Oxide Sales by Country (2017-2028)
11.3.2 Middle East and Africa Indium Tin Oxide Revenue by Country (2017-2028)
11.3.3 Turkey
11.3.4 Saudi Arabia
11.3.5 UAE
12 Corporate Profiles
12.1 Mitsui Mining & Smelting
12.1.1 Mitsui Mining & Smelting Corporation Information
12.1.2 Mitsui Mining & Smelting Overview
12.1.3 Mitsui Mining & Smelting Indium Tin Oxide Sales, Price, Revenue and Gross Margin (2017-2022)
12.1.4 Mitsui Mining & Smelting Indium Tin Oxide Product Model Numbers, Pictures, Descriptions and Specifications
12.1.5 Mitsui Mining & Smelting Recent Developments
12.2 JX Nippon Mining & Metals
12.2.1 JX Nippon Mining & Metals Corporation Information
12.2.2 JX Nippon Mining & Metals Overview
12.2.3 JX Nippon Mining & Metals Indium Tin Oxide Sales, Price, Revenue and Gross Margin (2017-2022)
12.2.4 JX Nippon Mining & Metals Indium Tin Oxide Product Model Numbers, Pictures, Descriptions and Specifications
12.2.5 JX Nippon Mining & Metals Recent Developments
12.3 Corning
12.3.1 Corning Corporation Information
12.3.2 Corning Overview
12.3.3 Corning Indium Tin Oxide Sales, Price, Revenue and Gross Margin (2017-2022)
12.3.4 Corning Indium Tin Oxide Product Model Numbers, Pictures, Descriptions and Specifications
12.3.5 Corning Recent Developments
12.4 Tosoh Corporation
12.4.1 Tosoh Corporation Corporation Information
12.4.2 Tosoh Corporation Overview
12.4.3 Tosoh Corporation Indium Tin Oxide Sales, Price, Revenue and Gross Margin (2017-2022)
12.4.4 Tosoh Corporation Indium Tin Oxide Product Model Numbers, Pictures, Descriptions and Specifications
12.4.5 Tosoh Corporation Recent Developments
12.5 Umicore
12.5.1 Umicore Corporation Information
12.5.2 Umicore Overview
12.5.3 Umicore Indium Tin Oxide Sales, Price, Revenue and Gross Margin (2017-2022)
12.5.4 Umicore Indium Tin Oxide Product Model Numbers, Pictures, Descriptions and Specifications
12.5.5 Umicore Recent Developments
12.6 Indium Corporation
12.6.1 Indium Corporation Corporation Information
12.6.2 Indium Corporation Overview
12.6.3 Indium Corporation Indium Tin Oxide Sales, Price, Revenue and Gross Margin (2017-2022)
12.6.4 Indium Corporation Indium Tin Oxide Product Model Numbers, Pictures, Descriptions and Specifications
12.6.5 Indium Corporation Recent Developments
12.7 AM&M
12.7.1 AM&M Corporation Information
12.7.2 AM&M Overview
12.7.3 AM&M Indium Tin Oxide Sales, Price, Revenue and Gross Margin (2017-2022)
12.7.4 AM&M Indium Tin Oxide Product Model Numbers, Pictures, Descriptions and Specifications
12.7.5 AM&M Recent Developments
12.8 SOLAR
12.8.1 SOLAR Corporation Information
12.8.2 SOLAR Overview
12.8.3 SOLAR Indium Tin Oxide Sales, Price, Revenue and Gross Margin (2017-2022)
12.8.4 SOLAR Indium Tin Oxide Product Model Numbers, Pictures, Descriptions and Specifications
12.8.5 SOLAR Recent Developments
12.9 Weihai Blue Fox
12.9.1 Weihai Blue Fox Corporation Information
12.9.2 Weihai Blue Fox Overview
12.9.3 Weihai Blue Fox Indium Tin Oxide Sales, Price, Revenue and Gross Margin (2017-2022)
12.9.4 Weihai Blue Fox Indium Tin Oxide Product Model Numbers, Pictures, Descriptions and Specifications
12.9.5 Weihai Blue Fox Recent Developments
12.10 Yeke Group
12.10.1 Yeke Group Corporation Information
12.10.2 Yeke Group Overview
12.10.3 Yeke Group Indium Tin Oxide Sales, Price, Revenue and Gross Margin (2017-2022)
12.10.4 Yeke Group Indium Tin Oxide Product Model Numbers, Pictures, Descriptions and Specifications
12.10.5 Yeke Group Recent Developments
12.11 OMAT
12.11.1 OMAT Corporation Information
12.11.2 OMAT Overview
12.11.3 OMAT Indium Tin Oxide Sales, Price, Revenue and Gross Margin (2017-2022)
12.11.4 OMAT Indium Tin Oxide Product Model Numbers, Pictures, Descriptions and Specifications
12.11.5 OMAT Recent Developments
12.12 Guangxi Crystal Union Photoelectric Materials
12.12.1 Guangxi Crystal Union Photoelectric Materials Corporation Information
12.12.2 Guangxi Crystal Union Photoelectric Materials Overview
12.12.3 Guangxi Crystal Union Photoelectric Materials Indium Tin Oxide Sales, Price, Revenue and Gross Margin (2017-2022)
12.12.4 Guangxi Crystal Union Photoelectric Materials Indium Tin Oxide Product Model Numbers, Pictures, Descriptions and Specifications
12.12.5 Guangxi Crystal Union Photoelectric Materials Recent Developments
12.13 China-Tin Group
12.13.1 China-Tin Group Corporation Information
12.13.2 China-Tin Group Overview
12.13.3 China-Tin Group Indium Tin Oxide Sales, Price, Revenue and Gross Margin (2017-2022)
12.13.4 China-Tin Group Indium Tin Oxide Product Model Numbers, Pictures, Descriptions and Specifications
12.13.5 China-Tin Group Recent Developments
12.14 ShaoGuan Sigma
12.14.1 ShaoGuan Sigma Corporation Information
12.14.2 ShaoGuan Sigma Overview
12.14.3 ShaoGuan Sigma Indium Tin Oxide Sales, Price, Revenue and Gross Margin (2017-2022)
12.14.4 ShaoGuan Sigma Indium Tin Oxide Product Model Numbers, Pictures, Descriptions and Specifications
12.14.5 ShaoGuan Sigma Recent Developments
12.15 ENAM OPTOELECTRONIC MATERIAL
12.15.1 ENAM OPTOELECTRONIC MATERIAL Corporation Information
12.15.2 ENAM OPTOELECTRONIC MATERIAL Overview
12.15.3 ENAM OPTOELECTRONIC MATERIAL Indium Tin Oxide Sales, Price, Revenue and Gross Margin (2017-2022)
12.15.4 ENAM OPTOELECTRONIC MATERIAL Indium Tin Oxide Product Model Numbers, Pictures, Descriptions and Specifications
12.15.5 ENAM OPTOELECTRONIC MATERIAL Recent Developments
12.16 Hebei Pengda
12.16.1 Hebei Pengda Corporation Information
12.16.2 Hebei Pengda Overview
12.16.3 Hebei Pengda Indium Tin Oxide Sales, Price, Revenue and Gross Margin (2017-2022)
12.16.4 Hebei Pengda Indium Tin Oxide Product Model Numbers, Pictures, Descriptions and Specifications
12.16.5 Hebei Pengda Recent Developments
12.17 Zhuzhou Smelter Group
12.17.1 Zhuzhou Smelter Group Corporation Information
12.17.2 Zhuzhou Smelter Group Overview
12.17.3 Zhuzhou Smelter Group Indium Tin Oxide Sales, Price, Revenue and Gross Margin (2017-2022)
12.17.4 Zhuzhou Smelter Group Indium Tin Oxide Product Model Numbers, Pictures, Descriptions and Specifications
12.17.5 Zhuzhou Smelter Group Recent Developments
12.18 CNMC (Ningxia) Orient Group
12.18.1 CNMC (Ningxia) Orient Group Corporation Information
12.18.2 CNMC (Ningxia) Orient Group Overview
12.18.3 CNMC (Ningxia) Orient Group Indium Tin Oxide Sales, Price, Revenue and Gross Margin (2017-2022)
12.18.4 CNMC (Ningxia) Orient Group Indium Tin Oxide Product Model Numbers, Pictures, Descriptions and Specifications
12.18.5 CNMC (Ningxia) Orient Group Recent Developments
13 Industry Chain and Sales Channels Analysis
13.1 Indium Tin Oxide Industry Chain Analysis
13.2 Indium Tin Oxide Key Raw Materials
13.2.1 Key Raw Materials
13.2.2 Raw Materials Key Suppliers
13.3 Indium Tin Oxide Production Mode & Process
13.4 Indium Tin Oxide Sales and Marketing
13.4.1 Indium Tin Oxide Sales Channels
13.4.2 Indium Tin Oxide Distributors
13.5 Indium Tin Oxide Customers
14 Market Drivers, Opportunities, Challenges and Risks Factors Analysis
14.1 Indium Tin Oxide Industry Trends
14.2 Indium Tin Oxide Market Drivers
14.3 Indium Tin Oxide Market Challenges
14.4 Indium Tin Oxide Market Restraints
15 Key Finding in The Global Indium Tin Oxide Study
16 Appendix
16.1 Research Methodology
16.1.1 Methodology/Research Approach
16.1.2 Data Source
16.2 Author Details
16.3 Disclaimer
List of Tables
Table 1. Global Indium Tin Oxide Market Size Growth Rate by Type, 2017 VS 2021 VS 2028 (US$ Million)
Table 2. Major Manufacturers of Primary-source ITO
Table 3. Major Manufacturers of Reclaim-source ITO
Table 4. Global Indium Tin Oxide Market Size Growth Rate by Application, 2017 VS 2021 2028 (US$ Million)
Table 5. Global Indium Tin Oxide Production by Region: 2017 VS 2021 VS 2028 (MT)
Table 6. Global Indium Tin Oxide Production by Region (2017-2022) & (MT)
Table 7. Global Indium Tin Oxide Production Market Share by Region (2017-2022)
Table 8. Global Indium Tin Oxide Production by Region (2023-2028) & (MT)
Table 9. Global Indium Tin Oxide Production Market Share by Region (2023-2028)
Table 10. Global Indium Tin Oxide Revenue by Region: 2017 VS 2021 VS 2028 (US$ Million)
Table 11. Global Indium Tin Oxide Sales by Region (2017-2022) & (MT)
Table 12. Global Indium Tin Oxide Sales Market Share by Region (2017-2022)
Table 13. Global Indium Tin Oxide Sales by Region (2023-2028) & (MT)
Table 14. Global Indium Tin Oxide Sales Market Share by Region (2023-2028)
Table 15. Global Indium Tin Oxide Revenue by Region (2017-2022) & (US$ Million)
Table 16. Global Indium Tin Oxide Revenue Market Share by Region (2017-2022)
Table 17. Global Indium Tin Oxide Revenue by Region (2023-2028) & (US$ Million)
Table 18. Global Indium Tin Oxide Revenue Market Share by Region (2023-2028)
Table 19. Global Indium Tin Oxide Production Capacity by Manufacturers (2017-2022) & (MT)
Table 20. Global Indium Tin Oxide Capacity Market Share by Manufacturers (2017-2022)
Table 21. Global Indium Tin Oxide Sales by Manufacturers (2017-2022) & (MT)
Table 22. Global Indium Tin Oxide Sales Market Share by Manufacturers (2017-2022)
Table 23. Global Indium Tin Oxide Revenue by Manufacturers (2017-2022) & (US$ Million)
Table 24. Global Indium Tin Oxide Revenue Share by Manufacturers (2017-2022)
Table 25. Indium Tin Oxide Price by Manufacturers 2017-2022 (US$/Kg)
Table 26. Global Indium Tin Oxide Manufacturers Market Concentration Ratio (CR5 and HHI)
Table 27. Global Indium Tin Oxide by Company Type (Tier 1, Tier 2, and Tier 3) & (based on the Revenue in Indium Tin Oxide as of 2021)
Table 28. Indium Tin Oxide Manufacturing Base Distribution and Headquarters
Table 29. Manufacturers Indium Tin Oxide Product Offered
Table 30. Date of Manufacturers Enter into Indium Tin Oxide Market
Table 31. Mergers & Acquisitions, Expansion Plans
Table 32. Global Indium Tin Oxide Sales by Type (2017-2022) & (MT)
Table 33. Global Indium Tin Oxide Sales by Type (2023-2028) & (MT)
Table 34. Global Indium Tin Oxide Sales Share by Type (2017-2022)
Table 35. Global Indium Tin Oxide Sales Share by Type (2023-2028)
Table 36. Global Indium Tin Oxide Revenue by Type (2017-2022) & (US$ Million)
Table 37. Global Indium Tin Oxide Revenue by Type (2023-2028) & (US$ Million)
Table 38. Global Indium Tin Oxide Revenue Share by Type (2017-2022)
Table 39. Global Indium Tin Oxide Revenue Share by Type (2023-2028)
Table 40. Indium Tin Oxide Price by Type (2017-2022) & (US$/Kg)
Table 41. Global Indium Tin Oxide Price Forecast by Type (2023-2028) & (US$/Kg)
Table 42. Global Indium Tin Oxide Sales by Application (2017-2022) & (MT)
Table 43. Global Indium Tin Oxide Sales by Application (2023-2028) & (MT)
Table 44. Global Indium Tin Oxide Sales Share by Application (2017-2022)
Table 45. Global Indium Tin Oxide Sales Share by Application (2023-2028)
Table 46. Global Indium Tin Oxide Revenue by Application (2017-2022) & (US$ Million)
Table 47. Global Indium Tin Oxide Revenue by Application (2023-2028) & (US$ Million)
Table 48. Global Indium Tin Oxide Revenue Share by Application (2017-2022)
Table 49. Global Indium Tin Oxide Revenue Share by Application (2023-2028)
Table 50. Indium Tin Oxide Price by Application (2017-2022) & (US$/Kg)
Table 51. Global Indium Tin Oxide Price Forecast by Application (2023-2028) & (US$/Kg)
Table 52. North America Indium Tin Oxide Sales by Type (2017-2022) & (MT)
Table 53. North America Indium Tin Oxide Sales by Type (2023-2028) & (MT)
Table 54. North America Indium Tin Oxide Revenue by Type (2017-2022) & (US$ Million)
Table 55. North America Indium Tin Oxide Revenue by Type (2023-2028) & (US$ Million)
Table 56. North America Indium Tin Oxide Sales by Application (2017-2022) & (MT)
Table 57. North America Indium Tin Oxide Sales by Application (2023-2028) & (MT)
Table 58. North America Indium Tin Oxide Revenue by Application (2017-2022) & (US$ Million)
Table 59. North America Indium Tin Oxide Revenue by Application (2023-2028) & (US$ Million)
Table 60. North America Indium Tin Oxide Sales by Country (2017-2022) & (MT)
Table 61. North America Indium Tin Oxide Sales by Country (2023-2028) & (MT)
Table 62. North America Indium Tin Oxide Revenue by Country (2017-2022) & (US$ Million)
Table 63. North America Indium Tin Oxide Revenue by Country (2023-2028) & (US$ Million)
Table 64. Europe Indium Tin Oxide Sales by Type (2017-2022) & (MT)
Table 65. Europe Indium Tin Oxide Sales by Type (2023-2028) & (MT)
Table 66. Europe Indium Tin Oxide Revenue by Type (2017-2022) & (US$ Million)
Table 67. Europe Indium Tin Oxide Revenue by Type (2023-2028) & (US$ Million)
Table 68. Europe Indium Tin Oxide Sales by Application (2017-2022) & (MT)
Table 69. Europe Indium Tin Oxide Sales by Application (2023-2028) & (MT)
Table 70. Europe Indium Tin Oxide Revenue by Application (2017-2022) & (US$ Million)
Table 71. Europe Indium Tin Oxide Revenue by Application (2023-2028) & (US$ Million)
Table 72. Europe Indium Tin Oxide Sales by Country (2017-2022) & (MT)
Table 73. Europe Indium Tin Oxide Sales by Country (2023-2028) & (MT)
Table 74. Europe Indium Tin Oxide Revenue by Country (2017-2022) & (US$ Million)
Table 75. Europe Indium Tin Oxide Revenue by Country (2023-2028) & (US$ Million)
Table 76. Asia Pacific Indium Tin Oxide Sales by Type (2017-2022) & (MT)
Table 77. Asia Pacific Indium Tin Oxide Sales by Type (2023-2028) & (MT)
Table 78. Asia Pacific Indium Tin Oxide Revenue by Type (2017-2022) & (US$ Million)
Table 79. Asia Pacific Indium Tin Oxide Revenue by Type (2023-2028) & (US$ Million)
Table 80. Asia Pacific Indium Tin Oxide Sales by Application (2017-2022) & (MT)
Table 81. Asia Pacific Indium Tin Oxide Sales by Application (2023-2028) & (MT)
Table 82. Asia Pacific Indium Tin Oxide Revenue by Application (2017-2022) & (US$ Million)
Table 83. Asia Pacific Indium Tin Oxide Revenue by Application (2023-2028) & (US$ Million)
Table 84. Asia Pacific Indium Tin Oxide Sales by Region (2017-2022) & (MT)
Table 85. Asia Pacific Indium Tin Oxide Sales by Region (2023-2028) & (MT)
Table 86. Asia Pacific Indium Tin Oxide Revenue by Region (2017-2022) & (US$ Million)
Table 87. Asia Pacific Indium Tin Oxide Revenue by Region (2023-2028) & (US$ Million)
Table 88. Latin America Indium Tin Oxide Sales by Type (2017-2022) & (MT)
Table 89. Latin America Indium Tin Oxide Sales by Type (2023-2028) & (MT)
Table 90. Latin America Indium Tin Oxide Revenue by Type (2017-2022) & (US$ Million)
Table 91. Latin America Indium Tin Oxide Revenue by Type (2023-2028) & (US$ Million)
Table 92. Latin America Indium Tin Oxide Sales by Application (2017-2022) & (MT)
Table 93. Latin America Indium Tin Oxide Sales by Application (2023-2028) & (MT)
Table 94. Latin America Indium Tin Oxide Revenue by Application (2017-2022) & (US$ Million)
Table 95. Latin America Indium Tin Oxide Revenue by Application (2023-2028) & (US$ Million)
Table 96. Latin America Indium Tin Oxide Sales by Country (2017-2022) & (MT)
Table 97. Latin America Indium Tin Oxide Sales by Country (2023-2028) & (MT)
Table 98. Latin America Indium Tin Oxide Revenue by Country (2017-2022) & (US$ Million)
Table 99. Latin America Indium Tin Oxide Revenue by Country (2023-2028) & (US$ Million)
Table 100. Middle East and Africa Indium Tin Oxide Sales by Type (2017-2022) & (MT)
Table 101. Middle East and Africa Indium Tin Oxide Sales by Type (2023-2028) & (MT)
Table 102. Middle East and Africa Indium Tin Oxide Revenue by Type (2017-2022) & (US$ Million)
Table 103. Middle East and Africa Indium Tin Oxide Revenue by Type (2023-2028) & (US$ Million)
Table 104. Middle East and Africa Indium Tin Oxide Sales by Application (2017-2022) & (MT)
Table 105. Middle East and Africa Indium Tin Oxide Sales by Application (2023-2028) & (MT)
Table 106. Middle East and Africa Indium Tin Oxide Revenue by Application (2017-2022) & (US$ Million)
Table 107. Middle East and Africa Indium Tin Oxide Revenue by Application (2023-2028) & (US$ Million)
Table 108. Middle East and Africa Indium Tin Oxide Sales by Country (2017-2022) & (MT)
Table 109. Middle East and Africa Indium Tin Oxide Sales by Country (2023-2028) & (MT)
Table 110. Middle East and Africa Indium Tin Oxide Revenue by Country (2017-2022) & (US$ Million)
Table 111. Middle East and Africa Indium Tin Oxide Revenue by Country (2023-2028) & (US$ Million)
Table 112. Mitsui Mining & Smelting Corporation Information
Table 113. Mitsui Mining & Smelting Description and Major Businesses
Table 114. Mitsui Mining & Smelting Indium Tin Oxide Sales (MT), Revenue (US$ Million), Price (US$/Kg) and Gross Margin (2017-2022)
Table 115. Mitsui Mining & Smelting Indium Tin Oxide Product Model Numbers, Pictures, Descriptions and Specifications
Table 116. Mitsui Mining & Smelting Recent Development
Table 117. JX Nippon Mining & Metals Corporation Information
Table 118. JX Nippon Mining & Metals Description and Major Businesses
Table 119. JX Nippon Mining & Metals Indium Tin Oxide Sales (MT), Revenue (US$ Million), Price (US$/Kg) and Gross Margin (2017-2022)
Table 120. JX Nippon Mining & Metals Indium Tin Oxide Product Model Numbers, Pictures, Descriptions and Specifications
Table 121. JX Nippon Mining & Metals Recent Development
Table 122. Corning Corporation Information
Table 123. Corning Description and Major Businesses
Table 124. Corning Indium Tin Oxide Sales (MT), Revenue (US$ Million), Price (US$/Kg) and Gross Margin (2017-2022)
Table 125. Corning Indium Tin Oxide Product Model Numbers, Pictures, Descriptions and Specifications
Table 126. Corning Recent Development
Table 127. Tosoh Corporation Corporation Information
Table 128. Tosoh Corporation Description and Major Businesses
Table 129. Tosoh Corporation Indium Tin Oxide Sales (MT), Revenue (US$ Million), Price (US$/Kg) and Gross Margin (2017-2022)
Table 130. Tosoh Corporation Indium Tin Oxide Product Model Numbers, Pictures, Descriptions and Specifications
Table 131. Tosoh Corporation Recent Development
Table 132. Umicore Corporation Information
Table 133. Umicore Description and Major Businesses
Table 134. Umicore Indium Tin Oxide Sales (MT), Revenue (US$ Million), Price (US$/Kg) and Gross Margin (2017-2022)
Table 135. Umicore Indium Tin Oxide Product Model Numbers, Pictures, Descriptions and Specifications
Table 136. Umicore Recent Development
Table 137. Indium Corporation Corporation Information
Table 138. Indium Corporation Description and Major Businesses
Table 139. Indium Corporation Indium Tin Oxide Sales (MT), Revenue (US$ Million), Price (US$/Kg) and Gross Margin (2017-2022)
Table 140. Indium Corporation Indium Tin Oxide Product Model Numbers, Pictures, Descriptions and Specifications
Table 141. Indium Corporation Recent Development
Table 142. AM&M Corporation Information
Table 143. AM&M Description and Major Businesses
Table 144. AM&M Indium Tin Oxide Sales (MT), Revenue (US$ Million), Price (US$/Kg) and Gross Margin (2017-2022)
Table 145. AM&M Indium Tin Oxide Product Model Numbers, Pictures, Descriptions and Specifications
Table 146. AM&M Recent Development
Table 147. SOLAR Corporation Information
Table 148. SOLAR Description and Major Businesses
Table 149. SOLAR Indium Tin Oxide Sales (MT), Revenue (US$ Million), Price (US$/Kg) and Gross Margin (2017-2022)
Table 150. SOLAR Indium Tin Oxide Product Model Numbers, Pictures, Descriptions and Specifications
Table 151. SOLAR Recent Development
Table 152. Weihai Blue Fox Corporation Information
Table 153. Weihai Blue Fox Description and Major Businesses
Table 154. Weihai Blue Fox Indium Tin Oxide Sales (MT), Revenue (US$ Million), Price (US$/Kg) and Gross Margin (2017-2022)
Table 155. Weihai Blue Fox Indium Tin Oxide Product Model Numbers, Pictures, Descriptions and Specifications
Table 156. Weihai Blue Fox Recent Development
Table 157. Yeke Group Corporation Information
Table 158. Yeke Group Description and Major Businesses
Table 159. Yeke Group Indium Tin Oxide Sales (MT), Revenue (US$ Million), Price (US$/Kg) and Gross Margin (2017-2022)
Table 160. Yeke Group Indium Tin Oxide Product Model Numbers, Pictures, Descriptions and Specifications
Table 161. Yeke Group Recent Development
Table 162. OMAT Corporation Information
Table 163. OMAT Description and Major Businesses
Table 164. OMAT Indium Tin Oxide Sales (MT), Revenue (US$ Million), Price (US$/Kg) and Gross Margin (2017-2022)
Table 165. OMAT Indium Tin Oxide Product Model Numbers, Pictures, Descriptions and Specifications
Table 166. OMAT Recent Development
Table 167. Guangxi Crystal Union Photoelectric Materials Corporation Information
Table 168. Guangxi Crystal Union Photoelectric Materials Description and Major Businesses
Table 169. Guangxi Crystal Union Photoelectric Materials Indium Tin Oxide Sales (MT), Revenue (US$ Million), Price (US$/Kg) and Gross Margin (2017-2022)
Table 170. Guangxi Crystal Union Photoelectric Materials Indium Tin Oxide Product Model Numbers, Pictures, Descriptions and Specifications
Table 171. Guangxi Crystal Union Photoelectric Materials Recent Development
Table 172. China-Tin Group Corporation Information
Table 173. China-Tin Group Description and Major Businesses
Table 174. China-Tin Group Indium Tin Oxide Sales (MT), Revenue (US$ Million), Price (US$/Kg) and Gross Margin (2017-2022)
Table 175. China-Tin Group Indium Tin Oxide Product Model Numbers, Pictures, Descriptions and Specifications
Table 176. China-Tin Group Recent Development
Table 177. ShaoGuan Sigma Corporation Information
Table 178. ShaoGuan Sigma Description and Major Businesses
Table 179. ShaoGuan Sigma Indium Tin Oxide Sales (MT), Revenue (US$ Million), Price (US$/Kg) and Gross Margin (2017-2022)
Table 180. ShaoGuan Sigma Indium Tin Oxide Product Model Numbers, Pictures, Descriptions and Specifications
Table 181. ShaoGuan Sigma Recent Development
Table 182. ENAM OPTOELECTRONIC MATERIAL Corporation Information
Table 183. ENAM OPTOELECTRONIC MATERIAL Description and Major Businesses
Table 184. ENAM OPTOELECTRONIC MATERIAL Indium Tin Oxide Sales (MT), Revenue (US$ Million), Price (US$/Kg) and Gross Margin (2017-2022)
Table 185. ENAM OPTOELECTRONIC MATERIAL Indium Tin Oxide Product Model Numbers, Pictures, Descriptions and Specifications
Table 186. ENAM OPTOELECTRONIC MATERIAL Recent Development
Table 187. Hebei Pengda Corporation Information
Table 188. Hebei Pengda Description and Major Businesses
Table 189. Hebei Pengda Indium Tin Oxide Sales (MT), Revenue (US$ Million), Price (US$/Kg) and Gross Margin (2017-2022)
Table 190. Hebei Pengda Indium Tin Oxide Product Model Numbers, Pictures, Descriptions and Specifications
Table 191. Hebei Pengda Recent Development
Table 192. Zhuzhou Smelter Group Corporation Information
Table 193. Zhuzhou Smelter Group Description and Major Businesses
Table 194. Zhuzhou Smelter Group Indium Tin Oxide Sales (MT), Revenue (US$ Million), Price (US$/Kg) and Gross Margin (2017-2022)
Table 195. Zhuzhou Smelter Group Indium Tin Oxide Product Model Numbers, Pictures, Descriptions and Specifications
Table 196. Zhuzhou Smelter Group Recent Development
Table 197. CNMC (Ningxia) Orient Group Corporation Information
Table 198. CNMC (Ningxia) Orient Group Description and Major Businesses
Table 199. CNMC (Ningxia) Orient Group Indium Tin Oxide Sales (MT), Revenue (US$ Million), Price (US$/Kg) and Gross Margin (2017-2022)
Table 200. CNMC (Ningxia) Orient Group Indium Tin Oxide Product Model Numbers, Pictures, Descriptions and Specifications
Table 201. CNMC (Ningxia) Orient Group Recent Development
Table 202. Key Raw Materials Lists
Table 203. Raw Materials Key Suppliers Lists
Table 204. Indium Tin Oxide Distributors List
Table 205. Indium Tin Oxide Customers List
Table 206. Indium Tin Oxide Market Trends
Table 207. Indium Tin Oxide Market Drivers
Table 208. Indium Tin Oxide Market Challenges
Table 209. Indium Tin Oxide Market Restraints
Table 210. Research Programs/Design for This Report
Table 211. Key Data Information from Secondary Sources
Table 212. Key Data Information from Primary Sources
List of Figures
Figure 1. Indium Tin Oxide Product Picture
Figure 2. Global Indium Tin Oxide Market Share by Type in 2021 & 2028
Figure 3. Primary-source ITO Product Picture
Figure 4. Reclaim-source ITO Product Picture
Figure 5. Global Indium Tin Oxide Market Share by Application in 2021 & 2028
Figure 6. Flat Panel Display
Figure 7. Touch-screen Sensor
Figure 8. Photovoltaic Cells
Figure 9. Others
Figure 10. Indium Tin Oxide Report Years Considered
Figure 11. Global Indium Tin Oxide Capacity, Production and Utilization (2017-2028) & (MT)
Figure 12. Global Indium Tin Oxide Production Market Share by Region in Percentage: 2021 Versus 2028
Figure 13. Global Indium Tin Oxide Production Market Share by Region (2017-2022)
Figure 14. Global Indium Tin Oxide Production Market Share by Region (2023-2028)
Figure 15. Indium Tin Oxide Production Growth Rate in Japan (2017-2028) & (MT)
Figure 16. Indium Tin Oxide Production Growth Rate in North America (2017-2028) & (MT)
Figure 17. Indium Tin Oxide Production Growth Rate in China (2017-2028) & (MT)
Figure 18. Indium Tin Oxide Production Growth Rate in China Taiwan (2017-2028) & (MT)
Figure 19. Indium Tin Oxide Production Growth Rate in South Korea (2017-2028) & (MT)
Figure 20. Global Indium Tin Oxide Sales 2017-2028 (MT)
Figure 21. Global Indium Tin Oxide Revenue, (US$ Million), 2017 VS 2021 VS 2028
Figure 22. Global Indium Tin Oxide Revenue 2017-2028 (US$ Million)
Figure 23. Global Indium Tin Oxide Revenue Market Share by Region in Percentage: 2021 Versus 2028
Figure 24. Global Indium Tin Oxide Sales Market Share by Region (2017-2022)
Figure 25. Global Indium Tin Oxide Sales Market Share by Region (2023-2028)
Figure 26. North America Indium Tin Oxide Sales YoY (2017-2028) & (MT)
Figure 27. North America Indium Tin Oxide Revenue YoY (2017-2028) & (US$ Million)
Figure 28. Europe Indium Tin Oxide Sales YoY (2017-2028) & (MT)
Figure 29. Europe Indium Tin Oxide Revenue YoY (2017-2028) & (US$ Million)
Figure 30. Asia-Pacific Indium Tin Oxide Sales YoY (2017-2028) & (MT)
Figure 31. Asia-Pacific Indium Tin Oxide Revenue YoY (2017-2028) & (US$ Million)
Figure 32. Latin America Indium Tin Oxide Sales YoY (2017-2028) & (MT)
Figure 33. Latin America Indium Tin Oxide Revenue YoY (2017-2028) & (US$ Million)
Figure 34. Middle East & Africa Indium Tin Oxide Sales YoY (2017-2028) & (MT)
Figure 35. Middle East & Africa Indium Tin Oxide Revenue YoY (2017-2028) & (US$ Million)
Figure 36. The Indium Tin Oxide Market Share of Top 10 and Top 5 Largest Manufacturers Around the World in 2021
Figure 37. The Top 5 and 10 Largest Manufacturers of Indium Tin Oxide in the World: Market Share by Indium Tin Oxide Revenue in 2021
Figure 38. Indium Tin Oxide Market Share by Company Type (Tier 1, Tier 2, and Tier 3): 2017 VS 2021
Figure 39. Global Indium Tin Oxide Sales Market Share by Type (2017-2028)
Figure 40. Global Indium Tin Oxide Revenue Market Share by Type (2017-2028)
Figure 41. Global Indium Tin Oxide Sales Market Share by Application (2017-2028)
Figure 42. Global Indium Tin Oxide Revenue Market Share by Application (2017-2028)
Figure 43. North America Indium Tin Oxide Sales Market Share by Type (2017-2028)
Figure 44. North America Indium Tin Oxide Revenue Market Share by Type (2017-2028)
Figure 45. North America Indium Tin Oxide Sales Market Share by Application (2017-2028)
Figure 46. North America Indium Tin Oxide Revenue Market Share by Application (2017-2028)
Figure 47. North America Indium Tin Oxide Sales Share by Country (2017-2028)
Figure 48. North America Indium Tin Oxide Revenue Share by Country (2017-2028)
Figure 49. U.S. Indium Tin Oxide Revenue (2017-2028) & (US$ Million)
Figure 50. Canada Indium Tin Oxide Revenue (2017-2028) & (US$ Million)
Figure 51. Europe Indium Tin Oxide Sales Market Share by Type (2017-2028)
Figure 52. Europe Indium Tin Oxide Revenue Market Share by Type (2017-2028)
Figure 53. Europe Indium Tin Oxide Sales Market Share by Application (2017-2028)
Figure 54. Europe Indium Tin Oxide Revenue Market Share by Application (2017-2028)
Figure 55. Europe Indium Tin Oxide Sales Share by Country (2017-2028)
Figure 56. Europe Indium Tin Oxide Revenue Share by Country (2017-2028)
Figure 57. Germany Indium Tin Oxide Revenue (2017-2028) & (US$ Million)
Figure 58. France Indium Tin Oxide Revenue (2017-2028) & (US$ Million)
Figure 59. U.K. Indium Tin Oxide Revenue (2017-2028) & (US$ Million)
Figure 60. Italy Indium Tin Oxide Revenue (2017-2028) & (US$ Million)
Figure 61. Russia Indium Tin Oxide Revenue (2017-2028) & (US$ Million)
Figure 62. Asia Pacific Indium Tin Oxide Sales Market Share by Type (2017-2028)
Figure 63. Asia Pacific Indium Tin Oxide Revenue Market Share by Type (2017-2028)
Figure 64. Asia Pacific Indium Tin Oxide Sales Market Share by Application (2017-2028)
Figure 65. Asia Pacific Indium Tin Oxide Revenue Market Share by Application (2017-2028)
Figure 66. Asia Pacific Indium Tin Oxide Sales Share by Region (2017-2028)
Figure 67. Asia Pacific Indium Tin Oxide Revenue Share by Region (2017-2028)
Figure 68. China Indium Tin Oxide Revenue (2017-2028) & (US$ Million)
Figure 69. Japan Indium Tin Oxide Revenue (2017-2028) & (US$ Million)
Figure 70. South Korea Indium Tin Oxide Revenue (2017-2028) & (US$ Million)
Figure 71. India Indium Tin Oxide Revenue (2017-2028) & (US$ Million)
Figure 72. Australia Indium Tin Oxide Revenue (2017-2028) & (US$ Million)
Figure 73. China Taiwan Indium Tin Oxide Revenue (2017-2028) & (US$ Million)
Figure 74. Indonesia Indium Tin Oxide Revenue (2017-2028) & (US$ Million)
Figure 75. Thailand Indium Tin Oxide Revenue (2017-2028) & (US$ Million)
Figure 76. Malaysia Indium Tin Oxide Revenue (2017-2028) & (US$ Million)
Figure 77. Latin America Indium Tin Oxide Sales Market Share by Type (2017-2028)
Figure 78. Latin America Indium Tin Oxide Revenue Market Share by Type (2017-2028)
Figure 79. Latin America Indium Tin Oxide Sales Market Share by Application (2017-2028)
Figure 80. Latin America Indium Tin Oxide Revenue Market Share by Application (2017-2028)
Figure 81. Latin America Indium Tin Oxide Sales Share by Country (2017-2028)
Figure 82. Latin America Indium Tin Oxide Revenue Share by Country (2017-2028)
Figure 83. Mexico Indium Tin Oxide Revenue (2017-2028) & (US$ Million)
Figure 84. Brazil Indium Tin Oxide Revenue (2017-2028) & (US$ Million)
Figure 85. Argentina Indium Tin Oxide Revenue (2017-2028) & (US$ Million)
Figure 86. Middle East and Africa Indium Tin Oxide Sales Market Share by Type (2017-2028)
Figure 87. Middle East and Africa Indium Tin Oxide Revenue Market Share by Type (2017-2028)
Figure 88. Middle East and Africa Indium Tin Oxide Sales Market Share by Application (2017-2028)
Figure 89. Middle East and Africa Indium Tin Oxide Revenue Market Share by Application (2017-2028)
Figure 90. Middle East and Africa Indium Tin Oxide Sales Share by Country (2017-2028)
Figure 91. Middle East and Africa Indium Tin Oxide Revenue Share by Country (2017-2028)
Figure 92. Turkey Indium Tin Oxide Revenue (2017-2028) & (US$ Million)
Figure 93. Saudi Arabia Indium Tin Oxide Revenue (2017-2028) & (US$ Million)
Figure 94. UAE Indium Tin Oxide Revenue (2017-2028) & (US$ Million)
Figure 95. Indium Tin Oxide Value Chain
Figure 96. Indium Tin Oxide Production Process
Figure 97. Channels of Distribution
Figure 98. Distributors Profiles
Figure 99. Bottom-up and Top-down Approaches for This Report
Figure 100. Data Triangulation
Figure 101. Key Executives Interviewed
$4900
$9800

Add to Cart
Add to Cart
Add to Cart
Add to Cart