
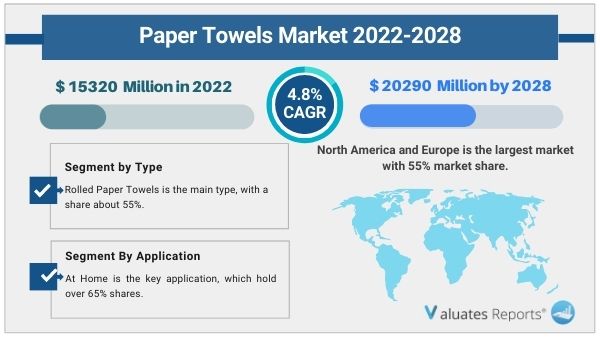
The global paper towels market size is estimated to be worth US$ 15320 million in 2022 and is projected to reach US$ 20290 million by 2028 with a CAGR of 4.8% during the forecast period. The key drivers of the paper towels market include the rising awareness of hygiene and cleanliness among consumers and benefits in comparison to cloth towels. In addition to it, widespread application in homes, offices, cafes, and other areas boost the demand for paper towels thereby driving the growth of the paper towels market during the forecast period. On the other hand, deforestation and issues related to proper disposal will hamper the market growth in the subsequent years.
Rising awareness of hygiene, cleanliness, and benefits in comparison to cloth towels
Hygiene and cleanliness is a top priority for consumers. Health, sanitization especially during the pandemic has gained top precedence. Paper towels help in proper hand hygiene and can remove bacteria effectively. The moisture absorption rate is faster. Moreover paper towels are compact, lightweight, easy to carry and is disposable preventing cross contamination. Thus increasing awareness of health and hygiene along with healthy benefits will drive the growth of the paper towels market during the forecast period.
Widespread application in homes, offices, cafes, hospitals, clinics
Paper towels are being used increasingly in homes as kitchen towels, napkins, removing food spills and in cafes, offices and other establishments. This is due to its fast absorbing rate and cheap cost. Thus due to widespread application in various establishments owing to ease of use and cost efficiency will drive the growth of the paper towels market in the subsequent years.
Deforestation and disposal issues
Paper towels essentially use paper as raw material. These leads to deforestation as more trees are being cut down. Moreover as the towels are disposable the problems related to proper waste management arises further augmenting environmental issues. Thus environmental concerns related to paper towel production will hamper the growth of the paper towel market during the forecast period.
Based on type, the rolled paper towels segment is expected to provide lucrative opportunities for growth and will hold a share of 55% during the forecast period.
Based on application, at home segment is expected to provide huge opportunties for growth and will hold a share of 65% in the coming years.
Based on region, North America and Europe together constitute 55% of the paper towels market share and will provide immense opportunities for growth during the forecast period.
The authors of this research report have explored the key segments: Type and Application. The report offers an in-depth breakdown of type and application segments and their sub-segments. The lucrativeness and growth potential have been looked into by the industry experts in this report. This section of the report also provides sales and revenue forecast data by type and application segments based on sales, price, and revenue for the period 2017-2028. The specialists, to broaden the understanding of the users, have done value chain and raw material analysis in this section.
The authors of this study have enlightened the readers on the rise and effect of the Covid-19 outbreak on the development. They have investigated the changes brought about in the demand/supply side, consumption, supply chain, and sales/manufacturing. The readers will get familiar with the measures that have helped the key players to bring the Paper Towels market back to the pre-covid levels.
In this segment of the report, the specialists have delved into the key growth opportunities that are likely to emerge. This will aid the key players to simplify complex issues related to business and framing future strategies to compete in this competitive environment. This section will certainly assist the players in boldly positioning their business.
In this section of the report, the researchers have done a comprehensive analysis of the prominent players operating and the strategies they are focusing on to combat the intense competition. Company profiles and share analysis of the prominent players are also provided in this section. They have also provided reliable sales and revenue data of the manufacturers for the period 2017-2022. With the assistance of this report, key players, stakeholders, and other participants will be able to stay abreast of the recent and upcoming developments in the business, further enabling them to make efficient choices.
|
Report Metric |
Details |
|
Report Name |
Paper Towels Market |
|
The market size in 2022 |
USD 15320 Million |
|
The revenue forecast in 2028 |
USD 20290 Million |
|
Growth Rate |
Compound Annual Growth Rate (CAGR) of 4.8% from 2022 to 2028 |
|
Market size available for years |
2022-2028 |
|
Forecast units |
Value (USD) |
|
Segments covered |
By Type, Application, and Region |
|
Report coverage |
Revenue & volume forecast, company share, competitive landscape, growth factors, and trends |
|
Geographic regions covered |
North America, Europe, Asia Pacific, Latin America, Middle East & Africa |
Ans. The global Paper Towels market size is projected to reach US$ 20290 million by 2028, from US$ 15320 million in 2022.
Ans. The global Paper Towels market is expected to grow at a compound annual growth rate of 4.8% from 2022 to 2028.
Ans. Some of the major companies are Procter & Gamble (P&G), SCA, Georgia Pacific, Kimberly-Clark, Cascades, Kruger, Metsä Tissue, Heng An, WEPA, Asaleo Care, C&S Paper, Essendant Inc (Boardwalk), Oasis Brands, Seventh Generation.
Table of Contents
1 Study Coverage
1.1 Paper Towels Product Introduction
1.2 Market by Type
1.2.1 Global Paper Towels Market Size Growth Rate by Type, 2017 VS 2021 VS 2028
1.2.2 Rolled Paper Towels
1.2.3 Boxed Paper Towels
1.2.4 Multifold Paper Towels
1.3 Market by Application
1.3.1 Global Paper Towels Market Size Growth Rate by Application, 2017 VS 2021 VS 2028
1.3.2 At Home
1.3.3 Away From Home (AFH)
1.4 Study Objectives
1.5 Years Considered
2 Executive Summary
2.1 Global Paper Towels Sales Estimates and Forecasts 2017-2028
2.2 Global Paper Towels Revenue Estimates and Forecasts 2017-2028
2.3 Global Paper Towels Revenue by Region: 2017 VS 2021 VS 2028
2.4 Global Paper Towels Sales by Region
2.4.1 Global Paper Towels Sales by Region (2017-2022)
2.4.2 Global Sales Paper Towels by Region (2023-2028)
2.5 Global Paper Towels Revenue by Region
2.5.1 Global Paper Towels Revenue by Region (2017-2022)
2.5.2 Global Paper Towels Revenue by Region (2023-2028)
2.6 North America
2.7 Europe
2.8 Asia-Pacific
2.9 Latin America
2.10 Middle East & Africa
3 Competition by Manufacturers
3.1 Global Paper Towels Sales by Manufacturers
3.1.1 Global Top Paper Towels Manufacturers by Sales (2017-2022)
3.1.2 Global Paper Towels Sales Market Share by Manufacturers (2017-2022)
3.1.3 Global Top 10 and Top 5 Largest Manufacturers of Paper Towels in 2021
3.2 Global Paper Towels Revenue by Manufacturers
3.2.1 Global Paper Towels Revenue by Manufacturers (2017-2022)
3.2.2 Global Paper Towels Revenue Market Share by Manufacturers (2017-2022)
3.2.3 Global Top 10 and Top 5 Companies by Paper Towels Revenue in 2021
3.3 Global Paper Towels Sales Price by Manufacturers (2017-2022)
3.4 Analysis of Competitive Landscape
3.4.1 Manufacturers Market Concentration Ratio (CR5 and HHI)
3.4.2 Global Paper Towels Market Share by Company Type (Tier 1, Tier 2, and Tier 3)
3.4.3 Global Paper Towels Manufacturers Geographical Distribution
3.5 Mergers & Acquisitions, Expansion Plans
4 Market Size by Type
4.1 Global Paper Towels Sales by Type
4.1.1 Global Paper Towels Historical Sales by Type (2017-2022)
4.1.2 Global Paper Towels Forecasted Sales by Type (2023-2028)
4.1.3 Global Paper Towels Sales Market Share by Type (2017-2028)
4.2 Global Paper Towels Revenue by Type
4.2.1 Global Paper Towels Historical Revenue by Type (2017-2022)
4.2.2 Global Paper Towels Forecasted Revenue by Type (2023-2028)
4.2.3 Global Paper Towels Revenue Market Share by Type (2017-2028)
4.3 Global Paper Towels Price by Type
4.3.1 Global Paper Towels Price by Type (2017-2022)
4.3.2 Global Paper Towels Price Forecast by Type (2023-2028)
5 Market Size by Application
5.1 Global Paper Towels Sales by Application
5.1.1 Global Paper Towels Historical Sales by Application (2017-2022)
5.1.2 Global Paper Towels Forecasted Sales by Application (2023-2028)
5.1.3 Global Paper Towels Sales Market Share by Application (2017-2028)
5.2 Global Paper Towels Revenue by Application
5.2.1 Global Paper Towels Historical Revenue by Application (2017-2022)
5.2.2 Global Paper Towels Forecasted Revenue by Application (2023-2028)
5.2.3 Global Paper Towels Revenue Market Share by Application (2017-2028)
5.3 Global Paper Towels Price by Application
5.3.1 Global Paper Towels Price by Application (2017-2022)
5.3.2 Global Paper Towels Price Forecast by Application (2023-2028)
6 North America
6.1 North America Paper Towels Market Size by Type
6.1.1 North America Paper Towels Sales by Type (2017-2028)
6.1.2 North America Paper Towels Revenue by Type (2017-2028)
6.2 North America Paper Towels Market Size by Application
6.2.1 North America Paper Towels Sales by Application (2017-2028)
6.2.2 North America Paper Towels Revenue by Application (2017-2028)
6.3 North America Paper Towels Market Size by Country
6.3.1 North America Paper Towels Sales by Country (2017-2028)
6.3.2 North America Paper Towels Revenue by Country (2017-2028)
6.3.3 U.S.
6.3.4 Canada
7 Europe
7.1 Europe Paper Towels Market Size by Type
7.1.1 Europe Paper Towels Sales by Type (2017-2028)
7.1.2 Europe Paper Towels Revenue by Type (2017-2028)
7.2 Europe Paper Towels Market Size by Application
7.2.1 Europe Paper Towels Sales by Application (2017-2028)
7.2.2 Europe Paper Towels Revenue by Application (2017-2028)
7.3 Europe Paper Towels Market Size by Country
7.3.1 Europe Paper Towels Sales by Country (2017-2028)
7.3.2 Europe Paper Towels Revenue by Country (2017-2028)
7.3.3 Germany
7.3.4 France
7.3.5 U.K.
7.3.6 Italy
7.3.7 Russia
8 Asia Pacific
8.1 Asia Pacific Paper Towels Market Size by Type
8.1.1 Asia Pacific Paper Towels Sales by Type (2017-2028)
8.1.2 Asia Pacific Paper Towels Revenue by Type (2017-2028)
8.2 Asia Pacific Paper Towels Market Size by Application
8.2.1 Asia Pacific Paper Towels Sales by Application (2017-2028)
8.2.2 Asia Pacific Paper Towels Revenue by Application (2017-2028)
8.3 Asia Pacific Paper Towels Market Size by Region
8.3.1 Asia Pacific Paper Towels Sales by Region (2017-2028)
8.3.2 Asia Pacific Paper Towels Revenue by Region (2017-2028)
8.3.3 China
8.3.4 Japan
8.3.5 South Korea
8.3.6 India
8.3.7 Australia
8.3.8 China Taiwan
8.3.9 Indonesia
8.3.10 Thailand
8.3.11 Malaysia
9 Latin America
9.1 Latin America Paper Towels Market Size by Type
9.1.1 Latin America Paper Towels Sales by Type (2017-2028)
9.1.2 Latin America Paper Towels Revenue by Type (2017-2028)
9.2 Latin America Paper Towels Market Size by Application
9.2.1 Latin America Paper Towels Sales by Application (2017-2028)
9.2.2 Latin America Paper Towels Revenue by Application (2017-2028)
9.3 Latin America Paper Towels Market Size by Country
9.3.1 Latin America Paper Towels Sales by Country (2017-2028)
9.3.2 Latin America Paper Towels Revenue by Country (2017-2028)
9.3.3 Mexico
9.3.4 Brazil
9.3.5 Argentina
9.3.6 Colombia
10 Middle East and Africa
10.1 Middle East and Africa Paper Towels Market Size by Type
10.1.1 Middle East and Africa Paper Towels Sales by Type (2017-2028)
10.1.2 Middle East and Africa Paper Towels Revenue by Type (2017-2028)
10.2 Middle East and Africa Paper Towels Market Size by Application
10.2.1 Middle East and Africa Paper Towels Sales by Application (2017-2028)
10.2.2 Middle East and Africa Paper Towels Revenue by Application (2017-2028)
10.3 Middle East and Africa Paper Towels Market Size by Country
10.3.1 Middle East and Africa Paper Towels Sales by Country (2017-2028)
10.3.2 Middle East and Africa Paper Towels Revenue by Country (2017-2028)
10.3.3 Turkey
10.3.4 Saudi Arabia
11 Company Profiles
11.1 Procter & Gamble (P&G)
11.1.1 Procter & Gamble (P&G) Corporation Information
11.1.2 Procter & Gamble (P&G) Overview
11.1.3 Procter & Gamble (P&G) Paper Towels Sales, Price, Revenue, and Gross Margin (2017-2022)
11.1.4 Procter & Gamble (P&G) Paper Towels Product Model Numbers, Pictures, Descriptions, and Specifications
11.1.5 Procter & Gamble (P&G) Recent Developments
11.2 SCA
11.2.1 SCA Corporation Information
11.2.2 SCA Overview
11.2.3 SCA Paper Towels Sales, Price, Revenue and Gross Margin (2017-2022)
11.2.4 SCA Paper Towels Product Model Numbers, Pictures, Descriptions, and Specifications
11.2.5 SCA Recent Developments
11.3 Georgia Pacific
11.3.1 Georgia Pacific Corporation Information
11.3.2 Georgia Pacific Overview
11.3.3 Georgia Pacific Paper Towels Sales, Price, Revenue, and Gross Margin (2017-2022)
11.3.4 Georgia Pacific Paper Towels Product Model Numbers, Pictures, Descriptions, and Specifications
11.3.5 Georgia Pacific Recent Developments
11.4 Kimberly-Clark
11.4.1 Kimberly-Clark Corporation Information
11.4.2 Kimberly-Clark Overview
11.4.3 Kimberly-Clark Paper Towels Sales, Price, Revenue, and Gross Margin (2017-2022)
11.4.4 Kimberly-Clark Paper Towels Product Model Numbers, Pictures, Descriptions, and Specifications
11.4.5 Kimberly-Clark Recent Developments
11.5 Cascades
11.5.1 Cascades Corporation Information
11.5.2 Cascades Overview
11.5.3 Cascades Paper Towels Sales, Price, Revenue, and Gross Margin (2017-2022)
11.5.4 Cascades Paper Towels Product Model Numbers, Pictures, Descriptions, and Specifications
11.5.5 Cascades Recent Developments
11.6 Kruger
11.6.1 Kruger Corporation Information
11.6.2 Kruger Overview
11.6.3 Kruger Paper Towels Sales, Price, Revenue and Gross Margin (2017-2022)
11.6.4 Kruger Paper Towels Product Model Numbers, Pictures, Descriptions, and Specifications
11.6.5 Kruger Recent Developments
11.7 Metsä Tissue
11.7.1 Metsä Tissue Corporation Information
11.7.2 Metsä Tissue Overview
11.7.3 Metsä Tissue Paper Towels Sales, Price, Revenue and Gross Margin (2017-2022)
11.7.4 Metsä Tissue Paper Towels Product Model Numbers, Pictures, Descriptions, and Specifications
11.7.5 Metsä Tissue Recent Developments
11.8 Heng An
11.8.1 Heng An Corporation Information
11.8.2 Heng An Overview
11.8.3 Heng An Paper Towels Sales, Price, Revenue and Gross Margin (2017-2022)
11.8.4 Heng An Paper Towels Product Model Numbers, Pictures, Descriptions, and Specifications
11.8.5 Heng An Recent Developments
11.9 WEPA
11.9.1 WEPA Corporation Information
11.9.2 WEPA Overview
11.9.3 WEPA Paper Towels Sales, Price, Revenue and Gross Margin (2017-2022)
11.9.4 WEPA Paper Towels Product Model Numbers, Pictures, Descriptions, and Specifications
11.9.5 WEPA Recent Developments
11.10 Asaleo Care
11.10.1 Asaleo Care Corporation Information
11.10.2 Asaleo Care Overview
11.10.3 Asaleo Care Paper Towels Sales, Price, Revenue, and Gross Margin (2017-2022)
11.10.4 Asaleo Care Paper Towels Product Model Numbers, Pictures, Descriptions, and Specifications
11.10.5 Asaleo Care Recent Developments
11.11 C&S Paper
11.11.1 C&S Paper Corporation Information
11.11.2 C&S Paper Overview
11.11.3 C&S Paper Paper Towels Sales, Price, Revenue and Gross Margin (2017-2022)
11.11.4 C&S Paper Paper Towels Product Model Numbers, Pictures, Descriptions, and Specifications
11.11.5 C&S Paper Recent Developments
11.12 Essendant Inc (Boardwalk)
11.12.1 Essendant Inc (Boardwalk) Corporation Information
11.12.2 Essendant Inc (Boardwalk) Overview
11.12.3 Essendant Inc (Boardwalk) Paper Towels Sales, Price, Revenue and Gross Margin (2017-2022)
11.12.4 Essendant Inc (Boardwalk) Paper Towels Product Model Numbers, Pictures, Descriptions, and Specifications
11.12.5 Essendant Inc (Boardwalk) Recent Developments
11.13 Oasis Brands
11.13.1 Oasis Brands Corporation Information
11.13.2 Oasis Brands Overview
11.13.3 Oasis Brands Paper Towels Sales, Price, Revenue, and Gross Margin (2017-2022)
11.13.4 Oasis Brands Paper Towels Product Model Numbers, Pictures, Descriptions, and Specifications
11.13.5 Oasis Brands Recent Developments
11.14 Seventh Generation
11.14.1 Seventh Generation Corporation Information
11.14.2 Seventh Generation Overview
11.14.3 Seventh Generation Paper Towels Sales, Price, Revenue and Gross Margin (2017-2022)
11.14.4 Seventh Generation Paper Towels Product Model Numbers, Pictures, Descriptions and Specifications
11.14.5 Seventh Generation Recent Developments
12 Industry Chain and Sales Channels Analysis
12.1 Paper Towels Industry Chain Analysis
12.2 Paper Towels Key Raw Materials
12.2.1 Key Raw Materials
12.2.2 Raw Materials Key Suppliers
12.3 Paper Towels Production Mode & Process
12.4 Paper Towels Sales and Marketing
12.4.1 Paper Towels Sales Channels
12.4.2 Paper Towels Distributors
12.5 Paper Towels Customers
13 Market Drivers, Opportunities, Challenges and Risks Factors Analysis
13.1 Paper Towels Industry Trends
13.2 Paper Towels Market Drivers
13.3 Paper Towels Market Challenges
13.4 Paper Towels Market Restraints
14 Key Findings in The Global Paper Towels Study
15 Appendix
15.1 Research Methodology
15.1.1 Methodology/Research Approach
15.1.2 Data Source
15.2 Author Details
15.3 Disclaimer
List of Tables
Table 1. Global Paper Towels Market Size Growth Rate by Type, 2017 VS 2021 VS 2028 (US$ Million)
Table 2. Major Manufacturers of Rolled Paper Towels
Table 3. Major Manufacturers of Boxed Paper Towels
Table 4. Major Manufacturers of Multifold Paper Towels
Table 5. Global Paper Towels Market Size Growth Rate by Application, 2017 VS 2021 VS 2028 (US$ Million)
Table 6. Global Paper Towels Revenue by Region: 2017 VS 2021 VS 2028 (US$ Million)
Table 7. Global Paper Towels Sales by Region (2017-2022) & (K Tonnes)
Table 8. Global Paper Towels Sales Market Share by Region (2017-2022)
Table 9. Global Paper Towels Sales by Region (2023-2028) & (K Tonnes)
Table 10. Global Paper Towels Sales Market Share by Region (2023-2028)
Table 11. Global Paper Towels Revenue by Region (2017-2022) & (US$ Million)
Table 12. Global Paper Towels Revenue Market Share by Region (2017-2022)
Table 13. Global Paper Towels Revenue by Region (2023-2028) & (US$ Million)
Table 14. Global Paper Towels Revenue Market Share by Region (2023-2028)
Table 15. Global Paper Towels Sales by Manufacturers (2017-2022) & (K Tonnes)
Table 16. Global Paper Towels Sales Share by Manufacturers (2017-2022)
Table 17. Global Paper Towels Revenue by Manufacturers (2017-2022) & (US$ Million)
Table 18. Global Paper Towels Revenue Share by Manufacturers (2017-2022)
Table 19. Paper Towels Price by Manufacturers (2017-2022) &(US$/Tonne)
Table 20. Global Paper Towels Manufacturers Market Concentration Ratio (CR5 and HHI)
Table 21. Global Paper Towels by Company Type (Tier 1, Tier 2, and Tier 3) & (based on the Revenue in Paper Towels as of 2021)
Table 22. Paper Towels Manufacturing Base Distribution and Headquarters
Table 23. Manufacturers Paper Towels Product Offered
Table 24. Date of Manufacturers Enter into Paper Towels Market
Table 25. Mergers & Acquisitions, Expansion Plans
Table 26. Global Paper Towels Sales by Type (2017-2022) & (K Tonnes)
Table 27. Global Paper Towels Sales by Type (2023-2028) & (K Tonnes)
Table 28. Global Paper Towels Sales Share by Type (2017-2022)
Table 29. Global Paper Towels Sales Share by Type (2023-2028)
Table 30. Global Paper Towels Revenue by Type (2017-2022) & (US$ Million)
Table 31. Global Paper Towels Revenue by Type (2023-2028) & (US$ Million)
Table 32. Global Paper Towels Revenue Share by Type (2017-2022)
Table 33. Global Paper Towels Revenue Share by Type (2023-2028)
Table 34. Paper Towels Price by Type (2017-2022) & (US$/Tonne)
Table 35. Global Paper Towels Price Forecast by Type (2023-2028) & (US$/Tonne)
Table 36. Global Paper Towels Sales by Application (2017-2022) & (K Tonnes)
Table 37. Global Paper Towels Sales by Application (2023-2028) & (K Tonnes)
Table 38. Global Paper Towels Sales Share by Application (2017-2022)
Table 39. Global Paper Towels Sales Share by Application (2023-2028)
Table 40. Global Paper Towels Revenue by Application (2017-2022) & (US$ Million)
Table 41. Global Paper Towels Revenue by Application (2023-2028) & (US$ Million)
Table 42. Global Paper Towels Revenue Share by Application (2017-2022)
Table 43. Global Paper Towels Revenue Share by Application (2023-2028)
Table 44. Paper Towels Price by Application (2017-2022) & (US$/Tonne)
Table 45. Global Paper Towels Price Forecast by Application (2023-2028) & (US$/Tonne)
Table 46. North America Paper Towels Sales by Type (2017-2022) & (K Tonnes)
Table 47. North America Paper Towels Sales by Type (2023-2028) & (K Tonnes)
Table 48. North America Paper Towels Revenue by Type (2017-2022) & (US$ Million)
Table 49. North America Paper Towels Revenue by Type (2023-2028) & (US$ Million)
Table 50. North America Paper Towels Sales by Application (2017-2022) & (K Tonnes)
Table 51. North America Paper Towels Sales by Application (2023-2028) & (K Tonnes)
Table 52. North America Paper Towels Revenue by Application (2017-2022) & (US$ Million)
Table 53. North America Paper Towels Revenue by Application (2023-2028) & (US$ Million)
Table 54. North America Paper Towels Sales by Country (2017-2022) & (K Tonnes)
Table 55. North America Paper Towels Sales by Country (2023-2028) & (K Tonnes)
Table 56. North America Paper Towels Revenue by Country (2017-2022) & (US$ Million)
Table 57. North America Paper Towels Revenue by Country (2023-2028) & (US$ Million)
Table 58. Europe Paper Towels Sales by Type (2017-2022) & (K Tonnes)
Table 59. Europe Paper Towels Sales by Type (2023-2028) & (K Tonnes)
Table 60. Europe Paper Towels Revenue by Type (2017-2022) & (US$ Million)
Table 61. Europe Paper Towels Revenue by Type (2023-2028) & (US$ Million)
Table 62. Europe Paper Towels Sales by Application (2017-2022) & (K Tonnes)
Table 63. Europe Paper Towels Sales by Application (2023-2028) & (K Tonnes)
Table 64. Europe Paper Towels Revenue by Application (2017-2022) & (US$ Million)
Table 65. Europe Paper Towels Revenue by Application (2023-2028) & (US$ Million)
Table 66. Europe Paper Towels Sales by Country (2017-2022) & (K Tonnes)
Table 67. Europe Paper Towels Sales by Country (2023-2028) & (K Tonnes)
Table 68. Europe Paper Towels Revenue by Country (2017-2022) & (US$ Million)
Table 69. Europe Paper Towels Revenue by Country (2023-2028) & (US$ Million)
Table 70. Asia Pacific Paper Towels Sales by Type (2017-2022) & (K Tonnes)
Table 71. Asia Pacific Paper Towels Sales by Type (2023-2028) & (K Tonnes)
Table 72. Asia Pacific Paper Towels Revenue by Type (2017-2022) & (US$ Million)
Table 73. Asia Pacific Paper Towels Revenue by Type (2023-2028) & (US$ Million)
Table 74. Asia Pacific Paper Towels Sales by Application (2017-2022) & (K Tonnes)
Table 75. Asia Pacific Paper Towels Sales by Application (2023-2028) & (K Tonnes)
Table 76. Asia Pacific Paper Towels Revenue by Application (2017-2022) & (US$ Million)
Table 77. Asia Pacific Paper Towels Revenue by Application (2023-2028) & (US$ Million)
Table 78. Asia Pacific Paper Towels Sales by Region (2017-2022) & (K Tonnes)
Table 79. Asia Pacific Paper Towels Sales by Region (2023-2028) & (K Tonnes)
Table 80. Asia Pacific Paper Towels Revenue by Region (2017-2022) & (US$ Million)
Table 81. Asia Pacific Paper Towels Revenue by Region (2023-2028) & (US$ Million)
Table 82. Latin America Paper Towels Sales by Type (2017-2022) & (K Tonnes)
Table 83. Latin America Paper Towels Sales by Type (2023-2028) & (K Tonnes)
Table 84. Latin America Paper Towels Revenue by Type (2017-2022) & (US$ Million)
Table 85. Latin America Paper Towels Revenue by Type (2023-2028) & (US$ Million)
Table 86. Latin America Paper Towels Sales by Application (2017-2022) & (K Tonnes)
Table 87. Latin America Paper Towels Sales by Application (2023-2028) & (K Tonnes)
Table 88. Latin America Paper Towels Revenue by Application (2017-2022) & (US$ Million)
Table 89. Latin America Paper Towels Revenue by Application (2023-2028) & (US$ Million)
Table 90. Latin America Paper Towels Sales by Country (2017-2022) & (K Tonnes)
Table 91. Latin America Paper Towels Sales by Country (2023-2028) & (K Tonnes)
Table 92. Latin America Paper Towels Revenue by Country (2017-2022) & (US$ Million)
Table 93. Latin America Paper Towels Revenue by Country (2023-2028) & (US$ Million)
Table 94. Middle East and Africa Paper Towels Sales by Type (2017-2022) & (K Tonnes)
Table 95. Middle East and Africa Paper Towels Sales by Type (2023-2028) & (K Tonnes)
Table 96. Middle East and Africa Paper Towels Revenue by Type (2017-2022) & (US$ Million)
Table 97. Middle East and Africa Paper Towels Revenue by Type (2023-2028) & (US$ Million)
Table 98. Middle East and Africa Paper Towels Sales by Application (2017-2022) & (K Tonnes)
Table 99. Middle East and Africa Paper Towels Sales by Application (2023-2028) & (K Tonnes)
Table 100. Middle East and Africa Paper Towels Revenue by Application (2017-2022) & (US$ Million)
Table 101. Middle East and Africa Paper Towels Revenue by Application (2023-2028) & (US$ Million)
Table 102. Middle East and Africa Paper Towels Sales by Country (2017-2022) & (K Tonnes)
Table 103. Middle East and Africa Paper Towels Sales by Country (2023-2028) & (K Tonnes)
Table 104. Middle East and Africa Paper Towels Revenue by Country (2017-2022) & (US$ Million)
Table 105. Middle East and Africa Paper Towels Revenue by Country (2023-2028) & (US$ Million)
Table 106. Procter & Gamble (P&G) Corporation Information
Table 107. Procter & Gamble (P&G) Description and Major Businesses
Table 108. Procter & Gamble (P&G) Paper Towels Sales (K Tonnes), Revenue (US$ Million), Price (US$/Tonne) and Gross Margin (2017-2022)
Table 109. Procter & Gamble (P&G) Paper Towels Product Model Numbers, Pictures, Descriptions and Specifications
Table 110. Procter & Gamble (P&G) Recent Developments
Table 111. SCA Corporation Information
Table 112. SCA Description and Major Businesses
Table 113. SCA Paper Towels Sales (K Tonnes), Revenue (US$ Million), Price (US$/Tonne) and Gross Margin (2017-2022)
Table 114. SCA Paper Towels Product Model Numbers, Pictures, Descriptions and Specifications
Table 115. SCA Recent Developments
Table 116. Georgia Pacific Corporation Information
Table 117. Georgia Pacific Description and Major Businesses
Table 118. Georgia Pacific Paper Towels Sales (K Tonnes), Revenue (US$ Million), Price (US$/Tonne) and Gross Margin (2017-2022)
Table 119. Georgia Pacific Paper Towels Product Model Numbers, Pictures, Descriptions and Specifications
Table 120. Georgia Pacific Recent Developments
Table 121. Kimberly-Clark Corporation Information
Table 122. Kimberly-Clark Description and Major Businesses
Table 123. Kimberly-Clark Paper Towels Sales (K Tonnes), Revenue (US$ Million), Price (US$/Tonne) and Gross Margin (2017-2022)
Table 124. Kimberly-Clark Paper Towels Product Model Numbers, Pictures, Descriptions and Specifications
Table 125. Kimberly-Clark Recent Developments
Table 126. Cascades Corporation Information
Table 127. Cascades Description and Major Businesses
Table 128. Cascades Paper Towels Sales (K Tonnes), Revenue (US$ Million), Price (US$/Tonne) and Gross Margin (2017-2022)
Table 129. Cascades Paper Towels Product Model Numbers, Pictures, Descriptions and Specifications
Table 130. Cascades Recent Developments
Table 131. Kruger Corporation Information
Table 132. Kruger Description and Major Businesses
Table 133. Kruger Paper Towels Sales (K Tonnes), Revenue (US$ Million), Price (US$/Tonne) and Gross Margin (2017-2022)
Table 134. Kruger Paper Towels Product Model Numbers, Pictures, Descriptions and Specifications
Table 135. Kruger Recent Developments
Table 136. Metsä Tissue Corporation Information
Table 137. Metsä Tissue Description and Major Businesses
Table 138. Metsä Tissue Paper Towels Sales (K Tonnes), Revenue (US$ Million), Price (US$/Tonne) and Gross Margin (2017-2022)
Table 139. Metsä Tissue Paper Towels Product Model Numbers, Pictures, Descriptions and Specifications
Table 140. Metsä Tissue Recent Developments
Table 141. Heng An Corporation Information
Table 142. Heng An Description and Major Businesses
Table 143. Heng An Paper Towels Sales (K Tonnes), Revenue (US$ Million), Price (US$/Tonne) and Gross Margin (2017-2022)
Table 144. Heng An Paper Towels Product Model Numbers, Pictures, Descriptions and Specifications
Table 145. Heng An Recent Developments
Table 146. WEPA Corporation Information
Table 147. WEPA Description and Major Businesses
Table 148. WEPA Paper Towels Sales (K Tonnes), Revenue (US$ Million), Price (US$/Tonne) and Gross Margin (2017-2022)
Table 149. WEPA Paper Towels Product Model Numbers, Pictures, Descriptions and Specifications
Table 150. WEPA Recent Developments
Table 151. Asaleo Care Corporation Information
Table 152. Asaleo Care Description and Major Businesses
Table 153. Asaleo Care Paper Towels Sales (K Tonnes), Revenue (US$ Million), Price (US$/Tonne), and Gross Margin (2017-2022)
Table 154. Asaleo Care Paper Towels Product Model Numbers, Pictures, Descriptions, and Specifications
Table 155. Asaleo Care Recent Developments
Table 156. C&S Paper Corporation Information
Table 157. C&S Paper Description and Major Businesses
Table 158. C&S Paper Paper Towels Sales (K Tonnes), Revenue (US$ Million), Price (US$/Tonne), and Gross Margin (2017-2022)
Table 159. C&S Paper Paper Towels Product Model Numbers, Pictures, Descriptions, and Specifications
Table 160. C&S Paper Recent Developments
Table 161. Essendant Inc (Boardwalk) Corporation Information
Table 162. Essendant Inc (Boardwalk) Description and Major Businesses
Table 163. Essendant Inc (Boardwalk) Paper Towels Sales (K Tonnes), Revenue (US$ Million), Price (US$/Tonne) and Gross Margin (2017-2022)
Table 164. Essendant Inc (Boardwalk) Paper Towels Product Model Numbers, Pictures, Descriptions and Specifications
Table 165. Essendant Inc (Boardwalk) Recent Developments
Table 166. Oasis Brands Corporation Information
Table 167. Oasis Brands Description and Major Businesses
Table 168. Oasis Brands Paper Towels Sales (K Tonnes), Revenue (US$ Million), Price (US$/Tonne) and Gross Margin (2017-2022)
Table 169. Oasis Brands Paper Towels Product Model Numbers, Pictures, Descriptions and Specifications
Table 170. Oasis Brands Recent Developments
Table 171. Seventh Generation Corporation Information
Table 172. Seventh Generation Description and Major Businesses
Table 173. Seventh Generation Paper Towels Sales (K Tonnes), Revenue (US$ Million), Price (US$/Tonne) and Gross Margin (2017-2022)
Table 174. Seventh Generation Paper Towels Product Model Numbers, Pictures, Descriptions and Specifications
Table 175. Seventh Generation Recent Developments
Table 176. Key Raw Materials Lists
Table 177. Raw Materials Key Suppliers Lists
Table 178. Paper Towels Distributors List
Table 179. Paper Towels Customers List
Table 180. Paper Towels Market Trends
Table 181. Paper Towels Market Drivers
Table 182. Paper Towels Market Challenges
Table 183. Paper Towels Market Restraints
Table 184. Research Programs/Design for This Report
Table 185. Key Data Information from Secondary Sources
Table 186. Key Data Information from Primary Sources
List of Figures
Figure 1. Paper Towels Product Picture
Figure 3. Global Paper Towels Market Share by Type in 2021 & 2028
Figure 3. Rolled Paper Towels Product Picture
Figure 4. Boxed Paper Towels Product Picture
Figure 5. Multifold Paper Towels Product Picture
Figure 6. Global Paper Towels Market Share by Application in 2021 & 2028
Figure 7. At Home
Figure 8. Away From Home (AFH)
Figure 9. Paper Towels Report Years Considered
Figure 10. Global Paper Towels Sales 2017-2028 (K Tonnes)
Figure 11. Global Paper Towels Revenue, (US$ Million), 2017 VS 2021 VS 2028
Figure 12. Global Paper Towels Revenue 2017-2028 (US$ Million)
Figure 13. Global Paper Towels Revenue Market Share by Region in Percentage: 2021 Versus 2028
Figure 14. Global Paper Towels Sales Market Share by Region (2017-2022)
Figure 15. Global Paper Towels Sales Market Share by Region (2023-2028)
Figure 16. North America Paper Towels Sales YoY (2017-2028) & (K Tonnes)
Figure 17. North America Paper Towels Revenue YoY (2017-2028) & (US$ Million)
Figure 18. Europe Paper Towels Sales YoY (2017-2028) & (K Tonnes)
Figure 19. Europe Paper Towels Revenue YoY (2017-2028) & (US$ Million)
Figure 20. Asia-Pacific Paper Towels Sales YoY (2017-2028) & (K Tonnes)
Figure 21. Asia-Pacific Paper Towels Revenue YoY (2017-2028) & (US$ Million)
Figure 22. Latin America Paper Towels Sales YoY (2017-2028) & (K Tonnes)
Figure 23. Latin America Paper Towels Revenue YoY (2017-2028) & (US$ Million)
Figure 24. Middle East & Africa Paper Towels Sales YoY (2017-2028) & (K Tonnes)
Figure 25. Middle East & Africa Paper Towels Revenue YoY (2017-2028) & (US$ Million)
Figure 26. The Paper Towels Market Share of Top 10 and Top 5 Largest Manufacturers Around the World in 2021
Figure 27. The Top 5 and 10 Largest Manufacturers of Paper Towels in the World: Market Share by Paper Towels Revenue in 2021
Figure 28. Global Paper Towels Market Share by Company Type (Tier 1, Tier 2, and Tier 3): 2017 VS 2021
Figure 29. Global Paper Towels Sales Market Share by Type (2017-2028)
Figure 30. Global Paper Towels Revenue Market Share by Type (2017-2028)
Figure 31. Global Paper Towels Sales Market Share by Application (2017-2028)
Figure 32. Global Paper Towels Revenue Market Share by Application (2017-2028)
Figure 33. North America Paper Towels Sales Market Share by Type (2017-2028)
Figure 34. North America Paper Towels Revenue Market Share by Type (2017-2028)
Figure 35. North America Paper Towels Sales Market Share by Application (2017-2028)
Figure 36. North America Paper Towels Revenue Market Share by Application (2017-2028)
Figure 37. North America Paper Towels Sales Share by Country (2017-2028)
Figure 38. North America Paper Towels Revenue Share by Country (2017-2028)
Figure 39. U.S. Paper Towels Revenue (2017-2028) & (US$ Million)
Figure 40. Canada Paper Towels Revenue (2017-2028) & (US$ Million)
Figure 41. Europe Paper Towels Sales Market Share by Type (2017-2028)
Figure 42. Europe Paper Towels Revenue Market Share by Type (2017-2028)
Figure 43. Europe Paper Towels Sales Market Share by Application (2017-2028)
Figure 44. Europe Paper Towels Revenue Market Share by Application (2017-2028)
Figure 45. Europe Paper Towels Sales Share by Country (2017-2028)
Figure 46. Europe Paper Towels Revenue Share by Country (2017-2028)
Figure 47. Germany Paper Towels Revenue (2017-2028) & (US$ Million)
Figure 48. France Paper Towels Revenue (2017-2028) & (US$ Million)
Figure 49. U.K. Paper Towels Revenue (2017-2028) & (US$ Million)
Figure 50. Italy Paper Towels Revenue (2017-2028) & (US$ Million)
Figure 51. Russia Paper Towels Revenue (2017-2028) & (US$ Million)
Figure 52. Asia Pacific Paper Towels Sales Market Share by Type (2017-2028)
Figure 53. Asia Pacific Paper Towels Revenue Market Share by Type (2017-2028)
Figure 54. Asia Pacific Paper Towels Sales Market Share by Application (2017-2028)
Figure 55. Asia Pacific Paper Towels Revenue Market Share by Application (2017-2028)
Figure 56. Asia Pacific Paper Towels Sales Share by Region (2017-2028)
Figure 57. Asia Pacific Paper Towels Revenue Share by Region (2017-2028)
Figure 58. China Paper Towels Revenue (2017-2028) & (US$ Million)
Figure 59. Japan Paper Towels Revenue (2017-2028) & (US$ Million)
Figure 60. South Korea Paper Towels Revenue (2017-2028) & (US$ Million)
Figure 61. India Paper Towels Revenue (2017-2028) & (US$ Million)
Figure 62. Australia Paper Towels Revenue (2017-2028) & (US$ Million)
Figure 63. China Taiwan Paper Towels Revenue (2017-2028) & (US$ Million)
Figure 64. Indonesia Paper Towels Revenue (2017-2028) & (US$ Million)
Figure 65. Thailand Paper Towels Revenue (2017-2028) & (US$ Million)
Figure 66. Malaysia Paper Towels Revenue (2017-2028) & (US$ Million)
Figure 67. Latin America Paper Towels Sales Market Share by Type (2017-2028)
Figure 68. Latin America Paper Towels Revenue Market Share by Type (2017-2028)
Figure 69. Latin America Paper Towels Sales Market Share by Application (2017-2028)
Figure 70. Latin America Paper Towels Revenue Market Share by Application (2017-2028)
Figure 71. Latin America Paper Towels Sales Share by Country (2017-2028)
Figure 72. Latin America Paper Towels Revenue Share by Country (2017-2028)
Figure 73. Mexico Paper Towels Revenue (2017-2028) & (US$ Million)
Figure 74. Brazil Paper Towels Revenue (2017-2028) & (US$ Million)
Figure 75. Argentina Paper Towels Revenue (2017-2028) & (US$ Million)
Figure 76. Colombia Paper Towels Revenue (2017-2028) & (US$ Million)
Figure 77. Middle East and Africa Paper Towels Sales Market Share by Type (2017-2028)
Figure 78. Middle East and Africa Paper Towels Revenue Market Share by Type (2017-2028)
Figure 79. Middle East and Africa Paper Towels Sales Market Share by Application (2017-2028)
Figure 80. Middle East and Africa Paper Towels Revenue Market Share by Application (2017-2028)
Figure 81. Middle East and Africa Paper Towels Sales Share by Country (2017-2028)
Figure 82. Middle East and Africa Paper Towels Revenue Share by Country (2017-2028)
Figure 83. Turkey Paper Towels Revenue (2017-2028) & (US$ Million)
Figure 84. Saudi Arabia Paper Towels Revenue (2017-2028) & (US$ Million)
Figure 85. UAE Paper Towels Revenue (2017-2028) & (US$ Million)
Figure 86. Paper Towels Value Chain
Figure 87. Paper Towels Production Process
Figure 88. Channels of Distribution
Figure 89. Distributors Profiles
Figure 90. Bottom-up and Top-down Approaches for This Report
Figure 91. Data Triangulation
Figure 92. Key Executives Interviewed
$4900
$9800

Add to Cart
Add to Cart
Add to Cart
Add to Cart