
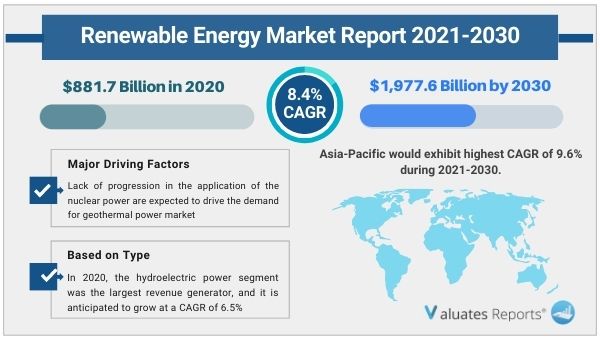
The global renewable energy market was valued at $881.7 billion in 2020, and is projected to reach $1,977.6 billion by 2030, growing at a CAGR of 8.4% from 2021 to 2030. Renewable energy, even referred as clean energy, is usually derived from natural sources that are constantly replenished. Wind energy, a type of renewable energy, is used to generate electric energy from kinetic energy source. Wind turbine converts the wind energy into mechanical energy, which is further converted into electrical energy through generator. Wind energy can be generated offshore and onshore. Onshore wind energy is associated with onshore turbines that are located on land, whereas offshore wind turbines are found in ocean or sea.
The global renewable energy market has been negatively hampered due to wake of COVID-19 pandemic. During high wind season, planned maintenance has become a major issue for industry players, owing to reduced labor force and social distancing norms. Furthermore, project delays and cancellation of orders has affected the key markets for both blade production and wind turbine installations.
Renewable energy is derived from natural sources such as wind and sunlight. Solar, geothermal, wind, bioenergy, hydropower, and ocean power are some of the major sources of renewable energy. Currently, renewable energy is utilized in heating, electricity, cooling, and transport sectors. Renewable energy collectively provides around 7% of the world’s energy demand. Renewable energy is relatively more expensive than fossil fuel. Several factors are responsible to drive the usage of renewable energies, the most crucial being the attribution of global warming due to carbon dioxide (CO2) emission from the combustion of fossil fuels. The concern about the reduction of greenhouse gas emissions, increase in search for energy security along with the aversion to traditional nuclear power, and lack of progression in the application of the nuclear power are expected to drive the demand for geothermal power market during the forecast period. Governments of various developing and developed countries have focused on promoting renewable energy sources due to increase in output efficiency, less pollution, and low maintenance costs. All these factors collectively surge the demand for renewable energy, thereby augmenting the global renewable energy market growth.
However, developing new resources requires large initial investments to build infrastructure. These investments increase the cost of providing electricity, especially during early years. Initially, the developers need to find publicly acceptable sites with good resources and with access to transmission lines. Finding a potential solar site requires several years of monitoring to determine whether they are suitable or not. In addition, the workers need to be trained to install, operate, and maintain the new technologies. Some require operating experiences in certain climatic conditions, before the performance can be optimized. This factor is likely to restrain the growth of the renewable energy market during the forecast period.
On the contrary, economies such as China and India are expected to drive the demand for geothermal power sector. A significant increase in energy demand owing to surge in investment in renewable energy projects has been witnessed in countries such as China and India. The residential and industrial sectors are expected to consume more energy during the forecast period in Asia-Pacific. Furthermore, India has significant growth potential; however, due to its inconsistent policy and business environment in past, the renewable energy share in total energy production was less. There has been an increase in investments in renewable energy projects in India, owing to which it is one of the countries experiencing rapid growth in the Asia-Pacific market.
For instance, a shift in trend toward use of localized energy procurement can be seen in the recent years. Various government bodies in countries such as India have taken the advantage of community choice aggregation (CCA) policies, which permits government to procure renewable energy resources on behalf of their constituents while retaining their existing electricity provider for transmission and distribution services. All these factors are expected to offer future growth opportunities to the global renewable energy market.
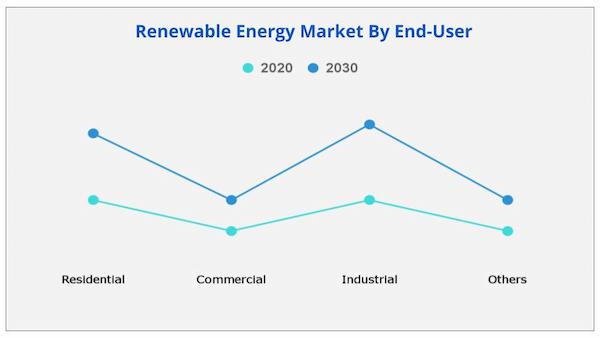
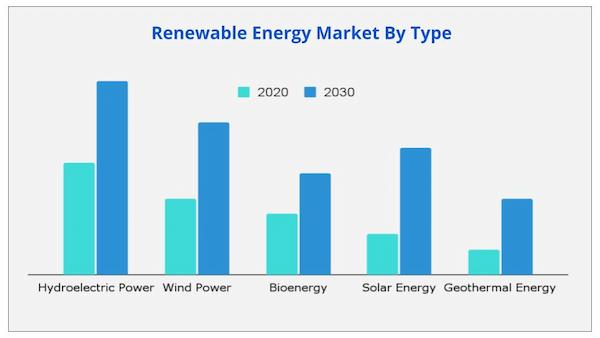
The renewable energy market analysis is done on the basis of type, end-use, and region. On the basis of type, the market is categorized into hydroelectric power, wind power, bioenergy, solar energy, and geothermal energy. The end-user covered in the study includes residential, commercial, industrial, and others. Region wise, the market is studied across North America, Europe, Asia-Pacific, and LAMEA.
The major companies profiled in this report include ABB, Acciona, EDF, Enel Spa, General Electric, Innergex, Invenergy, National Grid Renewables, The Tata Power Company Limited (Tata Power), and Xcel Energy Inc.
Asia-Pacific renewable energy market size is projected to grow at a CAGR of 9.6% during the forecast period and accounted for 35.2% of renewable energy market share in 2020. The region accounts for more than half of the global energy consumption, owing to rise in industrialization as well increase in population. The renewable energy market has grown considerably in countries such as China and India. China became the world’s largest producer of bioelectricity in 2017 and now it is one the key players in hydropower, onshore, wind power and solar photovoltaic, and.
In 2020, the hydroelectric power segment was the largest revenue generator, and it is anticipated to grow at a CAGR of 6.5% during the forecast period. A significant amount of hydropower development took place in Brazil. An increase in activity has been witnessed across the continent, with notable projects in Colombia and Peru. Surge in investments for off-grid energy generation and rural electrification across developing countries, such as India, China, Brazil, and Vietnam, has increased the demand for small hydropower plants. In addition, initiatives such as the Small Hydropower Programme by the Ministry of New and Renewable Energy and Rajiv Gandhi Grameen Vidyutikaran Yojana taken by the Government of India to electrify rural areas and promote the utilization of small hydropower energy for off-grid and mini-grid is expected to drive the growth of the market.
By end use, the ryesidential segment acquired the top position of the global market in 2020, and it is anticipated to grow at a CAGR of 8.4% during the forecast period. Increase in use of geothermal heat pump in residential heating application is expected to drive the growth of the market. The requirement of geothermal power is expected to increase significantly with rise in demand for electricity. This factor is expected to drive the growth of the market. Several companies in the market offer geothermal power to the residential sectors. Enel Green Power is one such company that owns the power plants at a complex and serves approximately two million families, 8,700 residential & business customers, and 25ha of greenhouses. Implementation of government initiatives in developed as well as developing economies to curb carbon emission and to reduce the usage of conventional fuels to generate energy has increased the usage of rooftop solar energy systems to generate electricity for household purposes.
|
Report Metric |
Details |
|
Report Name |
Renewable Energy Market |
|
The market size in 2020 |
USD 881.7 Billion |
|
The revenue forecast in 2030 |
USD 1,977.6 Billion |
|
Growth Rate |
CAGR of 8.4% from 2021 to 2030 |
|
Market size available for years |
2021-2030 |
|
Forecast units |
Value (USD) |
|
Segments covered |
By Type, End-User, and Region |
|
Report coverage |
Revenue & volume forecast, company share, competitive landscape, growth factors, and trends |
|
Geographic regions covered |
North America, Europe, Asia Pacific, Latin America, Middle East & Africa |
|
Key Companies |
ABB, ACCIONA, EDF, Enel Spa, General Electric, Geronimo Energy, Invenergy, Innergex, THE TATA POWER COMPANY LIMITED (Tata Power), Xcel Energy Inc. |
Ans. The global renewable energy market was valued at $881.7 billion in 2020, and is projected to reach $1,977.6 billion by 2030, growing at a CAGR of 8.4% from 2021 to 2030.
Ans. Rise in demand for renewable energy, surge in electricity consumption, and increase in legislative & financial initiatives are the driving factors in the renewable energy market. Emerging economies such as India and China are driving the demand of renewable energy is the opportunity in the global market.
Ans. Europe region will provide more business opportunities for renewable energy in future.
Ans. Hydroelectric power segment holds the maximum share of the renewable energy market.
Ans. Residential are the potential customers of Renewable Energy industry.
Table of Content
CHAPTER 1:INTRODUCTION
1.1.Report description
1.2.Key benefits for stakeholders
1.3.Key market segments
1.4.Research methodology
1.4.1.Secondary research
1.4.2.Primary research
1.5.Analyst tools and models
CHAPTER 2:EXECUTIVE SUMMARY
2.1.Key findings of the study
2.2.CXO perspective
CHAPTER 3:MARKET OVERVIEW
3.1.Market definition and scope
3.2.Key findings
3.2.1.Top investment pockets
3.3.Porter’s five forces analysis
3.4.Market dynamics
3.4.1.Drivers
3.4.1.1.Rise in demand for renewable energy
3.4.1.2.Surge in electricity consumption
3.4.1.3.Increase in legislative and financial initiatives
3.4.2.Restraint
3.4.2.1.Huge investments
3.4.3.Opportunity
3.4.3.1.Emerging economies such as India and China driving the demand of the renewable energy
3.5.Value chain analysis
3.6.Pricing analysis
3.7.Impact of key regulations on the global renewable energy market
3.8.Impact of COVID-19 on the global renewable energy market
3.9.Patent analysis, 2012-2021
CHAPTER 4:GLOBAL RENEWABLE ENERGY MARKET, BY TYPE
4.1.Overview
4.1.1.Market size and forecast, by type
4.2.Hydroelectric power
4.2.1.Key market trends, growth factors, and opportunities
4.2.2.Market size and forecast, by region
4.2.3.Market share analysis, by country
4.3.Wind power
4.3.1.Key market trends, growth factors, and opportunities
4.3.2.Market size and forecast, by region
4.3.3.Market share analysis, by country
4.4.Bioenergy
4.4.1.Key market trends, growth factors, and opportunities
4.4.2.Market size and forecast, by region
4.4.3.Market share analysis, by country
4.5.Solar
4.5.1.Key market trends, growth factors, and opportunities
4.5.2.Market size and forecast, by region
4.5.3.Market share analysis, by country
4.6.Geothermal
4.6.1.Key market trends, growth factors, and opportunities
4.6.2.Market size and forecast, by region
4.6.3.Market share analysis, by country
CHAPTER 5:GLOBAL RENEWABLE ENERGY MARKET, BY END USE
5.1.Overview
5.1.1.Market size and forecast, by end use
5.2.Residential
5.2.1.Key market trends, growth factors, and opportunities
5.2.2.Market size and forecast, by region
5.2.3.Market share analysis, by country
5.3.Commercial
5.3.1.Key market trends, growth factors, and opportunities
5.3.2.Market size and forecast, by region
5.3.3.Market share analysis, by country
5.4.Industrial
5.4.1.Key market trends, growth factors, and opportunities
5.4.2.Market size and forecast, by region
5.4.3.Market share analysis, by country
5.5.Others
5.5.1.Key market trends, growth factors, and opportunities
5.5.2.Market size and forecast, by region
5.5.3.Market share analysis, by country
CHAPTER 6:RENEWABLE ENERGY MARKET, BY REGION
6.1.Overview
6.1.1.Market size and forecast
6.2.North America
6.2.1.Key market trends, growth factors, and opportunities
6.2.2.Market size and forecast, by type
6.2.3.Market size and forecast, by end use
6.2.4.Market share analysis, by country
6.2.4.1.U.S.
6.2.4.1.1.Market size and forecast, by type
6.2.4.1.2.Market size and forecast, by end use
6.2.4.2.Canada
6.2.4.2.1.Market size and forecast, by type
6.2.4.2.2.Market size and forecast, by end use
6.2.4.3.Mexico
6.2.4.3.1.Market size and forecast, by type
6.2.4.3.2.Market size and forecast, by end use
6.3.Europe
6.3.1.Key market trends, growth factors, and opportunities
6.3.2.Market size and forecast, by type
6.3.3.Market size and forecast, by end use
6.3.4.Market share analysis, by country
6.3.4.1.Sweden
6.3.4.1.1.Market size and forecast, by type
6.3.4.1.2.Market size and forecast, by end use
6.3.4.2.Austria
6.3.4.2.1.Market size and forecast, by type
6.3.4.2.2.Market size and forecast, by end use
6.3.4.3.Germany
6.3.4.3.1.Market size and forecast, by type
6.3.4.3.2.Market size and forecast, by end use
6.3.4.4.France
6.3.4.4.1.Market size and forecast, by type
6.3.4.4.2.Market size and forecast, by end use
6.3.4.5.Italy
6.3.4.5.1.Market size and forecast, by type
6.3.4.5.2.Market size and forecast, by end use
6.3.4.6.Spain
6.3.4.6.1.Market size and forecast, by type
6.3.4.6.2.Market size and forecast, by end use
6.3.4.7.UK
6.3.4.7.1.Market size and forecast, by type
6.3.4.7.2.Market size and forecast, by end use
6.3.4.8.Rest of Europe
6.3.4.8.1.Market size and forecast, by type
6.3.4.8.2.Market size and forecast, by end use
6.4.Asia-Pacific
6.4.1.Key market trends, growth factors, and opportunities
6.4.2.Market size and forecast, by type
6.4.3.Market size and forecast, by end use
6.4.4.Market share analysis, by country
6.4.4.1.China
6.4.4.1.1.Market size and forecast, by type
6.4.4.1.2.Market size and forecast, by end use
6.4.4.2.India
6.4.4.2.1.Market size and forecast, by type
6.4.4.2.2.Market size and forecast, by end use
6.4.4.3.South Korea
6.4.4.3.1.Market size and forecast, by type
6.4.4.3.2.Market size and forecast, by end use
6.4.4.4.Australia
6.4.4.4.1.Market size and forecast, by type
6.4.4.4.2.Market size and forecast, by end use
6.4.4.5.Indonesia
6.4.4.5.1.Market size and forecast, by type
6.4.4.5.2.Market size and forecast, by end use
6.4.4.6.Japan
6.4.4.6.1.Market size and forecast, by type
6.4.4.6.2.Market size and forecast, by end use
6.4.4.7.Rest of Asia-Pacific
6.4.4.7.1.Market size and forecast, by type
6.4.4.7.2.Market size and forecast, by end use
6.5.LAMEA
6.5.1.Key market trends, growth factors, and opportunities
6.5.2.Market size and forecast, by type
6.5.3.Market size and forecast, by end use
6.5.4.Market share analysis, by country
6.5.4.1.Brazil
6.5.4.1.1.Market size and forecast, by type
6.5.4.1.2.Market size and forecast, by end use
6.5.4.2.Saudi Arabia
6.5.4.2.1.Market size and forecast, by type
6.5.4.2.2.Market size and forecast, by end use
6.5.4.3.South Africa
6.5.4.3.1.Market size and forecast, by type
6.5.4.3.2.Market size and forecast, by end use
6.5.4.4.Rest of LAMEA
6.5.4.4.1.Market size and forecast, by type
6.5.4.4.2.Market size and forecast, by end use
CHAPTER 7:COMPETITIVE LANDSCAPE
7.1.Introduction
7.1.1.Market player positioning, 2020
7.2.Top winning strategies
7.2.1.Top winning strategies, by year
7.2.2.Top winning strategies, by development
7.2.3.Top winning strategies, by company
7.3.Product mapping of top 10 player
7.4.Competitive dashboard
7.5.Competitive heatmap
7.6.Key developments
7.6.1.Expansions
7.6.2.Other developments
CHAPTER 8:COMPANY PROFILES
8.1.ABB
8.1.1.Company overview
8.1.2.Company snapshot
8.1.3.Operating business segments
8.1.4.Product portfolio
8.1.5.Business performance
8.1.6.Key strategic moves and developments
8.2.ACCIONA
8.2.1.Company overview
8.2.2.Company snapshot
8.2.3.Operating business segments
8.2.4.Product portfolio
8.2.5.Business performance
8.2.6.Key strategic moves and developments
8.3.EDF
8.3.1.Company overview
8.3.2.Company snapshot
8.3.3.Operating business segments
8.3.4.Plant portfolio
8.3.5.Business performance
8.3.6.Key strategic moves and developments
8.4.ENEL SPA
8.4.1.Company overview
8.4.2.Company snapshot
8.4.3.Operating business segments
8.4.4.Product portfolio
8.4.5.Business performance
8.4.6.Key strategic moves and developments
8.5.GENERAL ELECTRIC
8.5.1.Company overview
8.5.2.Company snapshot
8.5.3.Operating business segments
8.5.4.Product portfolio
8.5.5.Business performance
8.5.6.Key strategic moves and developments
8.6.INNERGEX
8.6.1.Company overview
8.6.2.Company snapshot
8.6.3.Operating business segments
8.6.4.Plant portfolio
8.6.5.Business performance
8.6.6.Key strategic moves and developments
8.7.INVENERGY
8.7.1.Company overview
8.7.2.Company snapshot
8.7.3.Product portfolio
8.8.NATIONAL GRID RENEWABLES
8.8.1.Company overview
8.8.2.Company snapshot
8.8.3.Operating business segments
8.8.4.Product portfolio
8.8.5.Key strategic moves and developments
8.9.THE TATA POWER COMPANY LIMITED (TATA POWER)
8.9.1.Company overview
8.9.2.Company snapshot
8.9.3.Operating business segments
8.9.4.Product portfolio
8.9.5.Plant portfolio
8.9.6.Business performance
8.9.7.Key strategic moves and developments
8.10.XCEL ENERGY INC.
8.10.1.Company overview
8.10.2.Company snapshot
8.10.3.Operating business segments
8.10.4.Product Portfolio
8.10.5.Business performance
List of Tables & Figures
Table 01.Global Renewable Energy Market, By Type, 2020-2030 ($Billion)
Table 02.Global Renewable Energy Market, By Type, 2020-2030 (Terawatt-Hour)
Table 03.Renewable Energy Market For Hydroelectric Power, By Region, 2020–2030 ($Billion)
Table 04.Renewable Energy Market For Hydroelectric Power, By Region, 2020–2030 (Terawatt-Hour)
Table 05.Renewable Energy Market For Wind Power, By Region, 2020–2030 ($Billion)
Table 06.Renewable Energy Market For Wind Power, By Region, 2020–2030 (Terawatt-Hour)
Table 07.Renewable Energy Market For Bioenergy, By Region, 2020–2030 ($Billion)
Table 08.Renewable Energy Market For Bioenergy, By Region, 2020–2030 (Terawatt-Hour)
Table 09.Renewable Energy Market For Solar, By Region, 2020–2030 ($Billion)
Table 10.Renewable Energy Market For Solar, By Region, 2020–2030 (Terawatt-Hour)
Table 11.Renewable Energy Market For Geothermal, By Region, 2020–2030 ($Billion)
Table 12.Renewable Energy Market For Geothermal, By Region, 2020–2030 (Terawatt-Hour)
Table 13.Global Renewable Energy Market, By End Use, 2020-2030 ($Million)
Table 14.Global Renewable Energy Market, By End Use, 2020-2030 (Kiloton)
Table 15.Renewable Energy Market For Residential, By Region, 2020–2030 ($Million)
Table 16.Renewable Energy Market For Residential, By Region, 2020–2030 (Kiloton)
Table 17.Renewable Energy Market For Commercial, By Region, 2020–2030 ($Million)
Table 18.Renewable Energy Market For Commercial, By Region, 2020–2030 (Kiloton)
Table 19.Renewable Energy Market For Industrial, By Region, 2020–2030 ($Million)
Table 20.Renewable Energy Market For Industrial, By Region, 2020–2030 (Kiloton)
Table 21.Renewable Energy Market For Others, By Region, 2020–2030 ($Million)
Table 22.Renewable Energy Market For Others, By Region, 2020–2030 (Kiloton)
Table 23.Renewable Energy Market, By Region, 2020–2030 ($Billion)
Table 24.Renewable Energy Market, By Region, 2020–2030 (Terawatt-Hour)
Table 25.North America Renewable Energy Market, By Type, 2020–2030 ($Billion)
Table 26.North America Renewable Energy Market, By Type, 2020–2030 (Terawatt-Hour)
Table 27.North America Renewable Energy Market, By End Use, 2020–2030 ($Billion)
Table 28.North America Renewable Energy Market, By End Use, 2020–2030 (Terawatt-Hour)
Table 29.North America Renewable Energy Market, By Country, 2020–2030 ($Billion)
Table 30.North America Renewable Energy Market, By Country, 2020–2030 (Terawatt-Hour)
Table 31.U.S. Renewable Energy Market, By Type, 2020–2030 ($Billion)
Table 32.U.S. Renewable Energy Market, By Type, 2020–2030 (Terawatt-Hour)
Table 33.U.S. Renewable Energy Market, By End Use, 2020–2030 ($Billion)
Table 34.U.S. Renewable Energy Market, By End Use, 2020–2030 (Terawatt-Hour)
Table 35.Canada Renewable Energy Market, By Type, 2020–2030 ($Billion)
Table 36.Canada Renewable Energy Market, By Type, 2020–2030 (Terawatt-Hour)
Table 37.Canada Renewable Energy Market, By End Use, 2020–2030 ($Billion)
Table 38.Canada Renewable Energy Market, By End Use, 2020–2030 (Terawatt-Hour)
Table 39.Mexico Renewable Energy Market, By Type, 2020–2030 ($Billion)
Table 40.Mexico Renewable Energy Market, By Type, 2020–2030 (Terawatt-Hour)
Table 41.Mexico Renewable Energy Market, By End Use, 2020–2030 ($Billion)
Table 42.Mexico Renewable Energy Market, By End Use, 2020–2030 (Terawatt-Hour)
Table 43.Europe Renewable Energy Market, By Type, 2020–2030 ($Billion)
Table 44.Europe Renewable Energy Market, By Type, 2020–2030 (Terawatt-Hour)
Table 45.Europe Renewable Energy Market, By End Use, 2020–2030 ($Billion)
Table 46.Europe Renewable Energy Market, By End Use, 2020–2030 (Terawatt-Hour)
Table 47.Europe Renewable Energy Market, By Country, 2020–2030 ($Billion)
Table 48.Europe Renewable Energy Market, By Country, 2020–2030 (Terawatt-Hour)
Table 49.Sweden Renewable Energy Market, By Type, 2020–2030 ($Billion)
Table 50.Sweden Renewable Energy Market, By Type, 2020–2030 (Terawatt-Hour)
Table 51.Sweden Renewable Energy Market, By End Use, 2020–2030 ($Billion)
Table 52.Sweden Renewable Energy Market, By End Use, 2020–2030 (Terawatt-Hour)
Table 53.Austria Renewable Energy Market, By Type, 2020–2030 ($Billion)
Table 54.Austria Renewable Energy Market, By Type, 2020–2030 (Terawatt-Hour)
Table 55.Austria Renewable Energy Market, By End Use, 2020–2030 ($Billion)
Table 56.Austria Renewable Energy Market, By End Use, 2020–2030 (Terawatt-Hour)
Table 57.Germany Renewable Energy Market, By Type, 2020–2030 ($Billion)
Table 58.Germany Renewable Energy Market, By Type, 2020–2030 (Terawatt-Hour)
Table 59.Germany Renewable Energy Market, By End Use, 2020–2030 ($Billion)
Table 60.Germany Renewable Energy Market, By End Use, 2020–2030 (Terawatt-Hour)
Table 61.France Renewable Energy Market, By Type, 2020–2030 ($Billion)
Table 62.France Renewable Energy Market, By Type, 2020–2030 (Terawatt-Hour)
Table 63.France Renewable Energy Market, By End Use, 2020–2030 ($Billion)
Table 64.France Renewable Energy Market, By End Use, 2020–2030 (Terawatt-Hour)
Table 65.Italy Renewable Energy Market, By Type, 2020–2030 ($Billion)
Table 66.Italy Renewable Energy Market, By Type, 2020–2030 (Terawatt-Hour)
Table 67.Italy Renewable Energy Market, By End Use, 2020–2030 ($Billion)
Table 68.Italy Renewable Energy Market, By End Use, 2020–2030 (Terawatt-Hour)
Table 69.Spain Renewable Energy Market, By Type, 2020–2030 ($Billion)
Table 70.Spain Renewable Energy Market, By Type, 2020–2030 (Terawatt-Hour)
Table 71.Spain Renewable Energy Market, By End Use, 2020–2030 ($Billion)
Table 72.Spain Renewable Energy Market, By End Use, 2020–2030 (Terawatt-Hour)
Table 73.Uk Renewable Energy Market, By Type, 2020–2030 ($Billion)
Table 74.Uk Renewable Energy Market, By Type, 2020–2030 (Terawatt-Hour)
Table 75.Uk Renewable Energy Market, By End Use, 2020–2030 ($Billion)
Table 76.Uk Renewable Energy Market, By End Use, 2020–2030 (Terawatt-Hour)
Table 77.Rest Of Europe Renewable Energy Market, By Type, 2020–2030 ($Billion)
Table 78.Rest Of Europe Renewable Energy Market, By Type, 2020–2030 (Terawatt-Hour)
Table 79.Rest Of Europe Renewable Energy Market, By End Use, 2020–2030 ($Billion)
Table 80.Rest Of Europe Renewable Energy Market, By End Use, 2020–2030 (Terawatt-Hour)
Table 81.Asia-Pacific Renewable Energy Market, By Type, 2020–2030 ($Billion)
Table 82.Asia-Pacific Renewable Energy Market, By Type, 2020–2030 (Twh)
Table 83.Asia-Pacific Renewable Energy Market, By End Use, 2020–2030 ($Billion)
Table 84.Asia-Pacific Renewable Energy Market, By End Use, 2020–2030 (Twh)
Table 85.Asia-Pacific Renewable Energy Market, By Country, 2020–2030 ($Billion)
Table 86.Asia-Pacific Renewable Energy Market, By Country, 2020–2030 (Ton)
Table 87.China Renewable Energy Market, By Type, 2020–2030 ($Billion)
Table 88.China Renewable Energy Market, By Type, 2020–2030 (Twh)
Table 89.China Renewable Energy Market, By End Use, 2020–2030 ($Billion)
Table 90.China Renewable Energy Market, By End Use, 2020–2030 (Twh)
Table 91.India Renewable Energy Market, By Type, 2020–2030 ($Billion)
Table 92.India Renewable Energy Market, By Type, 2020–2030 (Twh)
Table 93.India Renewable Energy Market, By End Use, 2020–2030 ($Billion)
Table 94.India Renewable Energy Market, By End Use, 2020–2030 (Twh)
Table 95.South Korea Renewable Energy Market, By Type, 2020–2030 ($Billion)
Table 96.South Korea Renewable Energy Market, By Type, 2020–2030 (Twh)
Table 97.South Korea Renewable Energy Market, By End Use, 2020–2030 ($Billion)
Table 98.South Korea Renewable Energy Market, By End Use, 2020–2030 (Twh)
Table 99.Australia Renewable Energy Market, By Type, 2020–2030 ($Billion)
Table 100.Australia Renewable Energy Market, By Type, 2020–2030 (Twh)
Table 101.Australia Renewable Energy Market, By End Use, 2020–2030 ($Billion)
Table 102.Australia Renewable Energy Market, By End Use, 2020–2030 (Twh)
Table 103.Indonesia Renewable Energy Market, By Type, 2020–2030 ($Billion)
Table 104.Indonesia Renewable Energy Market, By Type, 2020–2030 (Twh)
Table 105.Indonesia Renewable Energy Market, By End Use, 2020–2030 ($Billion)
Table 106.Indonesia Renewable Energy Market, By End Use, 2020–2030 (Twh)
Table 107.Japan Renewable Energy Market, By Type, 2020–2030 ($Billion)
Table 108.Japan Renewable Energy Market, By Type, 2020–2030 (Twh)
Table 109.Japan Renewable Energy Market, By End Use, 2020–2030 ($Billion)
Table 110.Japan Renewable Energy Market, By End Use, 2020–2030 (Twh)
Table 111.Rest Of Asia-Pacific Renewable Energy Market, By Type, 2020–2030 ($Billion)
Table 112.Rest Of Asia-Pacific Renewable Energy Market, By Type, 2020–2030 (Twh)
Table 113.Rest Of Asia-Pacific Renewable Energy Market, By End Use, 2020–2030 ($Billion)
Table 114.Rest Of Asia-Pacific Renewable Energy Market, By End Use, 2020–2030 (Twh)
Table 115.Lamea Renewable Energy Market, By Type, 2020–2030 ($Billion)
Table 116.Lamea Renewable Energy Market, By Type, 2020–2030 (Terawatt-Hour)
Table 117.Lamea Renewable Energy Market, By End Use, 2020–2030 ($Billion)
Table 118.Lamea Renewable Energy Market, By End Use, 2020–2030 (Terawatt-Hour)
Table 119.Lamea Renewable Energy Market, By Country, 2020–2030 ($Billion)
Table 120.Lamea Renewable Energy Market, By Country, 2020–2030 (Terawatt-Hour)
Table 121.Brazil Renewable Energy Market, By Type, 2020–2030 ($Billion)
Table 122.Brazil Renewable Energy Market, By Type, 2020–2030 (Terawatt-Hour)
Table 123.Brazil Renewable Energy Market, By End Use, 2020–2030 ($Billion)
Table 124.Brazil Renewable Energy Market, By End Use, 2020–2030 (Terawatt-Hour)
Table 125.Saudi Arabia Renewable Energy Market, By Type, 2020–2030 ($Billion)
Table 126.Saudi Arabia Renewable Energy Market, By Type, 2020–2030 (Terawatt-Hour)
Table 127.Saudi Arabia Renewable Energy Market, By End Use, 2020–2030 ($Billion)
Table 128.Saudi Arabia Renewable Energy Market, By End Use, 2020–2030 (Terawatt-Hour)
Table 129.South Africa Renewable Energy Market, By Type, 2020–2030 ($Billion)
Table 130.South Africa Renewable Energy Market, By Type, 2020–2030 (Terawatt-Hour)
Table 131.South Africa Renewable Energy Market, By End Use, 2020–2030 ($Billion)
Table 132.South Africa Renewable Energy Market, By End Use, 2020–2030 (Terawatt-Hour)
Table 133.Rest Of Lamea Renewable Energy Market, By Type, 2020–2030 ($Billion)
Table 134.Rest Of Lamea Renewable Energy Market, By Type, 2020–2030 (Terawatt-Hour)
Table 135.Rest Of Lamea Renewable Energy Market, By End Use, 2020–2030 ($Billion)
Table 136.Rest Of Lamea Renewable Energy Market, By End Use, 2020–2030 (Terawatt-Hour)
Table 137.Key Expansions (2017-2021)
Table 138.Other Key Developments (2017-2021)
Table 139.Abb: Company Snapshot
Table 140.Abb: Operating Segments
Table 141.Abb: Product Portfolio
Table 142.Overall Financial Status ($Million)
Table 143.Abb: Key Strategic Moves And Developments
Table 144.Acciona: Company Snapshot
Table 145.Acciona: Operating Segments
Table 146.Acciona: Product Portfolio
Table 147.Overall Financial Status ($Million)
Table 148.Acciona: Key Strategic Moves And Developments
Table 149.Edf: Company Snapshot
Table 150.Edf: Operating Segments
Table 151.Edf: Product Portfolio
Table 152.Overall Financial Status ($Million)
Table 153.Edf: Key Strategic Moves And Developments
Table 154.Enel: Company Snapshot
Table 155.Enel: Operating Segments
Table 156.Enel: Product Portfolio
Table 157.Overall Financial Status ($Million)
Table 158.Enel: Key Strategic Moves And Developments
Table 159.General Electric: Company Snapshot
Table 160.General Electric: Operating Segments
Table 161.General Electric: Product Portfolio
Table 162.Overall Financial Status ($Million)
Table 163.General Electric: Key Strategic Moves And Developments
Table 164.Innergex: Company Snapshot
Table 165.Innergex: Operating Segments
Table 166.Innergex: Plant Portfolio
Table 167.Overall Financial Status ($Million)
Table 168.Innergex: Key Strategic Moves And Developments
Table 169.Invenergy: Company Snapshot
Table 170.Invenergy: Product Portfolio
Table 171.National Grid Renewables: Company Snapshot
Table 172.National Grid Renewables: Operating Segment
Table 173.National Grid Renewables: Product Portfolio
Table 174.National Grid Renewables: Key Strategic Moves And Developments
Table 175.The Tata Power Company Limited (Tata Power): Company Snapshot
Table 176.The Tata Power Company Limited (Tata Power): Operating Segment
Table 177.The Tata Power Company Limited (Tata Power): Product Portfolio
Table 178.The Tata Power Company Limited (Tata Power): Plant Portfolio
Table 179.Overall Financial Status ($Million)
Table 180.The Tata Power Company Limited (Tata Power): Key Strategic Moves And Developments
Table 181.Xcel Energy: Company Snapshot
Table 182.Xcel Energy: Operating Segments
Table 183.Xcel Energy: Product Portfolio
Table 184.Overall Financial Status ($Million)
List Of Figures
Figure 01.Global Renewable Energy Market Snapshot
Figure 02.Global Renewable Energy Market Segmentation
Figure 03.Top Investment Pockets
Figure 04.High Bargaining Power Of Suppliers
Figure 05.High Bargaining Power Of Buyers
Figure 06.Moderate Threat Of New Entrants
Figure 07.Moderate Threat Of Substitutes
Figure 08.High Competitive Rivalry
Figure 09.Global Renewable Energy Market Dynamics
Figure 10.Value Chain Analysis
Figure 11.Global Renewable Energy Market, Pricing Analysis, By Type, Usd/Kwh
Figure 12.Patent Analysis, By Country, 2021
Figure 13.Patent Analysis, By Applicant, 2021
Figure 14.Patent Analysis, By Publication Date, 2012-2021
Figure 15.Global Renewable Energy Market, By Type, 2020–2030 ($Mililion)
Figure 16.Comparative Share Analysis Of Renewable Energy Market For Hydroelectric Power, By Country, 2020 & 2030 (%)
Figure 17.Comparative Share Analysis Of Renewable Energy Market For Wind Power, By Country, 2020 & 2030 (%)
Figure 18.Comparative Share Analysis Of Renewable Energy Market For Bioenergy, By Country, 2020 & 2030 (%)
Figure 19.Comparative Share Analysis Of Renewable Energy Market For Solar, By Country, 2020 & 2030 (%)
Figure 20.Comparative Share Analysis Of Renewable Energy Market For Geothermal, By Country, 2020 & 2030 (%)
Figure 21.Global Renewable Energy Market, By End Use, 2020–2030 ($Mililion)
Figure 22.Comparative Share Analysis Of Renewable Energy Market For Residential, By Country, 2020 & 2030 (%)
Figure 23.Comparative Share Analysis Of Renewable Energy Market For Commercial, By Country, 2020 & 2030 (%)
Figure 24.Comparative Share Analysis Of Renewable Energy Market For Industrial, By Country, 2020 & 2030 (%)
Figure 25.Comparative Share Analysis Of Renewable Energy Market For Others, By Country, 2020 & 2030 (%)
Figure 26.Global Renewable Energy Market, By Region, 2020–2030 ($Billion)
Figure 27.U.S. Renewable Energy Market Revenue, 2020–2030($Billion)
Figure 28.Canada Renewable Energy Market Revenue, 2020–2030($Billion)
Figure 29.Mexico Renewable Energy Market Revenue, 2020–2030($Billion)
Figure 30.Sweden Renewable Energy Market Revenue, 2020–2030($Billion)
Figure 31.Austria Renewable Energy Market Revenue, 2020–2030($Billion)
Figure 32.Germany Renewable Energy Market Revenue, 2020–2030($Billion)
Figure 33.France Renewable Energy Market Revenue, 2020–2030($Billion)
Figure 34.Italy Renewable Energy Market Revenue, 2020–2030($Billion)
Figure 35.Spain Renewable Energy Market Revenue, 2020–2030($Billion)
Figure 36.Uk Renewable Energy Market Revenue, 2020–2030($Billion)
Figure 37.Rest Of Europe Renewable Energy Market Revenue, 2020–2030($Billion)
Figure 38.China Renewable Energy Market Revenue, 2020–2030($Billion)
Figure 39.India Renewable Energy Market Revenue, 2020–2030($Billion)
Figure 40.South Korea Renewable Energy Market Revenue, 2020–2030($Billion)
Figure 41.Australia Renewable Energy Market Revenue, 2020–2030($Billion)
Figure 42.Indonesia Renewable Energy Market Revenue, 2020–2030($Billion)
Figure 43.Japan Renewable Energy Market Revenue, 2020–2030($Billion)
Figure 44.Rest Of Asia-Pacific Renewable Energy Market Revenue, 2020–2030($Billion)
Figure 45.Brazil Renewable Energy Market Revenue, 2020–2030($Billion)
Figure 46.Saudi Arabia Renewable Energy Market Revenue, 2020–2030($Billion)
Figure 47.South Africa Renewable Energy Market Revenue, 2020–2030($Billion)
Figure 48.Rest Of Lamea Renewable Energy Market Revenue, 2020–2030($Billion)
Figure 49.Market Player Positioning, 2020
Figure 50.Top Winning Strategies, By Year, 2017–2021
Figure 51.Top Winning Strategies, By Development, 2017–2021 (%)
Figure 52.Top Winning Strategies, By Company, 2017–2021
Figure 53.Product Mapping Of Top 10 Players
Figure 54.Competitive Dashboard
Figure 55.Competitive Heatmap Of Key Players
Figure 56.Abb: Revenue, 2018-2020 ($Million)
Figure 57.Abb: Revenue Share By Segment, 2020 (%)
Figure 58.Abb: Revenue Share By Region, 2020 (%)
Figure 59.Acciona: Revenue, 2018–2020 ($Million)
Figure 60.Acciona: Revenue Share By Segment, 2020 (%)
Figure 61.Acciona: Revenue Share By Region, 2020 (%)
Figure 62.Edf: Net Sales, 2018–2020 ($Million)
Figure 63.Edf: Revenue Share By Segment, 2020 (%)
Figure 64.Edf: Revenue Share By Region, 2020 (%)
Figure 65.Enel: Revenue, 2018–2020 ($Million)
Figure 66.Enel: Revenue Share By Segment, 2020 (%)
Figure 67.General Electric: Revenue, 2018-2020 ($Million)
Figure 68.General Electric: Revenue Share By Segment, 2020 (%)
Figure 69.General Electric: Revenue Share By Region, 2020 (%)
Figure 70.Innergex: Net Sales, 2018–2020 ($Million)
Figure 71.Innergex: Revenue Share By Segment, 2020 (%)
Figure 72.Innergex: Revenue Share By Region, 2020 (%)
Figure 73.The Tata Power Company Limited (Tata Power): Net Sales, 2019–2021($Million)
Figure 74.The Tata Power Company Limited (Tata Power): Revenue Share By Segment, 2021 (%)
Figure 75.The Tata Power Company Limited (Tata Power): Revenue Share By Region, 2021 (%)
Figure 76.Xcel Energy: Net Sales, 2018–2020 ($Million)
Figure 77.Xcel Energy: Revenue Share By Segment, 2020 (%)
$5370
$6450
$8995
HAVE A QUERY?
OUR CUSTOMER

Add to Cart
Add to Cart
Add to Cart
Add to Cart