
Preference for digital payments
In an era of instant gratification and the internet using smart payment options has become the norm worldwide. Debit, credit, QR codes, and internet payment with NFC( Near Field Communication) technology provides quick, hassle-free, and contactless payment. Consumers can win product promotions and operators are able to stack up more products in the machines. This reduces the chances of theft and vandalism. Management and services costs are decreased thereby creating better business opportunities. These factors will drive the growth of the intelligent vending machines market during the review period.
Technological breakthroughs
Big market players are focusing on R&D initiatives for enhancing the customer buying experience and adding revamped features to the machines. Interactive displays with touchscreen and audio feature supply product information, pricing, and promotional offers. The voice and facial recognition software uniquely adapt to a consumer’s buying patterns, preferences, and choices thereby offering a smooth experience. Moreover, the live inventory tracking option along with video surveillance and machine sensors allow continuous monitoring of the installed vending machines and help in reducing maintenance costs. The renting of advertisement spaces creates additional revenue opportunities. These beneficial features will surge the adoption rate creating lucrative opportunities for the intelligent vending machines market in the future.
Largescale deployment in various industry verticals
Vending machines are becoming common in all end-user industries especially in developed countries as people get accustomed to self-service technology. They are being installed in public facilities, amusement parks, stations, and airports. Moreover, with the resumption of economic activities face mask machines have become popular in public places. This in turn will augment the expansion of the intelligent vending machines market in the upcoming years. Healthier food alternatives can be promoted amongst students by placing these machines in schools.
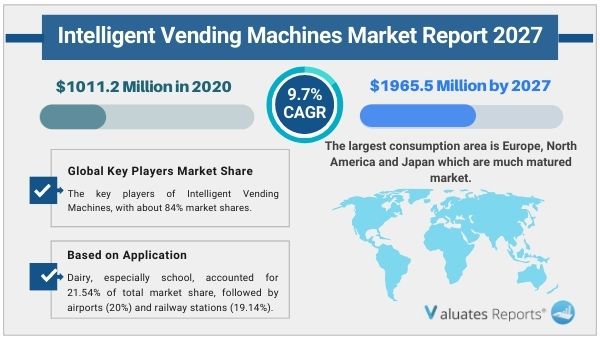
Based on application, the school segment will grow the highest in the intelligent vending machines market share with 21.54% followed by airports (20%) and railway stations(19.14%).
Based on region, Europe, North America is likely to maintain dominance due to growing adoption in the developed world. While The Asia-Pacific segment with China, Japan will grow the fastest during the forecast period.
|
Report Metric |
Details |
|
Report Name |
Intelligent Vending Machines Market |
|
The market size value in 2020 |
1011.2 Million |
|
The revenue forecast in 2027 |
1965.5 Million |
|
Forecast Period 2021 to 2027 CAGR |
9.7% |
|
Base year considered |
2020 |
|
Forecast units |
Value (USD) |
|
Segments covered |
Type, End-User, Offerings, and Region |
|
Market BY Type |
Beverage, Commodity, Food, Others |
|
Market BY Application/End-User |
Airport, Railway Station, School, Business Center, Others |
|
Report coverage |
Revenue & volume forecast, company share, competitive landscape, growth factors, and trends |
|
Geographic regions covered |
North America, Europe, Asia Pacific, Latin America, Middle East & Africa |
Ans. The global Intelligent Vending Machines market size is projected to reach US$ 1965.5 million by 2027, from US$ 1011.2 million in 2020, at a Compound Annual Growth Rate (CAGR) of 9.7% during 2021-2027.
Ans. Airport, railway station, school, and business Center is the most influencing segment in the growing in the intelligent vending machines market.
Ans. Europe and North America is and will provide more business opportunities for intelligent vending machines in the future. The largest consumption area is Europe, North America, and Japan which are the much-matured market. For emerging economies, like China, Smart Vending Machines technology is rapidly improving.
Ans. Fuji Electric, Crane Merchandising Systems, Sanden, N&W Global Vending, Seaga, Royal Vendors, Azkoyen, Sielaff, Bianchi Vending, Jofemar, FAS International, Automated Merchandising Systems, Deutsche Wurlitzer, TCN Vending Machine and Fuhong Vending are the key players of Intelligent Vending Machines, with about 84% market shares.
Table 1. Major Company of Beverage
Table 2. Major Company of Commodity
Table 3. Major Company of Food
Table 4. Major Company of Others
Table 5. Global Intelligent Vending Machines Sales by Type 2016 VS 2021 VS 2027 (US$ Million)
Table 6. Global Intelligent Vending Machines Sales by Type (2016-2021) & (Units)
Table 7. Global Intelligent Vending Machines Sales Market Share in Volume by Type (2016-2021)
Table 8. Global Intelligent Vending Machines Sales by Type (2016-2021) & (US& Million)
Table 9. Global Intelligent Vending Machines Market Share in Value by Type (2016-2021)
Table 10. Global Intelligent Vending Machines Price by Type (2016-2021) & (K USD/Unit)
Table 11. Global Intelligent Vending Machines Sales by Type (2022-2027) & (Units)
Table 12. Global Intelligent Vending Machines Sales Market Share in Volume by Type (2022-2027)
Table 13. Global Intelligent Vending Machines Sales by Type (2022-2027) & (US$ Million)
Table 14. Global Intelligent Vending Machines Sales Market Share in Value by Type (2022-2027)
Table 15. Global Intelligent Vending Machines Price by Type (2022-2027) & (K USD/Unit)
Table 16. North America Intelligent Vending Machines Sales by Type (2016-2021) & (Units)
Table 17. North America Intelligent Vending Machines Sales by Type (2016-2021) & (US$ Million)
Table 18. Europe Intelligent Vending Machines Sales (Units) by Type (2016-2021)
Table 19. Europe Intelligent Vending Machines Sales by Type (2016-2021) & (US$ Million)
Table 20. Asia-Pacific Intelligent Vending Machines Sales (Units) by Type (2016-2021)
Table 21. Asia-Pacific Intelligent Vending Machines Sales by Type (2016-2021) & (US$ Million)
Table 22. Latin America Intelligent Vending Machines Sales (Units) by Type (2016-2021)
Table 23. Latin America Intelligent Vending Machines Sales by Type (2016-2021) & (US$ Million)
Table 24. Middle East and Africa Intelligent Vending Machines Sales (Units) by Type (2016-2021)
Table 25. Middle East and Africa Intelligent Vending Machines Sales by Type (2016-2021) & (US$ Million)
Table 26. Global Intelligent Vending Machines Sales by Company (2016-2021) & (Units)
Table 27. Global Intelligent Vending Machines Sales Share by Company (2016-2021)
Table 28. Global Intelligent Vending Machines Revenue by Company (2016-2021) & (US$ Million)
Table 29. Global Intelligent Vending Machines Revenue Share by Company (2016-2021)
Table 30. Global Market Intelligent Vending Machines Price by Company (2016-2021) & (K USD/Unit)
Table 31. Global Intelligent Vending Machines Top Manufacturers Manufacturing Base Distribution and Sales Area
Table 32. Global Intelligent Vending Machines Manufacturers Market Concentration Ratio (CR5 and HHI)
Table 33. Global Top Manufacturers Market Share by Company Type (Tier 1, Tier 2 and Tier 3) & (based on the Revenue in Intelligent Vending Machines as of 2020
Table 34. Date of Key Manufacturers Enter into Intelligent Vending Machines Market
Table 35. Key Manufacturers Intelligent Vending Machines Product Type
Table 36. Mergers & Acquisitions, Expansion Plans
Table 37. Global Intelligent Vending Machines Market Size Comparison by Region (US$ Million): 2016 VS 2021 VS 2027
Table 38. Global Intelligent Vending Machines Sales by Region (2016-2021) & (Units)
Table 39. Global Intelligent Vending Machines Sales Market Share in Volume by Region (2016-2021)
Table 40. Global Intelligent Vending Machines Sales by Region (2016-2021) & (US$ Million)
Table 41. Global Intelligent Vending Machines Sales Market Share in Value by Region (2016-2021)
Table 42. Global Intelligent Vending Machines Sales (Units), Revenue (US$ Million), Price (K USD/Unit) and Gross Margin (2016-2021)
Table 43. Global Intelligent Vending Machines Sales by Region (2022-2027) & (Units)
Table 44. Global Intelligent Vending Machines Sales Market Share in Volume by Region (2022-2027)
Table 45. Global Intelligent Vending Machines Sales by Region (2022-2027) & (US$ Million)
Table 46. Global Intelligent Vending Machines Sales Market Share in Value by Region (2022-2027)
Table 47. Global Intelligent Vending Machines Sales (Units), Revenue (US$ Million), Price (K USD/Unit) and Gross Margin (2022-2027)
Table 48. Global Intelligent Vending Machines Sales by Application: 2016 VS 2021 VS 2027 (US$ Million)
Table 49. Global Intelligent Vending Machines Sales by Application (2016-2021) & (Units)
Table 50. Global Intelligent Vending Machines Sales Market Share in Volume by Application (2016-2021)
Table 51. Global Intelligent Vending Machines Sales by Application (2016-2021) & (US$ Million)
Table 52. Global Intelligent Vending Machines Sales Market Share in Value by Application (2016-2021)
Table 53. Global Intelligent Vending Machines Price by Application (2016-2021) & (K USD/Unit)
Table 54. Global Intelligent Vending Machines Sales by Application (2022-2027) & (Units)
Table 55. Global Intelligent Vending Machines Sales Market Share in Volume by Application (2022-2027)
Table 56. Global Intelligent Vending Machines Sales by Application (2022-2027) & (US$ Million)
Table 57. Global Intelligent Vending Machines Sales Market Share in Value by Application (2022-2027)
Table 58. Global Intelligent Vending Machines Price by Application (2022-2027) & (K USD/Unit)
Table 59. North America Intelligent Vending Machines Sales by Application (2016-2021) (Units)
Table 60. North America Intelligent Vending Machines Sales by Application (2016-2021) & (US$ Million)
Table 61. North America Intelligent Vending Machines Sales Market Share in Value by Application in 2020
Table 62. Europe Intelligent Vending Machines Sales by Application (2016-2021) (Units)
Table 63. Europe Intelligent Vending Machines Sales by Application (2016-2021) & (US$ Million)
Table 64. Europe Intelligent Vending Machines Sales Market Share in Value by Application in 2020
Table 65. Asia-Pacific Intelligent Vending Machines Sales by Application (2016-2021) (Units)
Table 66. Asia-Pacific Intelligent Vending Machines Sales by Application (2016-2021) & (US$ Million)
Table 67. Asia-Pacific Intelligent Vending Machines Sales Market Share in Value by Application in 2020
Table 68. Latin America Intelligent Vending Machines Sales by Application (2016-2021) (Units)
Table 69. Latin America Intelligent Vending Machines Sales by Application (2016-2021) & (US$ Million)
Table 70. Latin America Intelligent Vending Machines Sales Market Share in Value by Application in 2020
Table 71. Middle East and Africa Intelligent Vending Machines Sales by Application (2016-2021) (Units)
Table 72. Middle East and Africa Intelligent Vending Machines Sales by Application (2016-2021) & (US$ Million)
Table 73. Middle East and Africa Intelligent Vending Machines Sales Market Share in Value by Application in 2020
Table 74. North America Intelligent Vending Machines Sales by Country (2016-2021) & (Units)
Table 75. North America Intelligent Vending Machines Sales Market Share in Volume by Country (2016-2021)
Table 76. North America Intelligent Vending Machines Sales by Country (2016-2021) & (US$ Million)
Table 77. North America Intelligent Vending Machines Sales Market Share in Value by Country (2016-2021)
Table 78. North America Intelligent Vending Machines Sales by Country (2022-2027) & (Units)
Table 79. North America Intelligent Vending Machines Sales Market Share in Volume by Country (2022-2027)
Table 80. North America Intelligent Vending Machines Sales by Country (2022-2027) & (US$ Million)
Table 81. North America Intelligent Vending Machines Sales Market Share in Value by Country (2022-2027)
Table 82. Europe Intelligent Vending Machines Sales by Country (2016-2021) & (Units)
Table 83. Europe Intelligent Vending Machines Sales Market Share in Volume by Country (2016-2021)
Table 84. Europe Intelligent Vending Machines Sales by Country (2016-2021) & (US$ Million)
Table 85. Europe Intelligent Vending Machines Sales Market Share in Value by Country (2016-2021)
Table 86. Europe Intelligent Vending Machines Sales by Country (2022-2027) & (Units)
Table 87. Europe Intelligent Vending Machines Sales Market Share in Volume by Country (2022-2027)
Table 88. Europe Intelligent Vending Machines Sales by Country (2022-2027) & (US$ Million)
Table 89. Europe Intelligent Vending Machines Sales Market Share in Value by Country (2022-2027)
Table 90. Asia-Pacific Intelligent Vending Machines Sales by Region (2016-2021) & (Units)
Table 91. Asia-Pacific Intelligent Vending Machines Sales Market Share in Volume by Region (2016-2021)
Table 92. Asia-Pacific Intelligent Vending Machines Sales by Region (2016-2021) & (US$ Million)
Table 93. Asia-Pacific Intelligent Vending Machines Sales Market Share in Value by Region (2016-2021)
Table 94. Asia-Pacific Intelligent Vending Machines Sales by Region (2022-2027) & (Units)
Table 95. Asia-Pacific Intelligent Vending Machines Sales Market Share in Volume by Region (2022-2027)
Table 96. Asia-Pacific Intelligent Vending Machines Sales by Region (2022-2027) & (US$ Million)
Table 97. Asia-Pacific Intelligent Vending Machines Sales Market Share in Value by Region (2022-2027)
Table 98. Latin America Intelligent Vending Machines Sales by Country (2016-2021) & (Units)
Table 99. Latin America Intelligent Vending Machines Sales Market Share in Volume by Country (2016-2021)
Table 100. Latin America Intelligent Vending Machines Sales by Country (2016-2021) & (US$ Million)
Table 101. Latin America Intelligent Vending Machines Sales Market Share in Value by Country (2016-2021)
Table 102. Latin America Intelligent Vending Machines Sales by Country (2022-2027) & (Units)
Table 103. Latin America Intelligent Vending Machines Sales Market Share in Volume by Country (2022-2027)
Table 104. Latin America Intelligent Vending Machines Sales by Country (2022-2027) & (US$ Million)
Table 105. Latin America Intelligent Vending Machines Sales Market Share in Value by Country (2022-2027)
Table 106. Middle East and Africa Intelligent Vending Machines Sales by Country (2016-2021) & (Units)
Table 107. Middle East and Africa Intelligent Vending Machines Sales Market Share in Volume by Country (2016-2021)
Table 108. Middle East and Africa Intelligent Vending Machines Sales by Country (2016-2021) & (US$ Million)
Table 109. Middle East and Africa Intelligent Vending Machines Sales Market Share in Value by Country (2016-2021)
Table 110. Middle East and Africa Intelligent Vending Machines Sales by Country (2022-2027) & (Units)
Table 111. Middle East and Africa Intelligent Vending Machines Sales Market Share in Volume by Country (2022-2027)
Table 112. Middle East and Africa Intelligent Vending Machines Sales by Country (2022-2027) & (US$ Million)
Table 113. Middle East and Africa Intelligent Vending Machines Sales Market Share in Value by Country (2022-2027)
Table 114. Fuji Electric Corporation Information
Table 115. Fuji Electric Introduction and Business Overview
Table 116. Fuji Electric Intelligent Vending Machines Sales (Units), Revenue (Million USD), Price (K USD/Unit) and Gross Margin (2016-2021)
Table 117. Fuji Electric Intelligent Vending Machines Product
Table 118. Fuji Electric Recent Development
Table 119. Crane Merchandising Systems Corporation Information
Table 120. Crane Merchandising Systems Introduction and Business Overview
Table 121. Crane Merchandising Systems Intelligent Vending Machines Sales (Units), Revenue (Million USD), Price (K USD/Unit) and Gross Margin (2016-2021)
Table 122. Crane Merchandising Systems Intelligent Vending Machines Product
Table 123. Crane Merchandising Systems Recent Development
Table 124. Sanden Corporation Information
Table 125. Sanden Introduction and Business Overview
Table 126. Sanden Intelligent Vending Machines Sales (Units), Revenue (Million USD), Price (K USD/Unit) and Gross Margin (2016-2021)
Table 127. Sanden Intelligent Vending Machines Product
Table 128. Sanden Recent Development
Table 129. N&W Global Vending Corporation Information
Table 130. N&W Global Vending Introduction and Business Overview
Table 131. N&W Global Vending Intelligent Vending Machines Sales (Units), Revenue (Million USD), Price (K USD/Unit) and Gross Margin (2016-2021)
Table 132. N&W Global Vending Intelligent Vending Machines Product
Table 133. N&W Global Vending Recent Development
Table 134. Seaga Corporation Information
Table 135. Seaga Introduction and Business Overview
Table 136. Seaga Intelligent Vending Machines Sales (Units), Revenue (Million USD), Price (K USD/Unit) and Gross Margin (2016-2021)
Table 137. Seaga Intelligent Vending Machines Product
Table 138. Seaga Recent Development
Table 139. Royal Vendors Corporation Information
Table 140. Royal Vendors Introduction and Business Overview
Table 141. Royal Vendors Intelligent Vending Machines Sales (Units), Revenue (Million USD), Price (K USD/Unit) and Gross Margin (2016-2021)
Table 142. Royal Vendors Intelligent Vending Machines Product
Table 143. Royal Vendors Recent Development
Table 144. Azkoyen Corporation Information
Table 145. Azkoyen Introduction and Business Overview
Table 146. Azkoyen Intelligent Vending Machines Sales (Units), Revenue (Million USD), Price (K USD/Unit) and Gross Margin (2016-2021)
Table 147. Azkoyen Intelligent Vending Machines Product
Table 148. Azkoyen Recent Development
Table 149. Sielaff Corporation Information
Table 150. Sielaff Introduction and Business Overview
Table 151. Sielaff Intelligent Vending Machines Sales (Units), Revenue (Million USD), Price (K USD/Unit) and Gross Margin (2016-2021)
Table 152. Sielaff Intelligent Vending Machines Product
Table 153. Sielaff Recent Development
Table 154. Bianchi Vending Corporation Information
Table 155. Bianchi Vending Introduction and Business Overview
Table 156. Bianchi Vending Intelligent Vending Machines Sales (Units), Revenue (Million USD), Price (K USD/Unit) and Gross Margin (2016-2021)
Table 157. Bianchi Vending Intelligent Vending Machines Product
Table 158. Bianchi Vending Recent Development
Table 159. Jofemar Corporation Information
Table 160. Jofemar Introduction and Business Overview
Table 161. Jofemar Intelligent Vending Machines Sales (Units), Revenue (Million USD), Price (K USD/Unit) and Gross Margin (2016-2021)
Table 162. Jofemar Intelligent Vending Machines Product
Table 163. Jofemar Recent Development
Table 164. FAS International Corporation Information
Table 165. FAS International Introduction and Business Overview
Table 166. FAS International Intelligent Vending Machines Sales (Units), Revenue (Million USD), Price (K USD/Unit) and Gross Margin (2016-2021)
Table 167. FAS International Intelligent Vending Machines Product
Table 168. FAS International Recent Development
Table 169. Automated Merchandising Systems Corporation Information
Table 170. Automated Merchandising Systems Introduction and Business Overview
Table 171. Automated Merchandising Systems Intelligent Vending Machines Sales (Units), Revenue (Million USD), Price (K USD/Unit) and Gross Margin (2016-2021)
Table 172. Automated Merchandising Systems Intelligent Vending Machines Product
Table 173. Automated Merchandising Systems Recent Development
Table 174. Deutsche Wurlitzer Corporation Information
Table 175. Deutsche Wurlitzer Introduction and Business Overview
Table 176. Deutsche Wurlitzer Intelligent Vending Machines Sales (Units), Revenue (Million USD), Price (K USD/Unit) and Gross Margin (2016-2021)
Table 177. Deutsche Wurlitzer Intelligent Vending Machines Product
Table 178. Deutsche Wurlitzer Recent Development
Table 179. TCN Vending Machine Corporation Information
Table 180. TCN Vending Machine Introduction and Business Overview
Table 181. TCN Vending Machine Intelligent Vending Machines Sales (Units), Revenue (Million USD), Price (K USD/Unit) and Gross Margin (2016-2021)
Table 182. TCN Vending Machine Intelligent Vending Machines Product
Table 183. TCN Vending Machine Recent Development
Table 184. Fuhong Vending Corporation Information
Table 185. Fuhong Vending Introduction and Business Overview
Table 186. Fuhong Vending Intelligent Vending Machines Sales (Units), Revenue (Million USD), Price (K USD/Unit) and Gross Margin (2016-2021)
Table 187. Fuhong Vending Intelligent Vending Machines Product
Table 188. Fuhong Vending Recent Development
Table 189. Key Raw Materials Lists
Table 190. Raw Materials Key Suppliers Lists
Table 191. Intelligent Vending Machines Market Trends
Table 192. Intelligent Vending Machines Market Drivers
Table 193. Intelligent Vending Machines Market Challenges
Table 194. Intelligent Vending Machines Market Restraints
Table 195. Intelligent Vending Machines Distributors List
Table 196. Intelligent Vending Machines Downstream Customers
Table 197. Research Programs/Design for This Report
Table 198. Key Data Information from Secondary Sources
Table 199. Key Data Information from Primary Sources
List of Figures
Figure 1. Intelligent Vending Machines Product Picture
Figure 2. Global Intelligent Vending Machines Market Size, 2016 VS 2021 VS 2027 (US$ Million)
Figure 3. Global Intelligent Vending Machines Market Size Status and Outlook (2016-2027) & (US$ Million)
Figure 4. Global Intelligent Vending Machines Sales Status and Outlook (2016-2027) & (Units)
Figure 5. Product Picture of Beverage
Figure 6. Global Beverage Sales YoY Growth (2016-2021) & (Units)
Figure 7. Product Picture of Commodity
Figure 8. Global Commodity Sales YoY Growth (2016-2021) & (Units)
Figure 9. Product Picture of Food
Figure 10. Global Food Sales YoY Growth (2016-2021) & (Units)
Figure 11. Product Picture of Others
Figure 12. Global Others Sales YoY Growth (2016-2021) & (Units)
Figure 13. Global Intelligent Vending Machines Sales by Type (2016-2027) & (US$ Million)
Figure 14. Global Intelligent Vending Machines Sales Market Share in Volume by Type (2016-2021)
Figure 15. Global Intelligent Vending Machines Sales Market Share in Value by Type (2016-2021)
Figure 16. Global Intelligent Vending Machines Sales Market Share in Volume by Type (2022-2027)
Figure 17. Global Intelligent Vending Machines Sales Market Share in Value by Type (2022-2027)
Figure 18. North America Intelligent Vending Machines Sales Market Share in Volume by Type in 2020
Figure 19. North America Intelligent Vending Machines Sales Market Share in Value by Type in 2020
Figure 20. Europe Intelligent Vending Machines Sales Market Share in Volume by Type in 2020
Figure 21. Europe Intelligent Vending Machines Sales Market Share in Value by Type in 2020
Figure 22. Asia-Pacific Intelligent Vending Machines Sales Market Share in Volume by Type in 2020
Figure 23. Asia-Pacific Intelligent Vending Machines Sales Market Share in Value by Type in 2020
Figure 24. Latin America Intelligent Vending Machines Sales Market Share in Volume by Type in 2020
Figure 25. Latin America Intelligent Vending Machines Sales Market Share in Value by Type in 2020
Figure 26. Middle East and Africa Intelligent Vending Machines Sales Market Share in Volume by Type in 2020
Figure 27. Middle East and Africa Intelligent Vending Machines Sales Market Share in Value by Type in 2020
Figure 28. The 5 and 10 Largest Manufacturers in the World: Market Share by Intelligent Vending Machines Sales in 2020
Figure 29. The 5 and 10 Largest Manufacturers in the World: Market Share by Intelligent Vending Machines Revenue in 2020
Figure 30. Intelligent Vending Machines Market Share by Company Type (Tier 1, Tier 2, and Tier 3): 2016 VS 2020
Figure 31. Product Picture of Airport
Figure 32. Global Airport Sales YoY Growth (2016-2027) & (Units)
Figure 33. Product Picture of Railway Station
Figure 34. Global Railway Station Sales YoY Growth (2016-2027) & (Units)
Figure 35. Product Picture of School
Figure 36. Global School Sales YoY Growth (2016-2027) & (Units)
Figure 37. Product Picture of Business Center
Figure 38. Global Business Center Sales YoY Growth (2016-2027) & (Units)
Figure 39. Product Picture of Others
Figure 40. Global Others Sales YoY Growth (2016-2027) & (Units)
Figure 41. Global Intelligent Vending Machines Sales by Application (2016-2027) & (US$ Million)
Figure 42. Global Intelligent Vending Machines Sales Market Share in Volume by Application (2016-2021)
Figure 43. Global Intelligent Vending Machines Sales Market Share in Value by Application (2016-2021)
Figure 44. Global Intelligent Vending Machines Sales Market Share in Volume by Application (2022-2027)
Figure 45. North America Intelligent Vending Machines Sales Market Share in Volume by Application in 2020
Figure 46. Latin America Intelligent Vending Machines Sales Market Share in Value by Application in 2020
Figure 47. Middle East and Africa Intelligent Vending Machines Sales Market Share in Value by Application in 2020
Figure 48. Key Raw Materials Price
Figure 49. Intelligent Vending Machines Manufacturing Cost Structure
Figure 50. Intelligent Vending Machines Industrial Chain Analysis
Figure 51. Channels of Distribution
Figure 52. Distributors Profiles
Figure 53. Bottom-up and Top-down Approaches for This Report
Figure 54. Data Triangulation
Figure 55. Key Executives Interviewed
$4900
$7350
$9800

Add to Cart
Add to Cart
Add to Cart
Add to Cart