
The System Integration market size was valued at USD 442070 million in 2021, and it is anticipated to reach USD 809700 million by 2028, registering a CAGR of about 8.9% during the forecast period (2022–2028). Key drivers of the system integration market include the safety and security concerns driving demand for integrated automation systems.
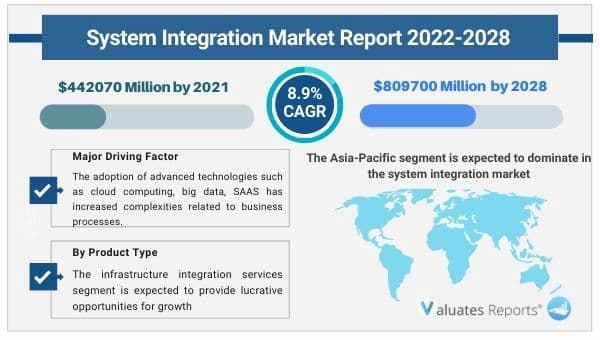
The adoption of advanced technologies such as cloud computing, big data, and software as a service (SAAS) has made business processes complex and time-consuming. This augments the need for system integration services thereby fueling the growth of the system integration market during the forecast period.
Virtual and physical security issues are rising. Industries such as the oil and gas, utilities, energy, petrochemicals, and transportation sectors require robust systems that prevent machine malfunction and accidents. Process automation enables predictability, scalability and reduces human error. Vulnerabilities can be detected, identified, and fixed quickly. Businesses are scaling up rapidly. They require a uniform integrated system for managing safety concerns. This in turn will lead to widespread adoption ultimately fueling the growth of the system integration market during the forecast period.
The rapid adoption of advanced technologies such as cloud computing, big data, software as a service(SAAS) has increased complexities related to business processes. There is a need for bringing all systems onto a single integrated platform for efficient communication. This promotes consistency, agility, and innovation. Moreover, the Integrated Platform as a Service solution (iPaaS) is helping companies share applications on various platforms. These factors are expected to propel the growth of the system integration market in the coming years.
Based on type, the infrastructure integration services segment is expected to provide lucrative opportunities for growth in the system integration market share due to the widescale adoption of cloud-based and cost-efficient services.
Based on region, the Asia-Pacific segment is expected to dominate in the system integration market share due to the large presence of SMEs and widespread adoption.
|
Report Metric |
Details |
|
Base Year: |
2021 |
|
Market Size in 2021: |
USD 442070 Million |
|
Forecast Period: |
2022 to 2028 |
|
Forecast Period 2022 to 2028 CAGR: |
8.9% |
|
2028 Value Projection: |
USD 809700 Million |
|
No. of Pages: |
128 |
|
Tables & Figures |
148 |
|
Segments covered: |
Type, Application, Region |
Ans. The global System Integration market size is estimated to grow at a CAGR of 8.9% over the forecast timeframe and reach a market value of around USD 809700 million by 2028.
Ans. Key drivers of the system integration market include the safety and security concerns driving demand for integrated automation systems.
Ans. The global System Integration Market value was valued at US$ 442070 million in 2021.
Ans. Asia-Pacific segment is expected to dominate in the system integration market share.
Ans. Based on Type, the infrastructure integration services segment is expected to provide lucrative opportunities for growth in the system integration market share
Ans. The forecast period considered for the global System Integration market is 2022 to 2028.
1 Report Business Overview
1.1 Study Scope
1.2 Market Analysis by Type
1.2.1 Global System Integration Market Size Growth Rate by Type, 2017 VS 2021 VS 2028
1.2.2 Infrastructure integration services market
1.2.3 Application integration services market
1.2.4 Consulting services
1.3 Market by Application
1.3.1 Global System Integration Market Size Growth Rate by Application, 2017 VS 2021 VS 2028
1.3.2 Banking, financial services, and insurance
1.3.3 Communications and media
1.3.4 Manufacturing (discrete and process)
1.3.5 Government
1.3.6 Health
1.3.7 Wholesale and retail services
1.3.8 Services
1.3.9 Transportation
1.3.10 Utilities and resources
1.4 Study Objectives
1.5 Years Considered
2 Global Growth Trends
2.1 Global System Integration Market Perspective (2017-2028)
2.2 System Integration Growth Trends by Region
2.2.1 System Integration Market Size by Region: 2017 VS 2021 VS 2028
2.2.2 System Integration Historic Market Size by Region (2017-2022)
2.2.3 System Integration Forecasted Market Size by Region (2023-2028)
2.3 System Integration Market Dynamics
2.3.1 System Integration Industry Trends
2.3.2 System Integration Market Drivers
2.3.3 System Integration Market Challenges
2.3.4 System Integration Market Restraints
3 Competition Landscape by Key Players
3.1 Global Top System Integration Players by Revenue
3.1.1 Global Top System Integration Players by Revenue (2017-2022)
3.1.2 Global System Integration Revenue Market Share by Players (2017-2022)
3.2 Global System Integration Market Share by Company Type (Tier 1, Tier 2, and Tier 3)
3.3 Players Covered: Ranking by System Integration Revenue
3.4 Global System Integration Market Concentration Ratio
3.4.1 Global System Integration Market Concentration Ratio (CR5 and HHI)
3.4.2 Global Top 10 and Top 5 Companies by System Integration Revenue in 2021
3.5 System Integration Key Players Head office and Area Served
3.6 Key Players System Integration Product Solution and Service
3.7 Date of Enter into System Integration Market
3.8 Mergers & Acquisitions, Expansion Plans
4 System Integration Breakdown Data by Type
4.1 Global System Integration Historic Market Size by Type (2017-2022)
4.2 Global System Integration Forecasted Market Size by Type (2023-2028)
5 System Integration Breakdown Data by Application
5.1 Global System Integration Historic Market Size by Application (2017-2022)
5.2 Global System Integration Forecasted Market Size by Application (2023-2028)
6 North America
6.1 North America System Integration Market Size (2017-2028)
6.2 North America System Integration Market Size by Type
6.2.1 North America System Integration Market Size by Type (2017-2022)
6.2.2 North America System Integration Market Size by Type (2023-2028)
6.2.3 North America System Integration Market Share by Type (2017-2028)
6.3 North America System Integration Market Size by Application
6.3.1 North America System Integration Market Size by Application (2017-2022)
6.3.2 North America System Integration Market Size by Application (2023-2028)
6.3.3 North America System Integration Market Share by Application (2017-2028)
6.4 North America System Integration Market Size by Country
6.4.1 North America System Integration Market Size by Country (2017-2022)
6.4.2 North America System Integration Market Size by Country (2023-2028)
6.4.3 U.S.
6.4.4 Canada
7 Europe
7.1 Europe System Integration Market Size (2017-2028)
7.2 Europe System Integration Market Size by Type
7.2.1 Europe System Integration Market Size by Type (2017-2022)
7.2.2 Europe System Integration Market Size by Type (2023-2028)
7.2.3 Europe System Integration Market Share by Type (2017-2028)
7.3 Europe System Integration Market Size by Application
7.3.1 Europe System Integration Market Size by Application (2017-2022)
7.3.2 Europe System Integration Market Size by Application (2023-2028)
7.3.3 Europe System Integration Market Share by Application (2017-2028)
7.4 Europe System Integration Market Size by Country
7.4.1 Europe System Integration Market Size by Country (2017-2022)
7.4.2 Europe System Integration Market Size by Country (2023-2028)
7.4.3 Germany
7.4.4 France
7.4.5 U.K.
7.4.6 Italy
7.4.7 Russia
7.4.8 Nordic Countries
8 Asia-Pacific
8.1 Asia-Pacific System Integration Market Size (2017-2028)
8.2 Asia-Pacific System Integration Market Size by Type
8.2.1 Asia-Pacific System Integration Market Size by Type (2017-2022)
8.2.2 Asia-Pacific System Integration Market Size by Type (2023-2028)
8.2.3 Asia-Pacific System Integration Market Share by Type (2017-2028)
8.3 Asia-Pacific System Integration Market Size by Application
8.3.1 Asia-Pacific System Integration Market Size by Application (2017-2022)
8.3.2 Asia-Pacific System Integration Market Size by Application (2023-2028)
8.3.3 Asia-Pacific System Integration Market Share by Application (2017-2028)
8.4 Asia-Pacific System Integration Market Size by Region
8.4.1 Asia-Pacific System Integration Market Size by Region (2017-2022)
8.4.2 Asia-Pacific System Integration Market Size by Region (2023-2028)
8.4.3 China
8.4.4 Japan
8.4.5 South Korea
8.4.6 Southeast Asia
8.4.7 India
8.4.8 Australia
9 Latin America
9.1 Latin America System Integration Market Size (2017-2028)
9.2 Latin America System Integration Market Size by Type
9.2.1 Latin America System Integration Market Size by Type (2017-2022)
9.2.2 Latin America System Integration Market Size by Type (2023-2028)
9.2.3 Latin America System Integration Market Share by Type (2017-2028)
9.3 Latin America System Integration Market Size by Application
9.3.1 Latin America System Integration Market Size by Application (2017-2022)
9.3.2 Latin America System Integration Market Size by Application (2023-2028)
9.3.3 Latin America System Integration Market Share by Application (2017-2028)
9.4 Latin America System Integration Market Size by Country
9.4.1 Latin America System Integration Market Size by Country (2017-2022)
9.4.2 Latin America System Integration Market Size by Country (2023-2028)
9.4.3 Mexico
9.4.4 Brazil
10 Middle East & Africa
10.1 Middle East & Africa System Integration Market Size (2017-2028)
10.2 Middle East & Africa System Integration Market Size by Type
10.2.1 Middle East & Africa System Integration Market Size by Type (2017-2022)
10.2.2 Middle East & Africa System Integration Market Size by Type (2023-2028)
10.2.3 Middle East & Africa System Integration Market Share by Type (2017-2028)
10.3 Middle East & Africa System Integration Market Size by Application
10.3.1 Middle East & Africa System Integration Market Size by Application (2017-2022)
10.3.2 Middle East & Africa System Integration Market Size by Application (2023-2028)
10.3.3 Middle East & Africa System Integration Market Share by Application (2017-2028)
10.4 Middle East & Africa System Integration Market Size by Country
10.4.1 Middle East & Africa System Integration Market Size by Country (2017-2022)
10.4.2 Middle East & Africa System Integration Market Size by Country (2023-2028)
10.4.3 Turkey
10.4.4 Saudi Arabia
10.4.5 UAE
11 Key Players Profiles
11.1 ACCENTURE
11.1.1 ACCENTURE Company Details
11.1.2 ACCENTURE Business Overview
11.1.3 ACCENTURE System Integration Introduction
11.1.4 ACCENTURE Revenue in System Integration Business (2017-2022)
11.1.5 ACCENTURE Recent Developments
11.2 ALCATEL-LUCENT
11.2.1 ALCATEL-LUCENT Company Details
11.2.2 ALCATEL-LUCENT Business Overview
11.2.3 ALCATEL-LUCENT System Integration Introduction
11.2.4 ALCATEL-LUCENT Revenue in System Integration Business (2017-2022)
11.2.5 ALCATEL-LUCENT Recent Developments
11.3 BUSINESS CONNEXION
11.3.1 BUSINESS CONNEXION Company Details
11.3.2 BUSINESS CONNEXION Business Overview
11.3.3 BUSINESS CONNEXION System Integration Introduction
11.3.4 BUSINESS CONNEXION Revenue in System Integration Business (2017-2022)
11.3.5 BUSINESS CONNEXION Recent Developments
11.4 DEUTSCHE TELEKOM (T-SYSTEMS)
11.4.1 DEUTSCHE TELEKOM (T-SYSTEMS) Company Details
11.4.2 DEUTSCHE TELEKOM (T-SYSTEMS) Business Overview
11.4.3 DEUTSCHE TELEKOM (T-SYSTEMS) System Integration Introduction
11.4.4 DEUTSCHE TELEKOM (T-SYSTEMS) Revenue in System Integration Business (2017-2022)
11.4.5 DEUTSCHE TELEKOM (T-SYSTEMS) Recent Developments
11.5 ERICSSON
11.5.1 ERICSSON Company Details
11.5.2 ERICSSON Business Overview
11.5.3 ERICSSON System Integration Introduction
11.5.4 ERICSSON Revenue in System Integration Business (2017-2022)
11.5.5 ERICSSON Recent Developments
11.6 HPE
11.6.1 HPE Company Details
11.6.2 HPE Business Overview
11.6.3 HPE System Integration Introduction
11.6.4 HPE Revenue in System Integration Business (2017-2022)
11.6.5 HPE Recent Developments
11.7 HONEYWELL
11.7.1 HONEYWELL Company Details
11.7.2 HONEYWELL Business Overview
11.7.3 HONEYWELL System Integration Introduction
11.7.4 HONEYWELL Revenue in System Integration Business (2017-2022)
11.7.5 HONEYWELL Recent Developments
11.8 IBM
11.8.1 IBM Company Details
11.8.2 IBM Business Overview
11.8.3 IBM System Integration Introduction
11.8.4 IBM Revenue in System Integration Business (2017-2022)
11.8.5 IBM Recent Developments
11.9 INFOSYS
11.9.1 INFOSYS Company Details
11.9.2 INFOSYS Business Overview
11.9.3 INFOSYS System Integration Introduction
11.9.4 INFOSYS Revenue in System Integration Business (2017-2022)
11.9.5 INFOSYS Recent Developments
11.10 MAHINDRA SATYAM
11.10.1 MAHINDRA SATYAM Company Details
11.10.2 MAHINDRA SATYAM Business Overview
11.10.3 MAHINDRA SATYAM System Integration Introduction
11.10.4 MAHINDRA SATYAM Revenue in System Integration Business (2017-2022)
11.10.5 MAHINDRA SATYAM Recent Developments
11.11 MANNAI
11.11.1 MANNAI Company Details
11.11.2 MANNAI Business Overview
11.11.3 MANNAI System Integration Introduction
11.11.4 MANNAI Revenue in System Integration Business (2017-2022)
11.11.5 MANNAI Recent Developments
11.12 NESS TECHNOLOGIES
11.12.1 NESS TECHNOLOGIES Company Details
11.12.2 NESS TECHNOLOGIES Business Overview
11.12.3 NESS TECHNOLOGIES System Integration Introduction
11.12.4 NESS TECHNOLOGIES Revenue in System Integration Business (2017-2022)
11.12.5 NESS TECHNOLOGIES Recent Developments
11.13 ORACLE
11.13.1 ORACLE Company Details
11.13.2 ORACLE Business Overview
11.13.3 ORACLE System Integration Introduction
11.13.4 ORACLE Revenue in System Integration Business (2017-2022)
11.13.5 ORACLE Recent Developments
11.14 SIEMENS
11.14.1 SIEMENS Company Details
11.14.2 SIEMENS Business Overview
11.14.3 SIEMENS System Integration Introduction
11.14.4 SIEMENS Revenue in System Integration Business (2017-2022)
11.14.5 SIEMENS Recent Developments
11.15 TATA CONSULTANCY SERVICES
11.15.1 TATA CONSULTANCY SERVICES Company Details
11.15.2 TATA CONSULTANCY SERVICES Business Overview
11.15.3 TATA CONSULTANCY SERVICES System Integration Introduction
11.15.4 TATA CONSULTANCY SERVICES Revenue in System Integration Business (2017-2022)
11.15.5 TATA CONSULTANCY SERVICES Recent Developments
11.16 WIPRO
11.16.1 WIPRO Company Details
11.16.2 WIPRO Business Overview
11.16.3 WIPRO System Integration Introduction
11.16.4 WIPRO Revenue in System Integration Business (2017-2022)
11.16.5 WIPRO Recent Developments
11.17 DELOITTE
11.17.1 DELOITTE Company Details
11.17.2 DELOITTE Business Overview
11.17.3 DELOITTE System Integration Introduction
11.17.4 DELOITTE Revenue in System Integration Business (2017-2022)
11.17.5 DELOITTE Recent Developments
11.18 BT GROUP PLC
11.18.1 BT GROUP PLC Company Details
11.18.2 BT GROUP PLC Business Overview
11.18.3 BT GROUP PLC System Integration Introduction
11.18.4 BT GROUP PLC Revenue in System Integration Business (2017-2022)
11.18.5 BT GROUP PLC Recent Developments
11.19 DIMENSION DATA
11.19.1 DIMENSION DATA Company Details
11.19.2 DIMENSION DATA Business Overview
11.19.3 DIMENSION DATA System Integration Introduction
11.19.4 DIMENSION DATA Revenue in System Integration Business (2017-2022)
11.19.5 DIMENSION DATA Recent Developments
11.20 GIJIMA
11.20.1 GIJIMA Company Details
11.20.2 GIJIMA Business Overview
11.20.3 GIJIMA System Integration Introduction
11.20.4 GIJIMA Revenue in System Integration Business (2017-2022)
11.20.5 GIJIMA Recent Developments
12 Analyst's Viewpoints/Conclusions
13 Appendix
13.1 Research Methodology
13.1.1 Methodology/Research Approach
13.1.2 Data Source
13.2 Author Details
13.3 Disclaimer
Table 1. Global System Integration Market Size Growth Rate by Type (US$ Million), 2017 VS 2021 VS 2028
Table 2. Key Players of Infrastructure integration services market
Table 3. Key Players of Application integration services market
Table 4. Key Players of Consulting services
Table 5. Global System Integration Market Size Growth Rate by Application (US$ Million), 2017 VS 2021 VS 2028
Table 6. Global System Integration Market Size by Region (US$ Million): 2017 VS 2021 VS 2028
Table 7. Global System Integration Market Size by Region (2017-2022) & (US$ Million)
Table 8. Global System Integration Market Share by Region (2017-2022)
Table 9. Global System Integration Forecasted Market Size by Region (2023-2028) & (US$ Million)
Table 10. Global System Integration Market Share by Region (2023-2028)
Table 11. System Integration Market Trends
Table 12. System Integration Market Drivers
Table 13. System Integration Market Challenges
Table 14. System Integration Market Restraints
Table 15. Global System Integration Revenue by Players (2017-2022) & (US$ Million)
Table 16. Global System Integration Revenue Share by Players (2017-2022)
Table 17. Global Top System Integration by Company Type (Tier 1, Tier 2, and Tier 3) & (based on the Revenue in System Integration as of 2021)
Table 18. Ranking of Global Top System Integration Companies by Revenue (US$ Million) in 2021
Table 19. Global 5 Largest Players Market Share by System Integration Revenue (CR5 and HHI) & (2017-2022)
Table 20. Key Players Headquarters and Area Served
Table 21. Key Players System Integration Product Solution and Service
Table 22. Date of Enter into System Integration Market
Table 23. Mergers & Acquisitions, Expansion Plans
Table 24. Global System Integration Market Size by Type (2017-2022) & (US$ Million)
Table 25. Global System Integration Revenue Market Share by Type (2017-2022)
Table 26. Global System Integration Forecasted Market Size by Type (2023-2028) & (US$ Million)
Table 27. Global System Integration Revenue Market Share by Type (2023-2028)
Table 28. Global System Integration Market Size by Application (2017-2022) & (US$ Million)
Table 29. Global System Integration Revenue Share by Application (2017-2022)
Table 30. Global System Integration Forecasted Market Size by Application (2023-2028) & (US$ Million)
Table 31. Global System Integration Revenue Share by Application (2023-2028)
Table 32. North America System Integration Market Size by Type (2017-2022) & (US$ Million)
Table 33. North America System Integration Market Size by Type (2023-2028) & (US$ Million)
Table 34. North America System Integration Market Size by Application (2017-2022) & (US$ Million)
Table 35. North America System Integration Market Size by Application (2023-2028) & (US$ Million)
Table 36. North America System Integration Market Size by Country (2017-2022) & (US$ Million)
Table 37. North America System Integration Market Size by Country (2023-2028) & (US$ Million)
Table 38. Europe System Integration Market Size by Type (2017-2022) & (US$ Million)
Table 39. Europe System Integration Market Size by Type (2023-2028) & (US$ Million)
Table 40. Europe System Integration Market Size by Application (2017-2022) & (US$ Million)
Table 41. Europe System Integration Market Size by Application (2023-2028) & (US$ Million)
Table 42. Europe System Integration Market Size by Country (2017-2022) & (US$ Million)
Table 43. Europe System Integration Market Size by Country (2023-2028) & (US$ Million)
Table 44. Asia Pacific System Integration Market Size by Type (2017-2022) & (US$ Million)
Table 45. Asia Pacific System Integration Market Size by Type (2023-2028) & (US$ Million)
Table 46. Asia Pacific System Integration Market Size by Application (2017-2022) & (US$ Million)
Table 47. Asia Pacific System Integration Market Size by Application (2023-2028) & (US$ Million)
Table 48. Asia Pacific System Integration Market Size by Region (2017-2022) & (US$ Million)
Table 49. Asia Pacific System Integration Market Size by Region (2023-2028) & (US$ Million)
Table 50. Latin America System Integration Market Size by Type (2017-2022) & (US$ Million)
Table 51. Latin America System Integration Market Size by Type (2023-2028) & (US$ Million)
Table 52. Latin America System Integration Market Size by Application (2017-2022) & (US$ Million)
Table 53. Latin America System Integration Market Size by Application (2023-2028) & (US$ Million)
Table 54. Latin America System Integration Market Size by Country (2017-2022) & (US$ Million)
Table 55. Latin America System Integration Market Size by Country (2023-2028) & (US$ Million)
Table 56. Middle East and Africa System Integration Market Size by Type (2017-2022) & (US$ Million)
Table 57. Middle East and Africa System Integration Market Size by Type (2023-2028) & (US$ Million)
Table 58. Middle East and Africa System Integration Market Size by Application (2017-2022) & (US$ Million)
Table 59. Middle East and Africa System Integration Market Size by Application (2023-2028) & (US$ Million)
Table 60. Middle East and Africa System Integration Market Size by Country (2017-2022) & (US$ Million)
Table 61. Middle East and Africa System Integration Market Size by Country (2023-2028) & (US$ Million)
Table 62. ACCENTURE Company Details
Table 63. ACCENTURE Business Overview
Table 64. ACCENTURE System Integration Product
Table 65. ACCENTURE Revenue in System Integration Business (2017-2022) & (US$ Million)
Table 66. ACCENTURE Recent Developments
Table 67. ALCATEL-LUCENT Company Details
Table 68. ALCATEL-LUCENT Business Overview
Table 69. ALCATEL-LUCENT System Integration Product
Table 70. ALCATEL-LUCENT Revenue in System Integration Business (2017-2022) & (US$ Million)
Table 71. ALCATEL-LUCENT Recent Developments
Table 72. BUSINESS CONNEXION Company Details
Table 73. BUSINESS CONNEXION Business Overview
Table 74. BUSINESS CONNEXION System Integration Product
Table 75. BUSINESS CONNEXION Revenue in System Integration Business (2017-2022) & (US$ Million)
Table 76. BUSINESS CONNEXION Recent Developments
Table 77. DEUTSCHE TELEKOM (T-SYSTEMS) Company Details
Table 78. DEUTSCHE TELEKOM (T-SYSTEMS) Business Overview
Table 79. DEUTSCHE TELEKOM (T-SYSTEMS) System Integration Product
Table 80. DEUTSCHE TELEKOM (T-SYSTEMS) Revenue in System Integration Business (2017-2022) & (US$ Million)
Table 81. DEUTSCHE TELEKOM (T-SYSTEMS) Recent Developments
Table 82. ERICSSON Company Details
Table 83. ERICSSON Business Overview
Table 84. ERICSSON System Integration Product
Table 85. ERICSSON Revenue in System Integration Business (2017-2022) & (US$ Million)
Table 86. ERICSSON Recent Developments
Table 87. HPE Company Details
Table 88. HPE Business Overview
Table 89. HPE System Integration Product
Table 90. HPE Revenue in System Integration Business (2017-2022) & (US$ Million)
Table 91. HPE Recent Developments
Table 92. HONEYWELL Company Details
Table 93. HONEYWELL Business Overview
Table 94. HONEYWELL System Integration Product
Table 95. HONEYWELL Revenue in System Integration Business (2017-2022) & (US$ Million)
Table 96. HONEYWELL Recent Developments
Table 97. IBM Company Details
Table 98. IBM Business Overview
Table 99. IBM System Integration Product
Table 100. IBM Revenue in System Integration Business (2017-2022) & (US$ Million)
Table 101. IBM Recent Developments
Table 102. INFOSYS Company Details
Table 103. INFOSYS Business Overview
Table 104. INFOSYS System Integration Product
Table 105. INFOSYS Revenue in System Integration Business (2017-2022) & (US$ Million)
Table 106. INFOSYS Recent Developments
Table 107. MAHINDRA SATYAM Company Details
Table 108. MAHINDRA SATYAM Business Overview
Table 109. MAHINDRA SATYAM System Integration Product
Table 110. MAHINDRA SATYAM Revenue in System Integration Business (2017-2022) & (US$ Million)
Table 111. MAHINDRA SATYAM Recent Developments
Table 112. MANNAI Company Details
Table 113. MANNAI Business Overview
Table 114. MANNAI System Integration Product
Table 115. MANNAI Revenue in System Integration Business (2017-2022) & (US$ Million)
Table 116. MANNAI Recent Developments
Table 117. NESS TECHNOLOGIES Company Details
Table 118. NESS TECHNOLOGIES Business Overview
Table 119. NESS TECHNOLOGIES System Integration Product
Table 120. NESS TECHNOLOGIES Revenue in System Integration Business (2017-2022) & (US$ Million)
Table 121. NESS TECHNOLOGIES Recent Developments
Table 122. ORACLE Company Details
Table 123. ORACLE Business Overview
Table 124. ORACLE System Integration Product
Table 125. ORACLE Revenue in System Integration Business (2017-2022) & (US$ Million)
Table 126. ORACLE Recent Developments
Table 127. SIEMENS Company Details
Table 128. SIEMENS Business Overview
Table 129. SIEMENS System Integration Product
Table 130. SIEMENS Revenue in System Integration Business (2017-2022) & (US$ Million)
Table 131. SIEMENS Recent Developments
Table 132. TATA CONSULTANCY SERVICES Company Details
Table 133. TATA CONSULTANCY SERVICES Business Overview
Table 134. TATA CONSULTANCY SERVICES System Integration Product
Table 135. TATA CONSULTANCY SERVICES Revenue in System Integration Business (2017-2022) & (US$ Million)
Table 136. TATA CONSULTANCY SERVICES Recent Developments
Table 137. WIPRO Company Details
Table 138. WIPRO Business Overview
Table 139. WIPRO System Integration Product
Table 140. WIPRO Revenue in System Integration Business (2017-2022) & (US$ Million)
Table 141. WIPRO Recent Developments
Table 142. DELOITTE Company Details
Table 143. DELOITTE Business Overview
Table 144. DELOITTE System Integration Product
Table 145. DELOITTE Revenue in System Integration Business (2017-2022) & (US$ Million)
Table 146. DELOITTE Recent Developments
Table 147. BT GROUP PLC Company Details
Table 148. BT GROUP PLC Business Overview
Table 149. BT GROUP PLC System Integration Product
Table 150. BT GROUP PLC Revenue in System Integration Business (2017-2022) & (US$ Million)
Table 151. BT GROUP PLC Recent Developments
Table 152. DIMENSION DATA Company Details
Table 153. DIMENSION DATA Business Overview
Table 154. DIMENSION DATA System Integration Product
Table 155. DIMENSION DATA Revenue in System Integration Business (2017-2022) & (US$ Million)
Table 156. DIMENSION DATA Recent Developments
Table 157. GIJIMA Company Details
Table 158. GIJIMA Business Overview
Table 159. GIJIMA System Integration Product
Table 160. GIJIMA Revenue in System Integration Business (2017-2022) & (US$ Million)
Table 161. GIJIMA Recent Developments
Table 162. Research Programs/Design for This Report
Table 163. Key Data Information from Secondary Sources
Table 164. Key Data Information from Primary Sources
List of Figures
Figure 1. Global System Integration Market Share by Type: 2021 VS 2028
Figure 2. Infrastructure integration services market Features
Figure 3. Application integration services market Features
Figure 4. Consulting services Features
Figure 5. Global System Integration Market Share by Application: 2021 VS 2028
Figure 6. Banking, financial services, and insurance Case Studies
Figure 7. Communications and media Case Studies
Figure 8. Manufacturing (discrete and process) Case Studies
Figure 9. Government Case Studies
Figure 10. Health Case Studies
Figure 11. Wholesale and retail services Case Studies
Figure 12. Services Case Studies
Figure 13. Transportation Case Studies
Figure 14. Utilities and resources Case Studies
Figure 15. System Integration Report Years Considered
Figure 16. Global System Integration Market Size (US$ Million), Year-over-Year: 2017-2028
Figure 17. Global System Integration Market Size, (US$ Million), 2017 VS 2021 VS 2028
Figure 18. Global System Integration Market Share by Region: 2021 VS 2028
Figure 19. Global System Integration Market Share by Players in 2021
Figure 20. Global Top System Integration Players by Company Type (Tier 1, Tier 2, and Tier 3) & (based on the Revenue in System Integration as of 2021)
Figure 21. The Top 10 and 5 Players Market Share by System Integration Revenue in 2021
Figure 22. North America System Integration Market Size YoY (2017-2028) & (US$ Million)
Figure 23. North America System Integration Market Size Market Share by Type (2017-2028)
Figure 24. North America System Integration Market Size Market Share by Application (2017-2028)
Figure 25. North America System Integration Market Size Share by Country (2017-2028)
Figure 26. United States System Integration Market Size YoY Growth (2017-2028) & (US$ Million)
Figure 27. Canada System Integration Market Size YoY Growth (2017-2028) & (US$ Million)
Figure 28. Europe System Integration Market Size YoY (2017-2028) & (US$ Million)
Figure 29. Europe System Integration Market Size Market Share by Type (2017-2028)
Figure 30. Europe System Integration Market Size Market Share by Application (2017-2028)
Figure 31. Europe System Integration Market Size Share by Country (2017-2028)
Figure 32. Germany System Integration Market Size YoY Growth (2017-2028) & (US$ Million)
Figure 33. France System Integration Market Size YoY Growth (2017-2028) & (US$ Million)
Figure 34. U.K. System Integration Market Size YoY Growth (2017-2028) & (US$ Million)
Figure 35. Italy System Integration Market Size YoY Growth (2017-2028) & (US$ Million)
Figure 36. Russia System Integration Market Size YoY Growth (2017-2028) & (US$ Million)
Figure 37. Nordic Countries System Integration Market Size YoY Growth (2017-2028) & (US$ Million)
Figure 38. Asia-Pacific System Integration Market Size YoY (2017-2028) & (US$ Million)
Figure 39. Asia Pacific System Integration Market Size Market Share by Type (2017-2028)
Figure 40. Asia Pacific System Integration Market Size Market Share by Application (2017-2028)
Figure 41. Asia Pacific System Integration Market Size Share by Region (2017-2028)
Figure 42. China System Integration Market Size YoY Growth (2017-2028) & (US$ Million)
Figure 43. Japan System Integration Market Size YoY Growth (2017-2028) & (US$ Million)
Figure 44. South Korea System Integration Market Size YoY Growth (2017-2028) & (US$ Million)
Figure 45. Southeast Asia System Integration Market Size YoY Growth (2017-2028) & (US$ Million)
Figure 46. India System Integration Market Size YoY Growth (2017-2028) & (US$ Million)
Figure 47. Australia System Integration Market Size YoY Growth (2017-2028) & (US$ Million)
List of Figures
Figure 48. Latin America System Integration Market Size YoY (2017-2028) & (US$ Million)
Figure 49. Latin America System Integration Market Size Market Share by Type (2017-2028)
Figure 50. Latin America System Integration Market Size Market Share by Application (2017-2028)
Figure 51. Latin America System Integration Market Size Share by Country (2017-2028)
Figure 52. Mexico System Integration Market Size YoY Growth (2017-2028) & (US$ Million)
Figure 53. Brazil System Integration Market Size YoY Growth (2017-2028) & (US$ Million)
Figure 54. Middle East & Africa System Integration Market Size YoY (2017-2028) & (US$ Million)
Figure 55. Middle East and Africa System Integration Market Size Market Share by Type (2017-2028)
Figure 56. Middle East and Africa System Integration Market Size Market Share by Application (2017-2028)
Figure 57. Middle East and Africa System Integration Market Size Share by Country (2017-2028)
Figure 58. Turkey System Integration Market Size YoY Growth (2017-2028) & (US$ Million)
Figure 59. Saudi Arabia System Integration Market Size YoY Growth (2017-2028) & (US$ Million)
Figure 60. UAE System Integration Market Size YoY Growth (2017-2028) & (US$ Million)
Figure 61. ACCENTURE Revenue Growth Rate in System Integration Business (2017-2022)
Figure 62. ALCATEL-LUCENT Revenue Growth Rate in System Integration Business (2017-2022)
Figure 63. BUSINESS CONNEXION Revenue Growth Rate in System Integration Business (2017-2022)
Figure 64. DEUTSCHE TELEKOM (T-SYSTEMS) Revenue Growth Rate in System Integration Business (2017-2022)
Figure 65. ERICSSON Revenue Growth Rate in System Integration Business (2017-2022)
Figure 66. HPE Revenue Growth Rate in System Integration Business (2017-2022)
Figure 67. HONEYWELL Revenue Growth Rate in System Integration Business (2017-2022)
Figure 68. IBM Revenue Growth Rate in System Integration Business (2017-2022)
Figure 69. INFOSYS Revenue Growth Rate in System Integration Business (2017-2022)
Figure 70. MAHINDRA SATYAM Revenue Growth Rate in System Integration Business (2017-2022)
Figure 71. MANNAI Revenue Growth Rate in System Integration Business (2017-2022)
Figure 72. NESS TECHNOLOGIES Revenue Growth Rate in System Integration Business (2017-2022)
Figure 73. ORACLE Revenue Growth Rate in System Integration Business (2017-2022)
Figure 74. SIEMENS Revenue Growth Rate in System Integration Business (2017-2022)
Figure 75. TATA CONSULTANCY SERVICES Revenue Growth Rate in System Integration Business (2017-2022)
Figure 76. WIPRO Revenue Growth Rate in System Integration Business (2017-2022)
Figure 77. DELOITTE Revenue Growth Rate in System Integration Business (2017-2022)
Figure 78. BT GROUP PLC Revenue Growth Rate in System Integration Business (2017-2022)
Figure 79. DIMENSION DATA Revenue Growth Rate in System Integration Business (2017-2022)
Figure 80. GIJIMA Revenue Growth Rate in System Integration Business (2017-2022)
Figure 81. Bottom-up and Top-down Approaches for This Report
Figure 82. Data Triangulation
Figure 83. Key Executives Interviewed
$4900
$7350
$9800
HAVE A QUERY?
OUR CUSTOMER
SIMILAR REPORTS
Add to Cart
Add to Cart
Add to Cart
Add to Cart