
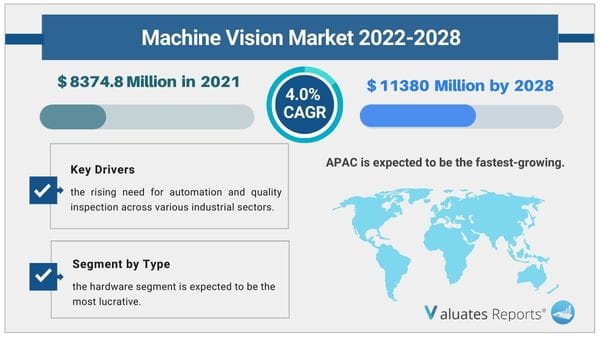
The global Machine Vision market size is projected to reach US$ 11380 million by 2028, from US$ 8374.8 million in 2021, at a CAGR of 4.0% during 2022-2028. Key drivers of the machine vision market include rising use in the food industry for sorting, labeling, and detecting faults in packages, and containers.
The continuous miniaturization of semiconductors has made it impossible for the human eye to detect flaws in the production processes thereby requiring the need for robots that use machine vision. This will bolster the machine vision market growth in the coming years.
The rising trend of automation in the logistics industry will surge the growth of the market in the forthcoming years.
Ecological loss and climate change are putting pressure on the agriculture industry to deliver enhanced crop yield for meeting the demand of a large population, in turn, driving the growth of the global machine vision market.
Food industry
The growing focus on food quality, safety, and stricter regulatory guidelines by FDA has mandated the use of machine vision technology for food processors and OEM manufacturers. Barcode readers were the norm. However, in recent years solid hardware solutions like cameras have entered thereby driving the growth of the machine vision market. They combine character reading with pattern searches to detect date codes, product descriptions, and equipment traceability. The cameras make use of programming and vision capabilities to manage the hygiene of equipment and the quality of food products. Moreover, it is also used for assessing container integrity, labeling, and checking the appropriate quantity of food packets. Cross-packet contamination, accumulation of debris, and temperature checks are done regularly. On top of it measuring the allergen levels, food ripeness, color, and spoilage is a must.
Semiconductor industry
Robots have become ubiquitous in the semiconductor manufacturing process. They are efficient to perform on-the-fly testing and use an attached camera with a microscope to detect and classify defects. A high-resolution image-based comparison is performed on the wafer side by side. Chips with similar geometries are compared with one another to ensure time to market and no significant production downtime. This will drive the machine vision market growth during the forecast period. The chips are also compared with cell-to-cell, dye, and pixel levels. All the data gets registered and the problematic wafer area is prepared for the classification stage. Herein the type of fault is determined for fixing the fabrication process. Computer vision algorithms are used for feature extractions and the images are tagged with their fault type for final recovery.
Logistics industry
The high demand for automation and the need for improving employee productivity are driving the massive adoption of machine vision systems. This will bolster the growth of the global machine vision market. The smart cameras based on pattern recognition identify container sha[es, dimensions to optimize the loading of a truck. The inbuilt sensors and 3D cameras are ideal for package sorting, date code inspection, and gloss detection. The verification is done in precise terms and the measurement is accurate. Objects are located even in low contrast situations removing concerns of displacement. Barcodes and images are taken from multiple angles and there is no need for manual intervention. Service throughput and preventative maintenance are also possible. Moving more products per hour with negligible mistakes decreases operational costs in the long run and increases customer satisfaction.
Agricultural Industry
The rising population explosion and global warming-initiated ecological loss are creating tremendous pressure on the agricultural industry to meet the worldwide food demand. Precision-based crops use machine vision technology. This will drive the growth of the machine vision market. The computer vision algorithms combine satellite imagery and identify the patterns in the field. Any anomaly detection is sent to the farmers for further scrutiny. The inherent artificial intelligence provides them the information on what weed types are attacking the crops in real-time. The drones capture multi-spectral imagery with high resolutions and the deep learning models use cloud computing to predict crop health issues. Vast farmlands are scanned frequently to provide real-time threat detection. Customized herbicides are prepared for removing the weed types. The algorithms also keep track of the spread of disease and infestations at the time they originate. These solutions are phasing out time-consuming and expensive crop monitoring practices.
Based on type, the hardware segment will dominate the machine vision market share as objects such as cameras, frame grabbers, and sensors are getting deployed extensively in machine vision technologies for use in several industry verticals.
Based on application, the food industry will be the most lucrative as F&B companies are developing application-specific technologies for quality checking, processing, sorting, and grading.
Based on region, Asia-Pacific is expected to grow the highest due to the presence of a huge manufacturing base in emerging countries like China, South Korea, and Japan. The advent of automation, industry 4.0, and smart manufacturing practices will also contribute to the growth of the segment.
| Report Metric | Details |
| Report Name | Machine Vision |
| The market size in 2021 | USD 8374.8 Million |
| The revenue forecast in 2028 | USD 11380 Million |
| Growth Rate | Compound Annual Growth Rate (CAGR) of 4.0% from 2022 to 2028 |
| Market size available for years | 2022-2028 |
| Forecast units | Value (USD) |
| Segments covered | Type, Application and Region |
| Report coverage | Revenue & volume forecast, company share, competitive landscape, growth factors, and trends |
| Geographic regions covered | North America, Europe, Asia Pacific, Latin America, Middle East & Africa |
Ans. APAC is expected to be the fastest-growing market.
Ans. Increasing demand for a vision-guided robotic system and Increasing application in the pharmaceutical and food packaging industry.
Ans. The market players operating in the machine vision market analysis include Cognex, Basler, Omron, National Instruments, Keyence, Sony, Teledyne Technologies, Texas Instruments, Allied Vision Technologies, Intel, Baumer Optronic
Ans. The forecast period for machine vision market is 2022 to 2028.
Ans. The global Machine Vision market size is projected to reach US$ 11380 million by 2028, from US$ 8374.8 million in 2021, at a CAGR of 4.0% during 2022-2028.
Table of content:
1 Report Business Overview
1.1 Study Scope
1.2 Market Analysis by Type
1.2.1 Global Machine Vision Market Size Growth Rate by Type, 2017 VS 2021 VS 2028
1.2.2 Hardware (Camera, Frame Grabber, Optics, Processor)
1.2.3 Software (Deep Learning and Application Specific)
1.3 Market by Application
1.3.1 Global Machine Vision Market Size Growth Rate by Application, 2017 VS 2021 VS 2028
1.3.2 Semiconductor Industry
1.3.3 Food Industry
1.3.4 Logistics
1.3.5 Agricultural
1.3.6 Other
1.4 Study Objectives
1.5 Years Considered
2 Global Growth Trends
2.1 Global Machine Vision Market Perspective (2017-2028)
2.2 Machine Vision Growth Trends by Region
2.2.1 Machine Vision Market Size by Region: 2017 VS 2021 VS 2028
2.2.2 Machine Vision Historic Market Size by Region (2017-2022)
2.2.3 Machine Vision Forecasted Market Size by Region (2023-2028)
2.3 Machine Vision Market Dynamics
2.3.1 Machine Vision Industry Trends
2.3.2 Machine Vision Market Drivers
2.3.3 Machine Vision Market Challenges
2.3.4 Machine Vision Market Restraints
3 Competition Landscape by Key Players
3.1 Global Top Machine Vision Players by Revenue
3.1.1 Global Top Machine Vision Players by Revenue (2017-2022)
3.1.2 Global Machine Vision Revenue Market Share by Players (2017-2022)
3.2 Global Machine Vision Market Share by Company Type (Tier 1, Tier 2, and Tier 3)
3.3 Players Covered: Ranking by Machine Vision Revenue
3.4 Global Machine Vision Market Concentration Ratio
3.4.1 Global Machine Vision Market Concentration Ratio (CR5 and HHI)
3.4.2 Global Top 10 and Top 5 Companies by Machine Vision Revenue in 2021
3.5 Machine Vision Key Players Head office and Area Served
3.6 Key Players Machine Vision Product Solution and Service
3.7 Date of Enter into Machine Vision Market
3.8 Mergers & Acquisitions, Expansion Plans
4 Machine Vision Breakdown Data by Type
4.1 Global Machine Vision Historic Market Size by Type (2017-2022)
4.2 Global Machine Vision Forecasted Market Size by Type (2023-2028)
5 Machine Vision Breakdown Data by Application
5.1 Global Machine Vision Historic Market Size by Application (2017-2022)
5.2 Global Machine Vision Forecasted Market Size by Application (2023-2028)
6 North America
6.1 North America Machine Vision Market Size (2017-2028)
6.2 North America Machine Vision Market Size by Type
6.2.1 North America Machine Vision Market Size by Type (2017-2022)
6.2.2 North America Machine Vision Market Size by Type (2023-2028)
6.2.3 North America Machine Vision Market Share by Type (2017-2028)
6.3 North America Machine Vision Market Size by Application
6.3.1 North America Machine Vision Market Size by Application (2017-2022)
6.3.2 North America Machine Vision Market Size by Application (2023-2028)
6.3.3 North America Machine Vision Market Share by Application (2017-2028)
6.4 North America Machine Vision Market Size by Country
6.4.1 North America Machine Vision Market Size by Country (2017-2022)
6.4.2 North America Machine Vision Market Size by Country (2023-2028)
6.4.3 U.S.
6.4.4 Canada
7 Europe
7.1 Europe Machine Vision Market Size (2017-2028)
7.2 Europe Machine Vision Market Size by Type
7.2.1 Europe Machine Vision Market Size by Type (2017-2022)
7.2.2 Europe Machine Vision Market Size by Type (2023-2028)
7.2.3 Europe Machine Vision Market Share by Type (2017-2028)
7.3 Europe Machine Vision Market Size by Application
7.3.1 Europe Machine Vision Market Size by Application (2017-2022)
7.3.2 Europe Machine Vision Market Size by Application (2023-2028)
7.3.3 Europe Machine Vision Market Share by Application (2017-2028)
7.4 Europe Machine Vision Market Size by Country
7.4.1 Europe Machine Vision Market Size by Country (2017-2022)
7.4.2 Europe Machine Vision Market Size by Country (2023-2028)
7.4.3 Germany
7.4.4 France
7.4.5 U.K.
7.4.6 Italy
7.4.7 Russia
7.4.8 Nordic Countries
8 Asia-Pacific
8.1 Asia-Pacific Machine Vision Market Size (2017-2028)
8.2 Asia-Pacific Machine Vision Market Size by Type
8.2.1 Asia-Pacific Machine Vision Market Size by Type (2017-2022)
8.2.2 Asia-Pacific Machine Vision Market Size by Type (2023-2028)
8.2.3 Asia-Pacific Machine Vision Market Share by Type (2017-2028)
8.3 Asia-Pacific Machine Vision Market Size by Application
8.3.1 Asia-Pacific Machine Vision Market Size by Application (2017-2022)
8.3.2 Asia-Pacific Machine Vision Market Size by Application (2023-2028)
8.3.3 Asia-Pacific Machine Vision Market Share by Application (2017-2028)
8.4 Asia-Pacific Machine Vision Market Size by Region
8.4.1 Asia-Pacific Machine Vision Market Size by Region (2017-2022)
8.4.2 Asia-Pacific Machine Vision Market Size by Region (2023-2028)
8.4.3 China
8.4.4 Japan
8.4.5 South Korea
8.4.6 Southeast Asia
8.4.7 India
8.4.8 Australia
9 Latin America
9.1 Latin America Machine Vision Market Size (2017-2028)
9.2 Latin America Machine Vision Market Size by Type
9.2.1 Latin America Machine Vision Market Size by Type (2017-2022)
9.2.2 Latin America Machine Vision Market Size by Type (2023-2028)
9.2.3 Latin America Machine Vision Market Share by Type (2017-2028)
9.3 Latin America Machine Vision Market Size by Application
9.3.1 Latin America Machine Vision Market Size by Application (2017-2022)
9.3.2 Latin America Machine Vision Market Size by Application (2023-2028)
9.3.3 Latin America Machine Vision Market Share by Application (2017-2028)
9.4 Latin America Machine Vision Market Size by Country
9.4.1 Latin America Machine Vision Market Size by Country (2017-2022)
9.4.2 Latin America Machine Vision Market Size by Country (2023-2028)
9.4.3 Mexico
9.4.4 Brazil
10 Middle East & Africa
10.1 Middle East & Africa Machine Vision Market Size (2017-2028)
10.2 Middle East & Africa Machine Vision Market Size by Type
10.2.1 Middle East & Africa Machine Vision Market Size by Type (2017-2022)
10.2.2 Middle East & Africa Machine Vision Market Size by Type (2023-2028)
10.2.3 Middle East & Africa Machine Vision Market Share by Type (2017-2028)
10.3 Middle East & Africa Machine Vision Market Size by Application
10.3.1 Middle East & Africa Machine Vision Market Size by Application (2017-2022)
10.3.2 Middle East & Africa Machine Vision Market Size by Application (2023-2028)
10.3.3 Middle East & Africa Machine Vision Market Share by Application (2017-2028)
10.4 Middle East & Africa Machine Vision Market Size by Country
10.4.1 Middle East & Africa Machine Vision Market Size by Country (2017-2022)
10.4.2 Middle East & Africa Machine Vision Market Size by Country (2023-2028)
10.4.3 Turkey
10.4.4 Saudi Arabia
10.4.5 UAE
11 Key Players Profiles
11.1 Cognex
11.1.1 Cognex Company Details
11.1.2 Cognex Business Overview
11.1.3 Cognex Machine Vision Introduction
11.1.4 Cognex Revenue in Machine Vision Business (2017-2022)
11.1.5 Cognex Recent Developments
11.2 Basler
11.2.1 Basler Company Details
11.2.2 Basler Business Overview
11.2.3 Basler Machine Vision Introduction
11.2.4 Basler Revenue in Machine Vision Business (2017-2022)
11.2.5 Basler Recent Developments
11.3 Omron
11.3.1 Omron Company Details
11.3.2 Omron Business Overview
11.3.3 Omron Machine Vision Introduction
11.3.4 Omron Revenue in Machine Vision Business (2017-2022)
11.3.5 Omron Recent Developments
11.4 National Instruments
11.4.1 National Instruments Company Details
11.4.2 National Instruments Business Overview
11.4.3 National Instruments Machine Vision Introduction
11.4.4 National Instruments Revenue in Machine Vision Business (2017-2022)
11.4.5 National Instruments Recent Developments
11.5 Keyence
11.5.1 Keyence Company Details
11.5.2 Keyence Business Overview
11.5.3 Keyence Machine Vision Introduction
11.5.4 Keyence Revenue in Machine Vision Business (2017-2022)
11.5.5 Keyence Recent Developments
11.6 Sony
11.6.1 Sony Company Details
11.6.2 Sony Business Overview
11.6.3 Sony Machine Vision Introduction
11.6.4 Sony Revenue in Machine Vision Business (2017-2022)
11.6.5 Sony Recent Developments
11.7 Teledyne Technologies
11.7.1 Teledyne Technologies Company Details
11.7.2 Teledyne Technologies Business Overview
11.7.3 Teledyne Technologies Machine Vision Introduction
11.7.4 Teledyne Technologies Revenue in Machine Vision Business (2017-2022)
11.7.5 Teledyne Technologies Recent Developments
11.8 Texas Instruments
11.8.1 Texas Instruments Company Details
11.8.2 Texas Instruments Business Overview
11.8.3 Texas Instruments Machine Vision Introduction
11.8.4 Texas Instruments Revenue in Machine Vision Business (2017-2022)
11.8.5 Texas Instruments Recent Developments
11.9 Allied Vision Technologies
11.9.1 Allied Vision Technologies Company Details
11.9.2 Allied Vision Technologies Business Overview
11.9.3 Allied Vision Technologies Machine Vision Introduction
11.9.4 Allied Vision Technologies Revenue in Machine Vision Business (2017-2022)
11.9.5 Allied Vision Technologies Recent Developments
11.10 Intel
11.10.1 Intel Company Details
11.10.2 Intel Business Overview
11.10.3 Intel Machine Vision Introduction
11.10.4 Intel Revenue in Machine Vision Business (2017-2022)
11.10.5 Intel Recent Developments
11.11 Baumer Optronic
11.11.1 Baumer Optronic Company Details
11.11.2 Baumer Optronic Business Overview
11.11.3 Baumer Optronic Machine Vision Introduction
11.11.4 Baumer Optronic Revenue in Machine Vision Business (2017-2022)
11.11.5 Baumer Optronic Recent Developments
12 Analyst's Viewpoints/Conclusions
13 Appendix
13.1 Research Methodology
13.1.1 Methodology/Research Approach
13.1.2 Data Source
13.2 Author Details
13.3 Disclaimer
Table 1. Global Machine Vision Market Size Growth Rate by Type (US$ Million), 2017 VS 2021 VS 2028
Table 2. Key Players of Hardware (Camera, Frame Grabber, Optics, Processor)
Table 3. Key Players of Software (Deep Learning and Application Specific)
Table 4. Global Machine Vision Market Size Growth Rate by Application (US$ Million), 2017 VS 2021 VS 2028
Table 5. Global Machine Vision Market Size by Region (US$ Million): 2017 VS 2021 VS 2028
Table 6. Global Machine Vision Market Size by Region (2017-2022) & (US$ Million)
Table 7. Global Machine Vision Market Share by Region (2017-2022)
Table 8. Global Machine Vision Forecasted Market Size by Region (2023-2028) & (US$ Million)
Table 9. Global Machine Vision Market Share by Region (2023-2028)
Table 10. Machine Vision Market Trends
Table 11. Machine Vision Market Drivers
Table 12. Machine Vision Market Challenges
Table 13. Machine Vision Market Restraints
Table 14. Global Machine Vision Revenue by Players (2017-2022) & (US$ Million)
Table 15. Global Machine Vision Revenue Share by Players (2017-2022)
Table 16. Global Top Machine Vision by Company Type (Tier 1, Tier 2, and Tier 3) & (based on the Revenue in Machine Vision as of 2021)
Table 17. Ranking of Global Top Machine Vision Companies by Revenue (US$ Million) in 2021
Table 18. Global 5 Largest Players Market Share by Machine Vision Revenue (CR5 and HHI) & (2017-2022)
Table 19. Key Players Headquarters and Area Served
Table 20. Key Players Machine Vision Product Solution and Service
Table 21. Date of Enter into Machine Vision Market
Table 22. Mergers & Acquisitions, Expansion Plans
Table 23. Global Machine Vision Market Size by Type (2017-2022) & (US$ Million)
Table 24. Global Machine Vision Revenue Market Share by Type (2017-2022)
Table 25. Global Machine Vision Forecasted Market Size by Type (2023-2028) & (US$ Million)
Table 26. Global Machine Vision Revenue Market Share by Type (2023-2028)
Table 27. Global Machine Vision Market Size by Application (2017-2022) & (US$ Million)
Table 28. Global Machine Vision Revenue Share by Application (2017-2022)
Table 29. Global Machine Vision Forecasted Market Size by Application (2023-2028) & (US$ Million)
Table 30. Global Machine Vision Revenue Share by Application (2023-2028)
Table 31. North America Machine Vision Market Size by Type (2017-2022) & (US$ Million)
Table 32. North America Machine Vision Market Size by Type (2023-2028) & (US$ Million)
Table 33. North America Machine Vision Market Size by Application (2017-2022) & (US$ Million)
Table 34. North America Machine Vision Market Size by Application (2023-2028) & (US$ Million)
Table 35. North America Machine Vision Market Size by Country (2017-2022) & (US$ Million)
Table 36. North America Machine Vision Market Size by Country (2023-2028) & (US$ Million)
Table 37. Europe Machine Vision Market Size by Type (2017-2022) & (US$ Million)
Table 38. Europe Machine Vision Market Size by Type (2023-2028) & (US$ Million)
Table 39. Europe Machine Vision Market Size by Application (2017-2022) & (US$ Million)
Table 40. Europe Machine Vision Market Size by Application (2023-2028) & (US$ Million)
Table 41. Europe Machine Vision Market Size by Country (2017-2022) & (US$ Million)
Table 42. Europe Machine Vision Market Size by Country (2023-2028) & (US$ Million)
Table 43. Asia Pacific Machine Vision Market Size by Type (2017-2022) & (US$ Million)
Table 44. Asia Pacific Machine Vision Market Size by Type (2023-2028) & (US$ Million)
Table 45. Asia Pacific Machine Vision Market Size by Application (2017-2022) & (US$ Million)
Table 46. Asia Pacific Machine Vision Market Size by Application (2023-2028) & (US$ Million)
Table 47. Asia Pacific Machine Vision Market Size by Region (2017-2022) & (US$ Million)
Table 48. Asia Pacific Machine Vision Market Size by Region (2023-2028) & (US$ Million)
Table 49. Latin America Machine Vision Market Size by Type (2017-2022) & (US$ Million)
Table 50. Latin America Machine Vision Market Size by Type (2023-2028) & (US$ Million)
Table 51. Latin America Machine Vision Market Size by Application (2017-2022) & (US$ Million)
Table 52. Latin America Machine Vision Market Size by Application (2023-2028) & (US$ Million)
Table 53. Latin America Machine Vision Market Size by Country (2017-2022) & (US$ Million)
Table 54. Latin America Machine Vision Market Size by Country (2023-2028) & (US$ Million)
Table 55. Middle East and Africa Machine Vision Market Size by Type (2017-2022) & (US$ Million)
Table 56. Middle East and Africa Machine Vision Market Size by Type (2023-2028) & (US$ Million)
Table 57. Middle East and Africa Machine Vision Market Size by Application (2017-2022) & (US$ Million)
Table 58. Middle East and Africa Machine Vision Market Size by Application (2023-2028) & (US$ Million)
Table 59. Middle East and Africa Machine Vision Market Size by Country (2017-2022) & (US$ Million)
Table 60. Middle East and Africa Machine Vision Market Size by Country (2023-2028) & (US$ Million)
Table 61. Cognex Company Details
Table 62. Cognex Business Overview
Table 63. Cognex Machine Vision Product
Table 64. Cognex Revenue in Machine Vision Business (2017-2022) & (US$ Million)
Table 65. Cognex Recent Developments
Table 66. Basler Company Details
Table 67. Basler Business Overview
Table 68. Basler Machine Vision Product
Table 69. Basler Revenue in Machine Vision Business (2017-2022) & (US$ Million)
Table 70. Basler Recent Developments
Table 71. Omron Company Details
Table 72. Omron Business Overview
Table 73. Omron Machine Vision Product
Table 74. Omron Revenue in Machine Vision Business (2017-2022) & (US$ Million)
Table 75. Omron Recent Developments
Table 76. National Instruments Company Details
Table 77. National Instruments Business Overview
Table 78. National Instruments Machine Vision Product
Table 79. National Instruments Revenue in Machine Vision Business (2017-2022) & (US$ Million)
Table 80. National Instruments Recent Developments
Table 81. Keyence Company Details
Table 82. Keyence Business Overview
Table 83. Keyence Machine Vision Product
Table 84. Keyence Revenue in Machine Vision Business (2017-2022) & (US$ Million)
Table 85. Keyence Recent Developments
Table 86. Sony Company Details
Table 87. Sony Business Overview
Table 88. Sony Machine Vision Product
Table 89. Sony Revenue in Machine Vision Business (2017-2022) & (US$ Million)
Table 90. Sony Recent Developments
Table 91. Teledyne Technologies Company Details
Table 92. Teledyne Technologies Business Overview
Table 93. Teledyne Technologies Machine Vision Product
Table 94. Teledyne Technologies Revenue in Machine Vision Business (2017-2022) & (US$ Million)
Table 95. Teledyne Technologies Recent Developments
Table 96. Texas Instruments Company Details
Table 97. Texas Instruments Business Overview
Table 98. Texas Instruments Machine Vision Product
Table 99. Texas Instruments Revenue in Machine Vision Business (2017-2022) & (US$ Million)
Table 100. Texas Instruments Recent Developments
Table 101. Allied Vision Technologies Company Details
Table 102. Allied Vision Technologies Business Overview
Table 103. Allied Vision Technologies Machine Vision Product
Table 104. Allied Vision Technologies Revenue in Machine Vision Business (2017-2022) & (US$ Million)
Table 105. Allied Vision Technologies Recent Developments
Table 106. Intel Company Details
Table 107. Intel Business Overview
Table 108. Intel Machine Vision Product
Table 109. Intel Revenue in Machine Vision Business (2017-2022) & (US$ Million)
Table 110. Intel Recent Developments
Table 111. Baumer Optronic Company Details
Table 112. Baumer Optronic Business Overview
Table 113. Baumer Optronic Machine Vision Product
Table 114. Baumer Optronic Revenue in Machine Vision Business (2017-2022) & (US$ Million)
Table 115. Baumer Optronic Recent Developments
Table 116. Research Programs/Design for This Report
Table 117. Key Data Information from Secondary Sources
Table 118. Key Data Information from Primary Sources
List of Figures
Figure 1. Global Machine Vision Market Share by Type: 2021 VS 2028
Figure 2. Hardware (Camera, Frame Grabber, Optics, Processor) Features
Figure 3. Software (Deep Learning and Application Specific) Features
Figure 4. Global Machine Vision Market Share by Application: 2021 VS 2028
Figure 5. Semiconductor Industry Case Studies
Figure 6. Food Industry Case Studies
Figure 7. Logistics Case Studies
Figure 8. Agricultural Case Studies
Figure 9. Other Case Studies
Figure 10. Machine Vision Report Years Considered
Figure 11. Global Machine Vision Market Size (US$ Million), Year-over-Year: 2017-2028
Figure 12. Global Machine Vision Market Size, (US$ Million), 2017 VS 2021 VS 2028
Figure 13. Global Machine Vision Market Share by Region: 2021 VS 2028
Figure 14. Global Machine Vision Market Share by Players in 2021
Figure 15. Global Top Machine Vision Players by Company Type (Tier 1, Tier 2, and Tier 3) & (based on the Revenue in Machine Vision as of 2021)
Figure 16. The Top 10 and 5 Players Market Share by Machine Vision Revenue in 2021
Figure 17. North America Machine Vision Market Size YoY (2017-2028) & (US$ Million)
Figure 18. North America Machine Vision Market Size Market Share by Type (2017-2028)
Figure 19. North America Machine Vision Market Size Market Share by Application (2017-2028)
Figure 20. North America Machine Vision Market Size Share by Country (2017-2028)
Figure 21. United States Machine Vision Market Size YoY Growth (2017-2028) & (US$ Million)
Figure 22. Canada Machine Vision Market Size YoY Growth (2017-2028) & (US$ Million)
Figure 23. Europe Machine Vision Market Size YoY (2017-2028) & (US$ Million)
Figure 24. Europe Machine Vision Market Size Market Share by Type (2017-2028)
Figure 25. Europe Machine Vision Market Size Market Share by Application (2017-2028)
Figure 26. Europe Machine Vision Market Size Share by Country (2017-2028)
Figure 27. Germany Machine Vision Market Size YoY Growth (2017-2028) & (US$ Million)
Figure 28. France Machine Vision Market Size YoY Growth (2017-2028) & (US$ Million)
Figure 29. U.K. Machine Vision Market Size YoY Growth (2017-2028) & (US$ Million)
Figure 30. Italy Machine Vision Market Size YoY Growth (2017-2028) & (US$ Million)
Figure 31. Russia Machine Vision Market Size YoY Growth (2017-2028) & (US$ Million)
Figure 32. Nordic Countries Machine Vision Market Size YoY Growth (2017-2028) & (US$ Million)
Figure 33. Asia-Pacific Machine Vision Market Size YoY (2017-2028) & (US$ Million)
Figure 34. Asia Pacific Machine Vision Market Size Market Share by Type (2017-2028)
Figure 35. Asia Pacific Machine Vision Market Size Market Share by Application (2017-2028)
Figure 36. Asia Pacific Machine Vision Market Size Share by Region (2017-2028)
Figure 37. China Machine Vision Market Size YoY Growth (2017-2028) & (US$ Million)
Figure 38. Japan Machine Vision Market Size YoY Growth (2017-2028) & (US$ Million)
Figure 39. South Korea Machine Vision Market Size YoY Growth (2017-2028) & (US$ Million)
Figure 40. Southeast Asia Machine Vision Market Size YoY Growth (2017-2028) & (US$ Million)
Figure 41. India Machine Vision Market Size YoY Growth (2017-2028) & (US$ Million)
Figure 42. Australia Machine Vision Market Size YoY Growth (2017-2028) & (US$ Million)
Figure 43. Latin America Machine Vision Market Size YoY (2017-2028) & (US$ Million)
Figure 44. Latin America Machine Vision Market Size Market Share by Type (2017-2028)
Figure 45. Latin America Machine Vision Market Size Market Share by Application (2017-2028)
Figure 46. Latin America Machine Vision Market Size Share by Country (2017-2028)
Figure 47. Mexico Machine Vision Market Size YoY Growth (2017-2028) & (US$ Million)
Figure 48. Brazil Machine Vision Market Size YoY Growth (2017-2028) & (US$ Million)
Figure 49. Middle East & Africa Machine Vision Market Size YoY (2017-2028) & (US$ Million)
Figure 50. Middle East and Africa Machine Vision Market Size Market Share by Type (2017-2028)
Figure 51. Middle East and Africa Machine Vision Market Size Market Share by Application (2017-2028)
Figure 52. Middle East and Africa Machine Vision Market Size Share by Country (2017-2028)
Figure 53. Turkey Machine Vision Market Size YoY Growth (2017-2028) & (US$ Million)
Figure 54. Saudi Arabia Machine Vision Market Size YoY Growth (2017-2028) & (US$ Million)
Figure 55. UAE Machine Vision Market Size YoY Growth (2017-2028) & (US$ Million)
Figure 56. Cognex Revenue Growth Rate in Machine Vision Business (2017-2022)
Figure 57. Basler Revenue Growth Rate in Machine Vision Business (2017-2022)
Figure 58. Omron Revenue Growth Rate in Machine Vision Business (2017-2022)
Figure 59. National Instruments Revenue Growth Rate in Machine Vision Business (2017-2022)
Figure 60. Keyence Revenue Growth Rate in Machine Vision Business (2017-2022)
Figure 61. Sony Revenue Growth Rate in Machine Vision Business (2017-2022)
Figure 62. Teledyne Technologies Revenue Growth Rate in Machine Vision Business (2017-2022)
Figure 63. Texas Instruments Revenue Growth Rate in Machine Vision Business (2017-2022)
Figure 64. Allied Vision Technologies Revenue Growth Rate in Machine Vision Business (2017-2022)
Figure 65. Intel Revenue Growth Rate in Machine Vision Business (2017-2022)
Figure 66. Baumer Optronic Revenue Growth Rate in Machine Vision Business (2017-2022)
Figure 67. Bottom-up and Top-down Approaches for This Report
Figure 68. Data Triangulation
Figure 69. Key Executives Interviewed
$4900
$9800
HAVE A QUERY?
OUR CUSTOMER

SIMILAR REPORTS
Add to Cart
Add to Cart
Add to Cart
Add to Cart