List of Tables
Table 1. Global Market K-12 Education Market Size (US$ Million) Comparison by Region 2018 VS 2022 VS 2029
Table 2. Global K-12 Education Market Size by Region (2018-2023) & (US$ Million)
Table 3. Global K-12 Education Market Size Share by Region (2018-2023)
Table 4. Global K-12 Education Forecasted Market Size by Region (2024-2029) & (US$ Million)
Table 5. Global K-12 Education Forecasted Market Size Share by Region (2024-2029)
Table 6. Global K-12 Education Market Size (US$ Million) by Type: 2018 VS 2022 VS 2029
Table 7. Global K-12 Education Market Size by Type (2018-2023) & (US$ Million)
Table 8. Global K-12 Education Revenue Market Share by Type (2018-2023)
Table 9. Global K-12 Education Forecasted Market Size by Type (2024-2029) & (US$ Million)
Table 10. Global K-12 Education Revenue Market Share by Type (2024-2029)
Table 11. North America K-12 Education Revenue by Type (2018-2023) & (US$ Million)
Table 12. North America K-12 Education Revenue by Type (2024-2029) & (US$ Million)
Table 13. Europe K-12 Education Revenue by Type (2018-2023) & (US$ Million)
Table 14. Europe K-12 Education Revenue by Type (2024-2029) & (US$ Million)
Table 15. Asia-Pacific K-12 Education Revenue by Type (2018-2023) & (US$ Million)
Table 16. Asia-Pacific K-12 Education Revenue by Type (2024-2029) & (US$ Million)
Table 17. Latin America K-12 Education Revenue by Type (2018-2023) & (US$ Million)
Table 18. Latin America K-12 Education Revenue by Type (2024-2029) & (US$ Million)
Table 19. Middle East and Africa K-12 Education Revenue by Type (2018-2023) & (US$ Million)
Table 20. Middle East and Africa K-12 Education Revenue by Type (2024-2029) & (US$ Million)
Table 21. Global K-12 Education Market Size (US$ Million) by Application: 2018 VS 2022 VS 2029
Table 22. Global K-12 Education Market Size by Application (2018-2023) & (US$ Million)
Table 23. Global K-12 Education Revenue Market Share by Application (2018-2023)
Table 24. Global K-12 Education Forecasted Market Size by Application (2024-2029) & (US$ Million)
Table 25. Global K-12 Education Revenue Market Share by Application (2024-2029)
Table 26. North America K-12 Education Revenue by Application (2018-2023) & (US$ Million)
Table 27. North America K-12 Education Revenue by Application (2024-2029) & (US$ Million)
Table 28. Europe K-12 Education Revenue by Application (2018-2023) & (US$ Million)
Table 29. Europe K-12 Education Revenue by Application (2024-2029) & (US$ Million)
Table 30. Asia-Pacific K-12 Education Revenue by Application (2018-2023) & (US$ Million)
Table 31. Asia-Pacific K-12 Education Revenue by Application (2024-2029) & (US$ Million)
Table 32. Latin America K-12 Education Revenue by Application (2018-2023) & (US$ Million)
Table 33. Latin America K-12 Education Revenue by Application (2024-2029) & (US$ Million)
Table 34. Middle East and Africa K-12 Education Revenue by Application (2018-2023) & (US$ Million)
Table 35. Middle East and Africa K-12 Education Revenue by Application (2024-2029) & (US$ Million)
Table 36. Global K-12 Education Revenue (US$ Million) by Players (2018-2023)
Table 37. Global K-12 Education Revenue Market Share by Players (2018-2023)
Table 38. Global Top Players Market Share by Company Type (Tier 1, Tier 2 and Tier 3) & (based on the Revenue in K-12 Education as of 2022)
Table 39. Date of Key Players Enter into K-12 Education Market
Table 40. Global K-12 Education Key Players Headquarters and Area Served
Table 41. K-12 Education Product Solution and Service
Table 42. Global K-12 Education Players Market Concentration Ratio (CR5 and HHI)
Table 43. Mergers & Acquisitions, Expansion Plans
Table 44. Chungdahm Learning Basic Information List
Table 45. Chungdahm Learning Description and Business Overview
Table 46. Chungdahm Learning K-12 Education Products, Services and Solutions
Table 47. Revenue (US$ Million) in K-12 Education Business of Chungdahm Learning (2018-2023)
Table 48. Chungdahm Learning Recent Developments
Table 49. Dell Basic Information List
Table 50. Dell Description and Business Overview
Table 51. Dell K-12 Education Products, Services and Solutions
Table 52. Revenue (US$ Million) in K-12 Education Business of Dell (2018-2023)
Table 53. Dell Recent Developments
Table 54. Educomp Solutions Basic Information List
Table 55. Educomp Solutions Description and Business Overview
Table 56. Educomp Solutions K-12 Education Products, Services and Solutions
Table 57. Revenue (US$ Million) in K-12 Education Business of Educomp Solutions (2018-2023)
Table 58. Educomp Solutions Recent Developments
Table 59. Next Education Basic Information List
Table 60. Next Education Description and Business Overview
Table 61. Next Education K-12 Education Products, Services and Solutions
Table 62. Revenue (US$ Million) in K-12 Education Business of Next Education (2018-2023)
Table 63. Next Education Recent Developments
Table 64. Samsung Basic Information List
Table 65. Samsung Description and Business Overview
Table 66. Samsung K-12 Education Products, Services and Solutions
Table 67. Revenue (US$ Million) in K-12 Education Business of Samsung (2018-2023)
Table 68. Samsung Recent Developments
Table 69. TAL Education Group Basic Information List
Table 70. TAL Education Group Description and Business Overview
Table 71. TAL Education Group K-12 Education Products, Services and Solutions
Table 72. Revenue (US$ Million) in K-12 Education Business of TAL Education Group (2018-2023)
Table 73. TAL Education Group Recent Developments
Table 74. Tata Class Edge Basic Information List
Table 75. Tata Class Edge Description and Business Overview
Table 76. Tata Class Edge K-12 Education Products, Services and Solutions
Table 77. Revenue (US$ Million) in K-12 Education Business of Tata Class Edge (2018-2023)
Table 78. Tata Class Edge Recent Developments
Table 79. Adobe Systems Basic Information List
Table 80. Adobe Systems Description and Business Overview
Table 81. Adobe Systems K-12 Education Products, Services and Solutions
Table 82. Revenue (US$ Million) in K-12 Education Business of Adobe Systems (2018-2023)
Table 83. Adobe Systems Recent Developments
Table 84. Blackboard Basic Information List
Table 85. Blackboard Description and Business Overview
Table 86. Blackboard K-12 Education Products, Services and Solutions
Table 87. Revenue (US$ Million) in K-12 Education Business of Blackboard (2018-2023)
Table 88. Blackboard Recent Developments
Table 89. BenQ Basic Information List
Table 90. BenQ Description and Business Overview
Table 91. BenQ K-12 Education Products, Services and Solutions
Table 92. Revenue (US$ Million) in K-12 Education Business of BenQ (2018-2023)
Table 93. BenQ Recent Developments
Table 94. Cengage Learning Basic Information List
Table 95. Cengage Learning Description and Business Overview
Table 96. Cengage Learning K-12 Education Products, Services and Solutions
Table 97. Revenue (US$ Million) in K-12 Education Business of Cengage Learning (2018-2023)
Table 98. Cengage Learning Recent Developments
Table 99. D2L Basic Information List
Table 100. D2L Description and Business Overview
Table 101. D2L K-12 Education Products, Services and Solutions
Table 102. Revenue (US$ Million) in K-12 Education Business of D2L (2018-2023)
Table 103. D2L Recent Developments
Table 104. Ellucian Basic Information List
Table 105. Ellucian Description and Business Overview
Table 106. Ellucian K-12 Education Products, Services and Solutions
Table 107. Revenue (US$ Million) in K-12 Education Business of Ellucian (2018-2023)
Table 108. Ellucian Recent Developments
Table 109. IBM Basic Information List
Table 110. IBM Description and Business Overview
Table 111. IBM K-12 Education Products, Services and Solutions
Table 112. Revenue (US$ Million) in K-12 Education Business of IBM (2018-2023)
Table 113. IBM Recent Developments
Table 114. Intel Basic Information List
Table 115. Intel Description and Business Overview
Table 116. Intel K-12 Education Products, Services and Solutions
Table 117. Revenue (US$ Million) in K-12 Education Business of Intel (2018-2023)
Table 118. Intel Recent Developments
Table 119. Knewton Basic Information List
Table 120. Knewton Description and Business Overview
Table 121. Knewton K-12 Education Products, Services and Solutions
Table 122. Revenue (US$ Million) in K-12 Education Business of Knewton (2018-2023)
Table 123. Knewton Recent Developments
Table 124. Mcmillan Learning Basic Information List
Table 125. Mcmillan Learning Description and Business Overview
Table 126. Mcmillan Learning K-12 Education Products, Services and Solutions
Table 127. Revenue (US$ Million) in K-12 Education Business of Mcmillan Learning (2018-2023)
Table 128. Mcmillan Learning Recent Developments
Table 129. McGraw-Hill Education Basic Information List
Table 130. McGraw-Hill Education Description and Business Overview
Table 131. McGraw-Hill Education K-12 Education Products, Services and Solutions
Table 132. Revenue (US$ Million) in K-12 Education Business of McGraw-Hill Education (2018-2023)
Table 133. McGraw-Hill Education Recent Developments
Table 134. Microsoft Basic Information List
Table 135. Microsoft Description and Business Overview
Table 136. Microsoft K-12 Education Products, Services and Solutions
Table 137. Revenue (US$ Million) in K-12 Education Business of Microsoft (2018-2023)
Table 138. Microsoft Recent Developments
Table 139. Oracle Basic Information List
Table 140. Oracle Description and Business Overview
Table 141. Oracle K-12 Education Products, Services and Solutions
Table 142. Revenue (US$ Million) in K-12 Education Business of Oracle (2018-2023)
Table 143. Oracle Recent Developments
Table 144. Pearson Education Basic Information List
Table 145. Pearson Education Description and Business Overview
Table 146. Pearson Education K-12 Education Products, Services and Solutions
Table 147. Revenue (US$ Million) in K-12 Education Business of Pearson Education (2018-2023)
Table 148. Pearson Education Recent Developments
Table 149. Promethean World Basic Information List
Table 150. Promethean World Description and Business Overview
Table 151. Promethean World K-12 Education Products, Services and Solutions
Table 152. Revenue (US$ Million) in K-12 Education Business of Promethean World (2018-2023)
Table 153. Promethean World Recent Developments
Table 154. Saba Software Basic Information List
Table 155. Saba Software Description and Business Overview
Table 156. Saba Software K-12 Education Products, Services and Solutions
Table 157. Revenue (US$ Million) in K-12 Education Business of Saba Software (2018-2023)
Table 158. Saba Software Recent Developments
Table 159. Smart Technologies Basic Information List
Table 160. Smart Technologies Description and Business Overview
Table 161. Smart Technologies K-12 Education Products, Services and Solutions
Table 162. Revenue (US$ Million) in K-12 Education Business of Smart Technologies (2018-2023)
Table 163. Smart Technologies Recent Developments
Table 164. North America K-12 Education Market Size by Country (2018-2023) & (US$ Million)
Table 165. North America K-12 Education Market Size by Country (2024-2029) & (US$ Million)
Table 166. Europe K-12 Education Market Size by Country (2018-2023) & (US$ Million)
Table 167. Europe K-12 Education Market Size by Country (2024-2029) & (US$ Million)
Table 168. Asia-Pacific K-12 Education Market Size Growth Rate (CAGR) by Region (US$ Million): 2018 VS 2022 VS 2029
Table 169. Asia-Pacific K-12 Education Market Size by Region (2018-2023) & (US$ Million)
Table 170. Asia-Pacific K-12 Education Market Size by Region (2024-2029) & (US$ Million)
Table 171. Asia-Pacific K-12 Education Market Share by Region (2018-2023)
Table 172. Asia-Pacific K-12 Education Market Share by Region (2024-2029)
Table 173. Latin America K-12 Education Market Size Growth Rate (CAGR) by Region (US$ Million): 2018 VS 2022 VS 2029
Table 174. Latin America K-12 Education Market Size by Country (2018-2023) & (US$ Million)
Table 175. Latin America K-12 Education Market Size by Country (2024-2029) & (US$ Million)
Table 176. Middle East & Africa K-12 Education Market Size Growth Rate (CAGR) by Region (US$ Million): 2018 VS 2022 VS 2029
Table 177. Middle East & Africa K-12 Education Market Size by Country (2018-2023) & (US$ Million)
Table 178. Middle East & Africa K-12 Education Market Size by Country (2024-2029) & (US$ Million)
Table 179. K-12 Education Market Trends
Table 180. K-12 Education Market Drivers
Table 181. K-12 Education Market Challenges
Table 182. K-12 Education Market Restraints
Table 183. Research Programs/Design for This Report
Table 184. Key Data Information from Secondary Sources
Table 185. Key Data Information from Primary Sources
List of Figures
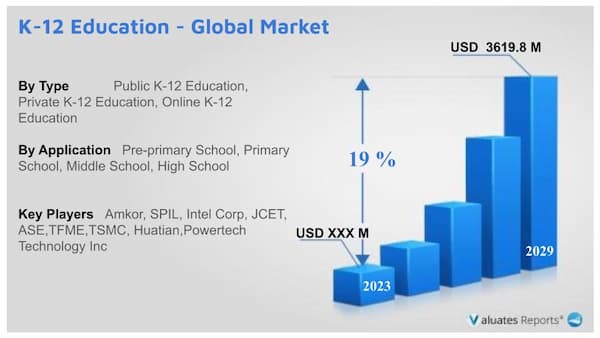
Figure 1. Global K-12 Education Market Size Year-over-Year 2018-2029 & (US$ Million)
Figure 2. Global K-12 Education Market Size (US$ Million), 2018 VS 2022 VS 2029
Figure 3. Global K-12 Education Market Share by Regions: 2022 VS 2029
Figure 4. Global K-12 Education Forecasted Market Size Share by Region (2024-2029)
Figure 5. North America K-12 Education Market Size Growth Rate (2018-2029) & (US$ Million)
Figure 6. Europe K-12 Education Market Size Growth Rate (2018-2029) & (US$ Million)
Figure 7. Asia-Pacific K-12 Education Market Size Growth Rate (2018-2029) & (US$ Million)
Figure 8. Latin America K-12 Education Market Size Growth Rate (2018-2029) & (US$ Million)
Figure 9. Middle East & Africa K-12 Education Market Size Growth Rate (2018-2029) & (US$ Million)
Figure 10. Product Picture of Public K-12 Education
Figure 11. Global Public K-12 Education Market Size (US$ Million) & YoY Growth (2018-2029)
Figure 12. Product Picture of Private K-12 Education
Figure 13. Global Private K-12 Education Market Size (US$ Million) & YoY Growth (2018-2029)
Figure 14. Product Picture of Online K-12 Education
Figure 15. Global Online K-12 Education Market Size (US$ Million) & YoY Growth (2018-2029)
Figure 16. Global K-12 Education Market Size Share by Type: 2022 & 2029
Figure 17. North America K-12 Education Revenue Market Share by Type (2018-2029)
Figure 18. Europe K-12 Education Revenue Market Share by Type (2018-2029)
Figure 19. Asia-Pacific K-12 Education Revenue Market Share by Type (2018-2029)
Figure 20. Latin America K-12 Education Revenue Market Share by Type (2018-2029)
Figure 21. Middle East and Africa K-12 Education Revenue Market Share by Type (2018-2029)
Figure 22. Pre-primary School Market Size (US$ Million) & YoY Growth (2018-2029)
Figure 23. Primary School Market Size (US$ Million) & YoY Growth (2018-2029)
Figure 24. Middle School Market Size (US$ Million) & YoY Growth (2018-2029)
Figure 25. High School Market Size (US$ Million) & YoY Growth (2018-2029)
Figure 26. Global K-12 Education Market Size Share by Application: 2022 & 2029
Figure 27. North America K-12 Education Revenue Market Share by Application (2018-2029)
Figure 28. Europe K-12 Education Revenue Market Share by Application (2018-2029)
Figure 29. Asia-Pacific K-12 Education Revenue Market Share by Application (2018-2029)
Figure 30. Latin America K-12 Education Revenue Market Share by Application (2018-2029)
Figure 31. Middle East and Africa K-12 Education Revenue Market Share by Application (2018-2029)
Figure 32. K-12 Education Market Share by Company Type (Tier 1, Tier 2 and Tier 3): 2018 VS 2022
Figure 33. Global Top 5 and Top 10 Players K-12 Education Market Share in 2022
Figure 34. North America K-12 Education Market Share by Country (2018-2029)
Figure 35. U.S. K-12 Education Market Size (2018-2029) & (US$ Million)
Figure 36. Canada K-12 Education Market Size (2018-2029) & (US$ Million)
Figure 37. Germany K-12 Education Market Size (2018-2029) & (US$ Million)
Figure 38. France K-12 Education Market Size (2018-2029) & (US$ Million)
Figure 39. U.K. K-12 Education Market Size (2018-2029) & (US$ Million)
Figure 40. Italy K-12 Education Market Size (2018-2029) & (US$ Million)
Figure 41. Russia K-12 Education Market Size (2018-2029) & (US$ Million)
Figure 42. Nordic Countries K-12 Education Market Size (2018-2029) & (US$ Million)
Figure 43. Asia-Pacific K-12 Education Market Share by Region (2018-2029)
Figure 44. China K-12 Education Market Size (2018-2029) & (US$ Million)
Figure 45. Japan K-12 Education Market Size (2018-2029) & (US$ Million)
Figure 46. South Korea K-12 Education Market Size (2018-2029) & (US$ Million)
Figure 47. Southeast Asia K-12 Education Market Size (2018-2029) & (US$ Million)
Figure 48. India K-12 Education Market Size (2018-2029) & (US$ Million)
Figure 49. Australia K-12 Education Market Size (2018-2029) & (US$ Million)
Figure 50. Latin America K-12 Education Market Share by Country (2018-2029)
Figure 51. Mexico K-12 Education Market Size (2018-2029) & (US$ Million)
Figure 52. Brazil K-12 Education Market Size (2018-2029) & (US$ Million)
Figure 53. Middle East & Africa K-12 Education Market Share by Country (2018-2029)
Figure 54. Turkey K-12 Education Market Size (2018-2029) & (US$ Million)
Figure 55. Saudi Arabia K-12 Education Market Size (2018-2029) & (US$ Million)
Figure 56. UAE K-12 Education Market Size (2018-2029) & (US$ Million)
Figure 57. Bottom-up and Top-down Approaches for This Report