
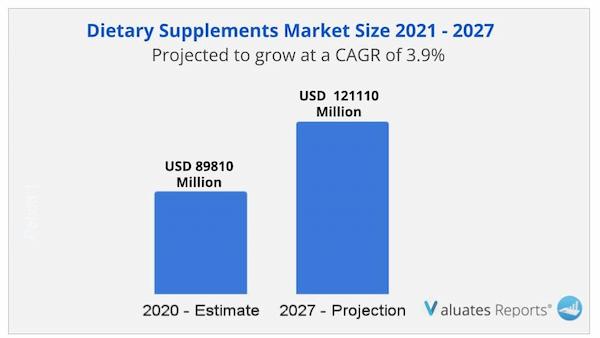
The global Dietary Supplements market size is projected to reach USD 121110 Million by 2027, from USD 89810 Million in 2020, at a CAGR of 3.9% during 2021-2027. Key drivers of the dietary supplements market include the rising health consciousness and demand for personalized supplements.
The increasing dependence on nutritional supplements for fulfilling daily nutrient requirements owing to their convenience will bolster the growth of the market in the coming years. The hectic work-life schedules of people and lack of time for meeting health needs will drive the growth of the market during the forecast period.
Health awareness
People around the world are adopting healthier lifestyles due to rising awareness regarding health and fitness. Personalized supplements are gaining popularity and key players are investing huge amounts of money to increase their production capacity. The trend of smart nutrition is gaining traction in the industry. The products are blended with personal health biomarkers from research findings on the exact needs of nutrition. Various health data are analyzed such as medical history, lab results, and wellness goals. This will augment the growth of the dietary supplements market in the forthcoming years. A precise formulation is prepared based on the dosage, and availability. This ensures that particular nutrition gaps are fulfilled effectively. Instead of taking guesses the necessary multivitamin supplements cover all the bases and prevent nutrient deficiency. They are usually more safer and effective. The risks of taking excess amounts of supplements are avoided. Companies consider the natural diet and provide personalized recommendations so that they are absorbed better.
The convenient factor
Dietary supplements contain healthier amounts of essential amino acids, herbals, probiotics, botanicals, and animal extracts. It is extremely beneficial for people who suffer from certain health conditions or follow a diet that lacks specific nutrients. The pills or tablets are easy to use and very convenient. This will surge the growth of the dietary supplements market in the forthcoming years. For instance, a multivitamin tablet will provide all the necessary micronutrients that our body needs. These supplements also help in regulating good HDL cholesterol levels. Moreover tighter FDA regulations and several initiatives taken by government regulatory bodies for ensuring high quality and reliable production have sparked consumers' interest in the supplements industry.
Hectic work schedules
Rapid industrialization has led to people taking on hectic job roles. The adoption of sedentary lifestyles and the huge prevalence of chronic diseases such as diabetes, high blood pressure, and cancer have led to people looking for convenient, quick, and easily accessible solutions for fulfilling their daily nutritional requirements. This will spur the demand for the dietary supplements market in the forthcoming years. Consumers are inclined towards safe and preventative healthcare practices. The use of organic, green packaging labels and eco-friendly food additives is aiding the market expansion. Furthermore, the growing trend of sports and bodybuilding has led to higher adoption of supplements for boosting endurance and improving athletic performance.
share with 60% due to huge demand from working professionals and sports athletes for weight management and nutritional requirement. It is followed by minerals at a 10% share.
Based on form, the tablets segment will grow the highest in the dietary supplements market share with 60% due to features such as easy dosage, low cost, and longer shelf life along with convenient use followed by capsules with a share of 15%.
Based on application, the segmentations include food and beverage and healthcare products.
Based on region, North America will be the most lucrative during the forecast period due to increasing awareness of supplement consumption and rising demand for tablets that are high in nutrition and low on calories along with the presence of key players. .
High-impact rendering factors and drivers have been studied in this report to aid the readers to understand the general development. Moreover, the report includes restraints and challenges that may act as stumbling blocks on the way of the players. This will assist the users to be attentive and make informed decisions related to business. Specialists have also laid their focus on the upcoming business prospects.
The readers in the section will understand how the Dietary Supplements market scenario changed across the globe during the pandemic and post-pandemic. The study is done keeping in view the changes in aspects such as sales, demand, supply chain. The industry experts have also highlighted the key factors that will help create opportunities for players and stabilize the overall industry in the years to come.
Key segments including type, and application have been elaborated in this report. The consultants at QY Research have studied every segment and provided the market size using historical data. They have also talked about the growth opportunities that the segment may pose in the future. This study bestows sales and revenue data by type, and application during the historical period (2016-2021) and forecast period (2022-2027).
This section of the report provides key insights regarding various regions and the key players operating in each region. Economic, social, environmental, technological, and political factors have been taken into consideration while assessing the growth of the particular region/country. The readers will also get their hands on the revenue and sales data of each region and country for the period 2016-2027. This information derived through comprehensive research will help the reader to get familiar with the potential value of the investment in a particular region. North America, Europe, China and Japan are the major regions studied in the research report.
In this section, the readers will gain an understanding of the key players competing. The experts at QY Research have studied the key growth strategies, such as innovative trends and developments, intensification of product portfolio, mergers and acquisitions, collaborations, new product innovation, and geographical expansion, undertaken by these participants to maintain their presence. Apart from business strategies, the study includes current developments and key financials. The readers will also get access to the data related to global revenue, price, and sales by manufacturers for the period 2016-2021. This all-inclusive report will certainly serve the clients to stay updated and make effective decisions in their businesses. Some of the prominent
|
Report Metric |
Details |
|
Report Name |
Dietary Supplements Market |
|
Market size value in 2020 |
USD 89810 Million |
|
Revenue forecast in 2027 |
USD 121110 Million |
|
Growth Rate |
CAGR 3.9% |
|
Base year considered |
2020 |
|
Forecast Period |
2021-2027 |
|
By Type |
Botanicals, Vitamins, Minerals, Amino Acids, Probiotic |
|
By Application |
Health Care Products, Food & Beverages |
|
Report Coverage |
Revenue & volume forecast, company share, competitive landscape, growth factors, and trends |
|
Geographic regions covered |
North America, Europe, Asia Pacific, Latin America, Middle East & Africa |
Ans. The global Dietary Supplements market size is projected to reach USD 121110 Million by 2027, from USD 89810 Million in 2020, at a CAGR of 3.9% during 2021-2027.
Ans. Some of the major companies are Pfizer Pharmaceuticals, BASF, Amway Corporation, DSM, Herbalife International, ADM, Nestle, The Himalaya Drug Company, Yakult
Ans. Yes, the report includes a COVID-19 impact analysis. Also, it is further extended into every individual segment of the report.
1.1 Product Overview and Scope of Dietary Supplements
1.2 Dietary Supplements Segment by Type
1.2.1 Global Dietary Supplements Sales Growth Rate Comparison by Type (2021-2027)
1.2.2 Botanicals
1.2.3 Vitamins
1.2.4 Minerals
1.2.5 Amino Acids
1.2.6 Probiotic
1.2.7 Other
1.3 Dietary Supplements Segment by Application
1.3.1 Global Dietary Supplements Sales Comparison by Application: (2021-2027)
1.3.2 Food & Beverages
1.3.3 Health Care Products
1.3.4 Other
1.4 Global Dietary Supplements Market Size Estimates and Forecasts
1.4.1 Global Dietary Supplements Revenue 2016-2027
1.4.2 Global Dietary Supplements Sales 2016-2027
1.4.3 Dietary Supplements Market Size by Region: 2016 Versus 2021 Versus 2027
2 Dietary Supplements Market Competition by Manufacturers
2.1 Global Dietary Supplements Sales Market Share by Manufacturers (2016-2021)
2.2 Global Dietary Supplements Revenue Market Share by Manufacturers (2016-2021)
2.3 Global Dietary Supplements Average Price by Manufacturers (2016-2021)
2.4 Manufacturers Dietary Supplements Manufacturing Sites, Area Served, Product Type
2.5 Dietary Supplements Market Competitive Situation and Trends
2.5.1 Dietary Supplements Market Concentration Rate
2.5.2 The Global Top 5 and Top 10 Largest Dietary Supplements Players Market Share by Revenue
2.5.3 Global Dietary Supplements Market Share by Company Type (Tier 1, Tier 2 and Tier 3)
2.6 Manufacturers Mergers & Acquisitions, Expansion Plans
3 Dietary Supplements Retrospective Market Scenario by Region
3.1 Global Dietary Supplements Retrospective Market Scenario in Sales by Region: 2016-2021
3.2 Global Dietary Supplements Retrospective Market Scenario in Revenue by Region: 2016-2021
3.3 North America Dietary Supplements Market Facts & Figures by Country
3.3.1 North America Dietary Supplements Sales by Country
3.3.2 North America Dietary Supplements Revenue by Country
3.3.3 U.S.
3.3.4 Canada
3.4 Europe Dietary Supplements Market Facts & Figures by Country
3.4.1 Europe Dietary Supplements Sales by Country
3.4.2 Europe Dietary Supplements Revenue by Country
3.4.3 Germany
3.4.4 France
3.4.5 U.K.
3.4.6 Italy
3.4.7 Russia
3.5 Asia Pacific Dietary Supplements Market Facts & Figures by Region
3.5.1 Asia Pacific Dietary Supplements Sales by Region
3.5.2 Asia Pacific Dietary Supplements Revenue by Region
3.5.3 China
3.5.4 Japan
3.5.5 South Korea
3.5.6 India
3.5.7 Australia
3.5.8 China Taiwan
3.5.9 Indonesia
3.5.10 Thailand
3.5.11 Malaysia
3.6 Latin America Dietary Supplements Market Facts & Figures by Country
3.6.1 Latin America Dietary Supplements Sales by Country
3.6.2 Latin America Dietary Supplements Revenue by Country
3.6.3 Mexico
3.6.4 Brazil
3.6.5 Argentina
3.7 Middle East and Africa Dietary Supplements Market Facts & Figures by Country
3.7.1 Middle East and Africa Dietary Supplements Sales by Country
3.7.2 Middle East and Africa Dietary Supplements Revenue by Country
3.7.3 Turkey
3.7.4 Saudi Arabia
3.7.5 UAE
4 Global Dietary Supplements Historic Market Analysis by Type
4.1 Global Dietary Supplements Sales Market Share by Type (2016-2021)
4.2 Global Dietary Supplements Revenue Market Share by Type (2016-2021)
4.3 Global Dietary Supplements Price by Type (2016-2021)
5 Global Dietary Supplements Historic Market Analysis by Application
5.1 Global Dietary Supplements Sales Market Share by Application (2016-2021)
5.2 Global Dietary Supplements Revenue Market Share by Application (2016-2021)
5.3 Global Dietary Supplements Price by Application (2016-2021)
6 Key Companies Profiled
6.1 Pfizer Pharmaceuticals
6.1.1 Pfizer Pharmaceuticals Corporation Information
6.1.2 Pfizer Pharmaceuticals Description and Business Overview
6.1.3 Pfizer Pharmaceuticals Dietary Supplements Sales, Revenue and Gross Margin (2016-2021)
6.1.4 Pfizer Pharmaceuticals Dietary Supplements Product Portfolio
6.1.5 Pfizer Pharmaceuticals Recent Developments/Updates
6.2 Amway Corporation
6.2.1 Amway Corporation Corporation Information
6.2.2 Amway Corporation Description and Business Overview
6.2.3 Amway Corporation Dietary Supplements Sales, Revenue and Gross Margin (2016-2021)
6.2.4 Amway Corporation Dietary Supplements Product Portfolio
6.2.5 Amway Corporation Recent Developments/Updates
6.3 Abbott Laboratories
6.3.1 Abbott Laboratories Corporation Information
6.3.2 Abbott Laboratories Description and Business Overview
6.3.3 Abbott Laboratories Dietary Supplements Sales, Revenue and Gross Margin (2016-2021)
6.3.4 Abbott Laboratories Dietary Supplements Product Portfolio
6.3.5 Abbott Laboratories Recent Developments/Updates
6.4 Herbalife International
6.4.1 Herbalife International Corporation Information
6.4.2 Herbalife International Description and Business Overview
6.4.3 Herbalife International Dietary Supplements Sales, Revenue and Gross Margin (2016-2021)
6.4.4 Herbalife International Dietary Supplements Product Portfolio
6.4.5 Herbalife International Recent Developments/Updates
6.5 ADM
6.5.1 ADM Corporation Information
6.5.2 ADM Description and Business Overview
6.5.3 ADM Dietary Supplements Sales, Revenue and Gross Margin (2016-2021)
6.5.4 ADM Dietary Supplements Product Portfolio
6.5.5 ADM Recent Developments/Updates
6.6 Nestle
6.6.1 Nestle Corporation Information
6.6.2 Nestle Description and Business Overview
6.6.3 Nestle Dietary Supplements Sales, Revenue and Gross Margin (2016-2021)
6.6.4 Nestle Dietary Supplements Product Portfolio
6.6.5 Nestle Recent Developments/Updates
6.7 DuPont
6.6.1 DuPont Corporation Information
6.6.2 DuPont Description and Business Overview
6.6.3 DuPont Dietary Supplements Sales, Revenue and Gross Margin (2016-2021)
6.4.4 DuPont Dietary Supplements Product Portfolio
6.7.5 DuPont Recent Developments/Updates
6.8 GlaxoSmithKline
6.8.1 GlaxoSmithKline Corporation Information
6.8.2 GlaxoSmithKline Description and Business Overview
6.8.3 GlaxoSmithKline Dietary Supplements Sales, Revenue and Gross Margin (2016-2021)
6.8.4 GlaxoSmithKline Dietary Supplements Product Portfolio
6.8.5 GlaxoSmithKline Recent Developments/Updates
6.9 Carlyle Group
6.9.1 Carlyle Group Corporation Information
6.9.2 Carlyle Group Description and Business Overview
6.9.3 Carlyle Group Dietary Supplements Sales, Revenue and Gross Margin (2016-2021)
6.9.4 Carlyle Group Dietary Supplements Product Portfolio
6.9.5 Carlyle Group Recent Developments/Updates
6.10 Danone
6.10.1 Danone Corporation Information
6.10.2 Danone Description and Business Overview
6.10.3 Danone Dietary Supplements Sales, Revenue and Gross Margin (2016-2021)
6.10.4 Danone Dietary Supplements Product Portfolio
6.10.5 Danone Recent Developments/Updates
6.11 Bayer HealthCare
6.11.1 Bayer HealthCare Corporation Information
6.11.2 Bayer HealthCare Dietary Supplements Description and Business Overview
6.11.3 Bayer HealthCare Dietary Supplements Sales, Revenue and Gross Margin (2016-2021)
6.11.4 Bayer HealthCare Dietary Supplements Product Portfolio
6.11.5 Bayer HealthCare Recent Developments/Updates
6.12 BASF
6.12.1 BASF Corporation Information
6.12.2 BASF Dietary Supplements Description and Business Overview
6.12.3 BASF Dietary Supplements Sales, Revenue and Gross Margin (2016-2021)
6.12.4 BASF Dietary Supplements Product Portfolio
6.12.5 BASF Recent Developments/Updates
6.13 Glanbia
6.13.1 Glanbia Corporation Information
6.13.2 Glanbia Dietary Supplements Description and Business Overview
6.13.3 Glanbia Dietary Supplements Sales, Revenue and Gross Margin (2016-2021)
6.13.4 Glanbia Dietary Supplements Product Portfolio
6.13.5 Glanbia Recent Developments/Updates
6.14 Yakult
6.14.1 Yakult Corporation Information
6.14.2 Yakult Dietary Supplements Description and Business Overview
6.14.3 Yakult Dietary Supplements Sales, Revenue and Gross Margin (2016-2021)
6.14.4 Yakult Dietary Supplements Product Portfolio
6.14.5 Yakult Recent Developments/Updates
6.15 DSM
6.15.1 DSM Corporation Information
6.15.2 DSM Dietary Supplements Description and Business Overview
6.15.3 DSM Dietary Supplements Sales, Revenue and Gross Margin (2016-2021)
6.15.4 DSM Dietary Supplements Product Portfolio
6.15.5 DSM Recent Developments/Updates
6.16 The Himalaya Drug Company
6.16.1 The Himalaya Drug Company Corporation Information
6.16.2 The Himalaya Drug Company Dietary Supplements Description and Business Overview
6.16.3 The Himalaya Drug Company Dietary Supplements Sales, Revenue and Gross Margin (2016-2021)
6.16.4 The Himalaya Drug Company Dietary Supplements Product Portfolio
6.16.5 The Himalaya Drug Company Recent Developments/Updates
7 Dietary Supplements Manufacturing Cost Analysis
7.1 Dietary Supplements Key Raw Materials Analysis
7.1.1 Key Raw Materials
7.1.2 Key Suppliers of Raw Materials
7.2 Proportion of Manufacturing Cost Structure
7.3 Manufacturing Process Analysis of Dietary Supplements
7.4 Dietary Supplements Industrial Chain Analysis
8 Marketing Channel, Distributors and Customers
8.1 Marketing Channel
8.2 Dietary Supplements Distributors List
8.3 Dietary Supplements Customers
9 Dietary Supplements Market Dynamics
9.1 Dietary Supplements Industry Trends
9.2 Dietary Supplements Growth Drivers
9.3 Dietary Supplements Market Challenges
9.4 Dietary Supplements Market Restraints
10 Global Market Forecast
10.1 Dietary Supplements Market Estimates and Projections by Type
10.1.1 Global Forecasted Sales of Dietary Supplements by Type (2022-2027)
10.1.2 Global Forecasted Revenue of Dietary Supplements by Type (2022-2027)
10.2 Dietary Supplements Market Estimates and Projections by Application
10.2.1 Global Forecasted Sales of Dietary Supplements by Application (2022-2027)
10.2.2 Global Forecasted Revenue of Dietary Supplements by Application (2022-2027)
10.3 Dietary Supplements Market Estimates and Projections by Region
10.3.1 Global Forecasted Sales of Dietary Supplements by Region (2022-2027)
10.3.2 Global Forecasted Revenue of Dietary Supplements by Region (2022-2027)
11 Research Finding and Conclusion
12 Methodology and Data Source
12.1 Methodology/Research Approach
12.1.1 Research Programs/Design
12.1.2 Market Size Estimation
12.1.3 Market Breakdown and Data Triangulation
12.2 Data Source
12.2.1 Secondary Sources
12.2.2 Primary Sources
12.3 Author List
12.4 Disclaimer
List of Tables
Table 1. Global Dietary Supplements Sales (MT) Growth Rate Comparison by Type (2021-2027)
Table 2. Global Dietary Supplements Sales (MT) Comparison by Application (2021-2027)
Table 3. Global Dietary Supplements Market Size by Region (US$ Million) (2016 VS 2021 VS 2027)
Table 4. Key Manufacturers Dietary Supplements Covered in This Study
Table 5. Global Dietary Supplements Sales (MT) of Key Manufacturers (2016-2021)
Table 6. Global Dietary Supplements Sales Market Share by Manufacturers (2016-2021)
Table 7. Global Dietary Supplements Revenue (US$ Million) by Manufacturers (2016-2021)
Table 8. Global Dietary Supplements Revenue Share by Manufacturers (2016-2021)
Table 9. Global Market Dietary Supplements Average Price (USD/MT) of Key Manufacturers (2016-2021)
Table 10. Manufacturers Dietary Supplements Manufacturing Sites and Area Served
Table 11. Manufacturers Dietary Supplements Product Type
Table 12. Global Manufacturers Market Concentration Ratio (CR5 and HHI)
Table 13. Global Dietary Supplements by Company Type (Tier 1, Tier 2 and Tier 3) (based on the Revenue in Dietary Supplements as of 2020)
Table 14. Manufacturers Mergers & Acquisitions, Expansion Plans
Table 15. Global Dietary Supplements Sales by Region (2016-2021) & (MT)
Table 16. Global Dietary Supplements Sales Market Share by Region (2016-2021)
Table 17. Global Dietary Supplements Revenue by Region (2016-2021) & (US$ Million)
Table 18. North America Dietary Supplements Sales by Country (2016-2021) & (MT)
Table 19. North America Dietary Supplements Sales Market Share by Country (2016-2021)
Table 20. North America Dietary Supplements Revenue by Country (2016-2021) & (US$ Million)
Table 21. North America Dietary Supplements Revenue Market Share by Country (2016-2021)
Table 22. Europe Dietary Supplements Sales by Country (2016-2021) & (MT)
Table 23. Europe Dietary Supplements Sales Market Share by Country (2016-2021)
Table 24. Europe Dietary Supplements Revenue by Country (2016-2021) & (US$ Million)
Table 25. Europe Dietary Supplements Revenue Market Share by Country (2016-2021)
Table 26. Asia Pacific Dietary Supplements Sales by Region (2016-2021) & (MT)
Table 27. Asia Pacific Dietary Supplements Sales Market Share by Region (2016-2021)
Table 28. Asia Pacific Dietary Supplements Revenue by Region (2016-2021) & (US$ Million)
Table 29. Asia Pacific Dietary Supplements Revenue Market Share by Region (2016-2021)
Table 30. Latin America Dietary Supplements Sales by Country (2016-2021) & (MT)
Table 31. Latin America Dietary Supplements Sales Market Share by Country (2016-2021)
Table 32. Latin America Dietary Supplements Revenue by Country (2016-2021) & (US$ Million)
Table 33. Latin America Dietary Supplements Revenue Market Share by Country (2016-2021)
Table 34. Middle East and Africa Dietary Supplements Sales by Country (2016-2021) & (MT)
Table 35. Middle East and Africa Dietary Supplements Sales Market Share by Country (2016-2021)
Table 36. Middle East and Africa Dietary Supplements Revenue by Country (2016-2021) & (US$ Million)
Table 37. Middle East and Africa Dietary Supplements Revenue Market Share by Country (2016-2021)
Table 38. Global Dietary Supplements Sales (MT) by Type (2016-2021)
Table 39. Global Dietary Supplements Sales Market Share by Type (2016-2021)
Table 40. Global Dietary Supplements Revenue (Million US$) by Type (2016-2021)
Table 41. Global Dietary Supplements Revenue Share by Type (2016-2021)
Table 42. Global Dietary Supplements Price (USD/MT) by Type (2016-2021)
Table 43. Global Dietary Supplements Sales (MT) by Application (2016-2021)
Table 44. Global Dietary Supplements Sales Market Share by Application (2016-2021)
Table 45. Global Dietary Supplements Revenue (Million US$) by Application (2016-2021)
Table 46. Global Dietary Supplements Revenue Share by Application (2016-2021)
Table 47. Global Dietary Supplements Price (USD/MT) by Application (2016-2021)
Table 48. Pfizer Pharmaceuticals Corporation Information
Table 49. Pfizer Pharmaceuticals Description and Business Overview
Table 50. Pfizer Pharmaceuticals Dietary Supplements Sales (MT), Revenue (Million US$), Price (USD/MT) and Gross Margin (2016-2021)
Table 51. Pfizer Pharmaceuticals Dietary Supplements Product
Table 52. Pfizer Pharmaceuticals Recent Developments/Updates
Table 53. Amway Corporation Corporation Information
Table 54. Amway Corporation Description and Business Overview
Table 55. Amway Corporation Dietary Supplements Sales (MT), Revenue (Million US$), Price (USD/MT) and Gross Margin (2016-2021)
Table 56. Amway Corporation Dietary Supplements Product
Table 57. Amway Corporation Recent Developments/Updates
Table 58. Abbott Laboratories Corporation Information
Table 59. Abbott Laboratories Description and Business Overview
Table 60. Abbott Laboratories Dietary Supplements Sales (MT), Revenue (Million US$), Price (USD/MT) and Gross Margin (2016-2021)
Table 61. Abbott Laboratories Dietary Supplements Product
Table 62. Abbott Laboratories Recent Developments/Updates
Table 63. Herbalife International Corporation Information
Table 64. Herbalife International Description and Business Overview
Table 65. Herbalife International Dietary Supplements Sales (MT), Revenue (Million US$), Price (USD/MT) and Gross Margin (2016-2021)
Table 66. Herbalife International Dietary Supplements Product
Table 67. Herbalife International Recent Developments/Updates
Table 68. ADM Corporation Information
Table 69. ADM Description and Business Overview
Table 70. ADM Dietary Supplements Sales (MT), Revenue (Million US$), Price (USD/MT) and Gross Margin (2016-2021)
Table 71. ADM Dietary Supplements Product
Table 72. ADM Recent Developments/Updates
Table 73. Nestle Corporation Information
Table 74. Nestle Description and Business Overview
Table 75. Nestle Dietary Supplements Sales (MT), Revenue (Million US$), Price (USD/MT) and Gross Margin (2016-2021)
Table 76. Nestle Dietary Supplements Product
Table 77. Nestle Recent Developments/Updates
Table 78. DuPont Corporation Information
Table 79. DuPont Description and Business Overview
Table 80. DuPont Dietary Supplements Sales (MT), Revenue (Million US$), Price (USD/MT) and Gross Margin (2016-2021)
Table 81. DuPont Dietary Supplements Product
Table 82. DuPont Recent Developments/Updates
Table 83. GlaxoSmithKline Corporation Information
Table 84. GlaxoSmithKline Description and Business Overview
Table 85. GlaxoSmithKline Dietary Supplements Sales (MT), Revenue (Million US$), Price (USD/MT) and Gross Margin (2016-2021)
Table 86. GlaxoSmithKline Dietary Supplements Product
Table 87. GlaxoSmithKline Recent Developments/Updates
Table 88. Carlyle Group Corporation Information
Table 89. Carlyle Group Description and Business Overview
Table 90. Carlyle Group Dietary Supplements Sales (MT), Revenue (Million US$), Price (USD/MT) and Gross Margin (2016-2021)
Table 91. Carlyle Group Dietary Supplements Product
Table 92. Carlyle Group Recent Developments/Updates
Table 93. Danone Corporation Information
Table 94. Danone Description and Business Overview
Table 95. Danone Dietary Supplements Sales (MT), Revenue (Million US$), Price (USD/MT) and Gross Margin (2016-2021)
Table 96. Danone Dietary Supplements Product
Table 97. Danone Recent Developments/Updates
Table 98. Bayer HealthCare Corporation Information
Table 99. Bayer HealthCare Description and Business Overview
Table 100. Bayer HealthCare Dietary Supplements Sales (MT), Revenue (Million US$), Price (USD/MT) and Gross Margin (2016-2021)
Table 101. Bayer HealthCare Dietary Supplements Product
Table 102. Bayer HealthCare Recent Developments/Updates
Table 103. BASF Corporation Information
Table 104. BASF Description and Business Overview
Table 105. BASF Dietary Supplements Sales (MT), Revenue (Million US$), Price (USD/MT) and Gross Margin (2016-2021)
Table 106. BASF Dietary Supplements Product
Table 107. BASF Recent Developments/Updates
Table 108. Glanbia Corporation Information
Table 109. Glanbia Description and Business Overview
Table 110. Glanbia Dietary Supplements Sales (MT), Revenue (Million US$), Price (USD/MT) and Gross Margin (2016-2021)
Table 111. Glanbia Dietary Supplements Product
Table 112. Glanbia Recent Developments/Updates
Table 113. Yakult Corporation Information
Table 114. Yakult Description and Business Overview
Table 115. Yakult Dietary Supplements Sales (MT), Revenue (Million US$), Price (USD/MT) and Gross Margin (2016-2021)
Table 116. Yakult Dietary Supplements Product
Table 117. Yakult Recent Developments/Updates
Table 118. DSM Corporation Information
Table 119. DSM Description and Business Overview
Table 120. DSM Dietary Supplements Sales (MT), Revenue (Million US$), Price (USD/MT) and Gross Margin (2016-2021)
Table 121. DSM Dietary Supplements Product
Table 122. DSM Recent Developments/Updates
Table 123. The Himalaya Drug Company Corporation Information
Table 124. The Himalaya Drug Company Description and Business Overview
Table 125. The Himalaya Drug Company Dietary Supplements Sales (MT), Revenue (Million US$), Price (USD/MT) and Gross Margin (2016-2021)
Table 126. The Himalaya Drug Company Dietary Supplements Product
Table 127. The Himalaya Drug Company Recent Developments/Updates
Table 128. Production Base and Market Concentration Rate of Raw Material
Table 129. Key Suppliers of Raw Materials
Table 130. Dietary Supplements Distributors List
Table 131. Dietary Supplements Customers List
Table 132. Dietary Supplements Market Trends
Table 133. Dietary Supplements Growth Drivers
Table 134. Dietary Supplements Market Challenges
Table 135. Dietary Supplements Market Restraints
Table 136. Global Dietary Supplements Sales Forecast by Type (2022-2027) & (MT)
Table 137. Global Dietary Supplements Sales Market Share Forecast by Type (2022-2027)
Table 138. Global Dietary Supplements Revenue Forecast by Type (2022-2027) & (US$ Million)
Table 139. Global Dietary Supplements Revenue Market Share Forecast by Type (2022-2027)
Table 140. Global Dietary Supplements Sales Forecast by Application (2022-2027) & (MT)
Table 141. Global Dietary Supplements Sales Market Share Forecast by Application (2022-2027)
Table 142. Global Dietary Supplements Revenue Forecast by Application (2022-2027) & (US$ Million)
Table 143. Global Dietary Supplements Revenue Market Share Forecast by Application (2022-2027)
Table 144. Global Dietary Supplements Sales Forecast by Region (2022-2027) & (MT)
Table 145. Global Dietary Supplements Sales Market Share Forecast by Region (2022-2027)
Table 146. Global Dietary Supplements Revenue Forecast by Region (2022-2027) & (US$ Million)
Table 147. Global Dietary Supplements Revenue Market Share Forecast by Region (2022-2027)
Table 148. Research Programs/Design for This Report
Table 149. Key Data Information from Secondary Sources
Table 150. Key Data Information from Primary Sources
List of Figures
Figure 1. Product Picture of Dietary Supplements
Figure 2. Global Dietary Supplements Market Share by Type in 2020 & 2027
Figure 3. Botanicals Product Picture
Figure 4. Vitamins Product Picture
Figure 5. Minerals Product Picture
Figure 6. Amino Acids Product Picture
Figure 7. Probiotic Product Picture
Figure 8. Other Product Picture
Figure 9. Global Dietary Supplements Market Share by Application in 2020 & 2027
Figure 10. Food & Beverages
Figure 11. Health Care Products
Figure 12. Other
Figure 13. Global Dietary Supplements Revenue, (US$ Million), 2016 VS 2021 VS 2027
Figure 14. Global Dietary Supplements Market Size 2016-2027 (US$ Million)
Figure 15. Global Dietary Supplements Sales 2016-2027 (MT)
Figure 16. Global Dietary Supplements Market Size Market Share by Region: 2016 VS 20210 VS 2027
Figure 17. Dietary Supplements Sales Share by Manufacturers in 2020
Figure 18. Global Dietary Supplements Revenue Share by Manufacturers in 2020
Figure 19. The Global 5 and 10 Largest Dietary Supplements Players: Market Share by Revenue in 2020
Figure 20. Dietary Supplements Market Share by Company Type (Tier 1, Tier 2 and Tier 3): 2016 VS 2021
Figure 21. Global Dietary Supplements Sales Market Share by Region (2016-2021)
Figure 22. Global Dietary Supplements Sales Market Share by Region in 2020
Figure 23. Global Dietary Supplements Revenue Market Share by Region (2016-2021)
Figure 24. Global Dietary Supplements Revenue Market Share by Region in 2020
Figure 25. U.S. Dietary Supplements Revenue Growth Rate (2016-2021) (US$ Million)
Figure 26. Canada Dietary Supplements Revenue Growth Rate (2016-2021) (US$ Million)
Figure 27. Germany Dietary Supplements Revenue Growth Rate (2016-2021) (US$ Million)
Figure 28. France Dietary Supplements Revenue Growth Rate (2016-2021) (US$ Million)
Figure 29. U.K. Dietary Supplements Revenue Growth Rate (2016-2021) (US$ Million)
Figure 30. Italy Dietary Supplements Revenue Growth Rate (2016-2021) (US$ Million)
Figure 31. Russia Dietary Supplements Revenue Growth Rate (2016-2021) (US$ Million)
Figure 32. China Dietary Supplements Revenue Growth Rate (2016-2021) (US$ Million)
Figure 33. Japan Dietary Supplements Revenue Growth Rate (2016-2021) (US$ Million)
Figure 34. South Korea Dietary Supplements Revenue Growth Rate (2016-2021) (US$ Million)
Figure 35. India Dietary Supplements Revenue Growth Rate (2016-2021) (US$ Million)
Figure 36. Australia Dietary Supplements Revenue Growth Rate (2016-2021) (US$ Million)
Figure 37. China Taiwan Dietary Supplements Revenue Growth Rate (2016-2021) (US$ Million)
Figure 38. Indonesia Dietary Supplements Revenue Growth Rate (2016-2021) (US$ Million)
Figure 39. Thailand Dietary Supplements Revenue Growth Rate (2016-2021) (US$ Million)
Figure 40. Malaysia Dietary Supplements Revenue Growth Rate (2016-2021) (US$ Million)
Figure 41. Mexico Dietary Supplements Revenue Growth Rate (2016-2021) (US$ Million)
Figure 42. Brazil Dietary Supplements Revenue Growth Rate (2016-2021) (US$ Million)
Figure 43. Argentina Dietary Supplements Revenue Growth Rate (2016-2021) (US$ Million)
Figure 44. Turkey Dietary Supplements Revenue Growth Rate (2016-2021) (US$ Million)
Figure 45. Saudi Arabia Dietary Supplements Revenue Growth Rate (2016-2021) (US$ Million)
Figure 46. UAE Dietary Supplements Revenue Growth Rate (2016-2021) (US$ Million)
Figure 47. Sales Market Share of Dietary Supplements by Type (2016-2021)
Figure 48. Sales Market Share of Dietary Supplements by Application (2016-2021)
Figure 49. Sales Market Share of Dietary Supplements by Application in 2020
Figure 50. Revenue Share of Dietary Supplements by Application (2016-2021)
Figure 51. Revenue Share of Dietary Supplements by Application in 2020
Figure 52. Manufacturing Cost Structure of Dietary Supplements
Figure 53. Manufacturing Process Analysis of Dietary Supplements
Figure 54. Dietary Supplements Industrial Chain Analysis
Figure 55. Channels of Distribution
Figure 56. Distributors Profiles
Figure 57. Bottom-up and Top-down Approaches for This Report
Figure 58. Data Triangulation
Figure 59. Key Executives Interviewed
$3280
$4920
$6560
HAVE A QUERY?
OUR CUSTOMER
