0
U.S. (TOLL FREE)
+1 (315) 215-3225
Automative

0
U.S. (TOLL FREE)
+1 (315) 215-3225
Cell Culture Market Size, Share, Statistics & Trends Analysis Report by Product, by Application, by End-User, by Region, and Segment Forecasts 2020 to 2027
Published Date: December 2020
|
Report Code: ALLI-Auto-1H413
Home | Market Reports | Business & Industrial| Pharmaceuticals & Biotech
Cell Culture Market by Product Instrument and Consumables Application Stem Cell Technology Cancer Research Drug Screening Development Tissue Engineering Regenerative Medicine and Others End User Research Institutes Pharmaceutical x Biotechnology Companies and Others Global Opportunity Analysis and Industry Forecast 2020 2027
BUY CHAPTERS

Cell Culture Market Size, Share, Statistics & Trends Analysis Report by Product, by Application, by End-User, by Region, and Segment Forecasts 2020 to 2027

Code: ALLI-Auto-1H413
Report
December 2020
Pages:229
Allied Market Research
Buy Now with 15% Discount
DESCRIPTION
TABLE OF CONTENT
TABLES & FIGURES

Cell Culture Market

The global cell culture market accounted for USD 16,107.7 million in 2019 and is expected to reach USD 36,926.8 million by 2027, registering a CAGR of 10.9% from 2020 to 2027.

Major Trends in Cell Culture Market 

Key drivers of the cell culture industry include the growing prevalence of chronic diseases and cancer fueling its rapid research using cell cultures. The rising investments in cell culture-based therapies will bolster the growth of the market in the coming years. The continuous technological advancements in cell culture study will drive the expansion of the cell culture industry.
 
cell culture market
 
Cell culture is a technique, which involves obtaining cells from animals or plants. These obtained cells are then subjected to artificial growth medium. Furthermore, the entire technique involves the use of tools, which are called as instruments. For instance, some of the instruments include bioreactors, cell culture vessels, and others. Moreover, bioreactors are used to carry out biological reaction, which is used to culture aerobic cells.
 

Cell Culture Market Trends

Cell culture techniques in cancer research

The severity of the cancer disease is a huge burden on the healthcare and pharmaceutical industry. As per the estimates of WHO cancer was the leading cause of death in 2020 accounting for approximately 10 million or one in six deaths. Hence government authorities are pumping up resources into biomedical research for understanding cancer cells and producing relevant anti-cancer drugs for efficient treatment. Cell culture methods are widely used by academicians to study tumor-containing cells. This will propel the growth of the cell culture industry in the forthcoming years. High throughput screening using cell-based arrays is usually the starting point for determining compounds in drug discovery programs. The research activities are slowly transitioning towards 3D cell structures using anchorage methodology or a substrate with attached cells. Many anti-cancer therapeutics have been developed based on tumor cells cultured in a 3D environment. The sensitivity to drugs or natural compounds provides a clear picture of the molecular activity inside the intracellular structures.

Cell culture-based therapies

The advent of omics technologies and metagenomics led to the establishment of cell line structures for detecting cellular mutations, alterations, and genetic variations. Particularly the extracellular vesicles hold significant potential for the treatment of a wide range of diseases and for introducing stem cell-based therapies into the market. This will surge the growth of the cell culture industry in the upcoming years. Several biological parameters are being researched such as functionalization, aggregates, organoids, etc. Then there is media composition optimization such as viscosity, osmolarity, and xeno-free compounds. The chemical and physical properties are also checked such as mechanical loading, pre-conditioning of cytokines, oxygen concentration, and feeding strategies.

Cell culture technologies

The advent of metagenomics has led to deep sequencing techniques that allow analyzing the genome of a microorganism without isolating the virus in cell culture. The huge throughput screening and amplified DNA sequencing aid in the final identification of the agent. The assigned primers increase the template for sequencing and the associated electron microscopy recognizes emerging diseases easily through laboratory diagnosis. Moreover, rapid detection of cell cultures is an effective method for readily using cell structures for time-sensitive cases. This will boost the growth of the global cell culture market in the subsequent years. Moreover, transgenic technology is being utilized. Stable genomic materials are mixed with the cells. Whenever any virus enters the cellular structure many virus-specific enzymes are created for quick measurement of the bacterial and viral origin structures. A more rapid version exists that does not require any medical expertise, is specific, and is very simple to use.

Cell Culture Market Segment Review

Based on product, the consumables segment will grow the highest in the cell culture market share due to repeated usage and rising funding in biomedical research.

cell culture market share

Based on end-user, the pharmaceutical and biotechnology companies segment will witness considerable growth in the cell culture market share due to the growing number of pharma companies and quick regulatory approvals for cell culture vaccines.

cell culture market end user

Cell Culture Market Size and Regional Analysis

In 2019, North America accounted for the major share of cell culture market size and is expected to continue this trend owing to surge in prevalence of cancer and rise in cancer related research. Furthermore, easy availability of cell culture instruments and consumables due to presence of majority of key players boost the growth of the market in the region. Moreover, other factors such as surge in health expenditure also boost the growth of the cell culture market in North America.

However, Asia-Pacific is expected to exhibit fastest growth rate owing to surge in awareness related to use of cell culture technique, development of the R&D sector and surge in research funding. Furthermore, focus of leading manufacturers on expanding their geographical presence in emerging Asia-Pacific countries to capture high market share is expected to drive the growth of the cell culture market in the region.  
 
cell culture market region
 
Major players operating in the market include, Becton, Dickinson and Company, Corning Incorporated, Eppendorf, Sartorius AG, Merck KGaA, Lonza Group AG, PromoCell GmbH, Danaher Corporation, Thermo Fisher Scientific, and HiMedia Laboratories.

Key Benefits for Stakeholders

  • The study provides an in-depth analysis of the market along with the current trends and future estimations to elucidate the imminent investment pockets.
  • It offers a quantitative analysis from 2019 to 2027, which is expected to enable the stakeholders to capitalize on the prevailing market opportunities.
  • A comprehensive analysis of major regions is provided to determine the existing opportunities.
  • The profiles and growth strategies of the key players are thoroughly analyzed to understand the competitive outlook of the global market.

Cell Culture Market Segments

By Product
  • Consumables
    • Sera
    • Media
    • Reagents
    • Bioreactor Accessories
  • Instruments
    • Bioreactors
    • Cell Culture Vessels
    • Cell Culture Storage Equipment
    • Cell Culture Supporting Instruments
By Application
  • Stem Cell Technology
  • Cancer Research
  • Drug Screening and Development
  • Tissue Engineering & Regenerative Medicine
  • Others
By End User
  • Research Institutes
  • Pharmaceutical & Biotechnology Companies
  • Others
By Region
  • North America
    • U.S.
    • Canada
    • Mexico
  • Europe
    • Germany
    • France
    • UK
    • Italy
    • Spain
    • Rest of Europe
  • Asia-Pacific
    • China
    • Japan
    • India
    • Australia
    • South Korea
    • Rest of Asia-Pacific
  • LAMEA
    • Brazil
    • Saudi Arabia
    • South Africa
    • Rest of LAMEA

Major Key Players in the Cell Culture Market

  • Becton, Dickinson and Company
  • Corning Incorporated
  • Eppendorf
  • Sartorius AG
  • Merck KGaA
  • Lonza Group AG
  • PromoCell GmbH
  • Danaher Corporation
  • Thermo Fisher Scientific
  • HiMedia Laboratories.

List of Other Players in the Value Chain

These players are not profiled in the report. The same will be included on request.
  • Agilent
  • Eppendorf AG

Scope of Cell Culture Market Report

Report Metric Details
Report Name Cell Culture Market
The market size in 2020 USD 40.19 Billion
The revenue forecast in 2030 USD 195.42 Billion 
Growth Rate CAGR 17.4%
Market size available for years 2020-2030
Forecast units Value (USD)
Segments covered Type, Application, Industry, Regions
Report coverage Revenue & volume forecast, company share, competitive landscape, growth factors, and trends
Geographic regions covered North America, Europe, Asia Pacific, Latin America, Middle East & Africa

Frequently Asked Questions About This Report

1. What is the global market size of the cell culture market report?

Ans. The global cell culture market size accounted for 16107.7 million in 2019 and is expected to reach 36926.8 million by 2027 registering a CAGR of 10.9 from 2020 to 2027.

2. Who are the key players in the cell culture market?

Ans. Some of the key players are Becton, Dickinson and Company, Corning Incorporated, Eppendorf, Sartorius AG, Merck KGaA, Lonza Group AG, PromoCell GmbH, Danaher Corporation, Thermo Fisher Scientific, and HiMedia Laboratories

3. What are the key trends in the cell culture market report?

Ans. The major factor for the growth of cell culture market are contribute toward the growth of the cell culture market include surge in prevalence of cancer and rise in adoption of cell culture technique. Furthermore, factors such as surge in awareness related to use of cell culture technique in research and increase in research related funding

4. Which is the most influencing segment growing in the cell culture market report?

Ans. The consumables segment dominates the global market, and is anticipated to continue this trend during the forecast period. the growth of this segment is attributed to the repeated purchase of consumables and increased funding for cell-based research

5. Which is the base year calculated in the cell culture market report?

Ans. The base year is 2019 in cell culture market.

6. What would be the forecast period in the market report?

Ans. The forecast period for cell culture market is 2020 to 2027

Table of Content
 
 
CHAPTER 1:INTRODUCTION
1.1.Report description
1.2.Key market segments
1.2.1.List of key players profiled in the report
1.3.Research methodology
1.3.1.Primary research
1.3.2.Secondary research
1.3.3.Analyst tools and models
CHAPTER 2:EXECUTIVE SUMMARY
2.1.Key findings of the study
2.2.CXO perspective
CHAPTER 3:MARKET OVERVIEW
3.1.Market definition and scope
3.1.1.Top investment pockets
3.1.2.Top winning strategies
3.2.Key forces shaping veterinary medicines industry/Market
3.3.Market share analysis
3.4.Market dynamics
3.4.1.Drivers
3.4.1.1.Prevalence of cancer
3.4.1.2.Increase in adoption of cell culture technique
3.4.1.3.Increase in research funding
3.4.2.Restraints
3.4.2.1.High capital investment
3.4.2.2.Lack of infrastructure for cell-based research
3.4.3.Opportunity
3.4.3.1.Expected rise in demand for advanced technologies
3.4.4.Impact Analyses
3.5.Impact Analysis of COVID-19 on Cell Culture Market
CHAPTER 4:CELL CULTURE MARKET, BY PRODUCT
4.1.Overview
4.1.1.Market size and forecast
4.2.Instrument
4.2.1.Key findings and opportunity
4.2.2.Market size and forecast, by region
4.2.3.Market analysis by country
4.2.3.1.Bioreactors
4.2.3.2.Cell Culture Vessels
4.2.3.3.Cell Culture Storage Equipment
4.2.3.4.Cell Culture Supporting Instruments
4.3.Consumables
4.3.1.Key findings and opportunity
4.3.2.Market size and forecast, by region
4.3.3.Market analysis by country
4.3.3.1.Sera
4.3.3.2.Media
4.3.3.3.Reagents
4.3.3.4.Bioreactor Accessories
CHAPTER 5:CELL CULTURE MARKET, BY APPLICATION
5.1.Overview
5.1.1.Market size and forecast
5.2.Stem Cell Technology
5.2.1.Market size and forecast, by region
5.2.2.Market analysis by country
5.3.Cancer Research
5.3.1.Market size and forecast, by region
5.3.2.Market analysis by country
5.4.Drug Screening & Development
5.4.1.Market size and forecast, by region
5.4.2.Market analysis by country
5.5.Tissue Engineering & Regenerative Medicine
5.5.1.Market size and forecast, by region
5.5.2.Market analysis by country
5.6.Others
5.6.1.Market size and forecast, by region
5.6.2.Market analysis by country
CHAPTER 6:CELL CULTURE MARKET, BY END USER
6.1.Overview
6.1.1.Market size and forecast
6.2.Research Institutes
6.2.1.Market size and forecast, by region
6.2.2.Market analysis by country
6.3.Pharmaceutical & Biotechnology Companies
6.3.1.Market size and forecast, by region
6.3.2.Market analysis by country
6.4.Others
6.4.1.Market size and forecast, by region
6.4.2.Market analysis by country
CHAPTER 7:CELL CULTURE MARKET, BY REGION
7.1.Overview
7.1.1.Market size and forecast
7.2.North America
7.2.1.Key market trends and opportunities
7.2.2.North America cell culture market, by country
7.2.2.1.U.S. cell culture market, by product type
7.2.2.2.U.S. cell culture market, by application
7.2.2.3.U.S. cell culture market, by end user
7.2.2.4.Canada cell culture market, by product type
7.2.2.5.Canada cell culture market, by application
7.2.2.6.Canada cell culture market, by end user
7.2.2.7.Mexico cell culture market, by product type
7.2.2.8.Mexico cell culture market, by application
7.2.2.9.Mexico cell culture market, by end user
7.2.3.North America cell culture market, by product type
7.2.4.North America cell culture market, by application
7.2.5.North America cell culture market, by end user
7.3.Europe
7.3.1.Key market trends and opportunities
7.3.2.Europe cell culture market, by country
7.3.2.1.Germany cell culture market, by product type
7.3.2.2.Germany cell culture market, by application
7.3.2.3.Germany cell culture market, by end user
7.3.2.4.France cell culture market, by product type
7.3.2.5.France cell culture market, by application
7.3.2.6.France cell culture market, by end user
7.3.2.7.UK cell culture market, by product type
7.3.2.8.UK cell culture market, by application
7.3.2.9.UK cell culture market, by end user
7.3.2.10.Italy cell culture market, by product type
7.3.2.11.Italy cell culture market, by application
7.3.2.12.Italy cell culture market, by end user
7.3.2.13.Spain cell culture market, by product type
7.3.2.14.Spain cell culture market, by application
7.3.2.15.Spain cell culture market, by end user
7.3.2.16.Rest of Europe cell culture market, by product type
7.3.2.17.Rest of Europe cell culture market, by application
7.3.2.18.Rest of Europe cell culture market, by end user
7.3.3.Europe cell culture market, by product type
7.3.4.Europe cell culture market, by application
7.3.5.Europe cell culture market, by end user
7.4.Asia-Pacific
7.4.1.Key market trends and opportunities
7.4.2.Asia-Pacific cell culture market, by country
7.4.2.1.China cell culture market, by product type
7.4.2.2.China cell culture market, by application
7.4.2.3.China cell culture market, by end user
7.4.2.4.Japan cell culture market, by product type
7.4.2.5.Japan cell culture market, by application
7.4.2.6.Japan cell culture market, by end user
7.4.2.7.Australia cell culture market, by product type
7.4.2.8.Australia cell culture market, by application
7.4.2.9.Australia cell culture market, by end user
7.4.2.10.India cell culture market, by product type
7.4.2.11.India cell culture market, by application
7.4.2.12.India cell culture market, by end user
7.4.2.13.South Korea cell culture market, by product type
7.4.2.14.South Korea cell culture market, by application
7.4.2.15.South Korea cell culture market, by end user
7.4.2.16.Rest of Asia-Pacific cell culture market, by product type
7.4.2.17.Rest of Asia-Pacific cell culture market, by application
7.4.2.18.Rest of Asia-Pacific cell culture market, by end user
7.4.3.Asia-Pacific cell culture market, by product type
7.4.4.Asia-Pacific cell culture market, by application
7.4.5.Asia-Pacific cell culture market, by end user
7.5.LAMEA
7.5.1.Key market trends and opportunities
7.5.2.LAMEA cell culture market, by country
7.5.2.1.Brazil cell culture market, by product type
7.5.2.2.Brazil cell culture market, by application
7.5.2.3.Brazil cell culture market, by end user
7.5.2.4.Saudi Arabia cell culture market, by product type
7.5.2.5.Saudi Arabia cell culture market, by application
7.5.2.6.Saudi Arabia cell culture market, by end user
7.5.2.7.South Africa cell culture market, by product type
7.5.2.8.South Africa cell culture market, by application
7.5.2.9.South Africa cell culture market, by end user
7.5.2.10.Rest of LAMEA cell culture market, by product type
7.5.2.11.Rest of LAMEA cell culture market, by application
7.5.2.12.Rest of LAMEA cell culture market, by end user
7.5.3.LAMEA cell culture market, by product type
7.5.4.LAMEA cell culture market, by application
7.5.5.LAMEA cell culture market, by end user
CHAPTER 8:COMPANY PROFILES
8.1.BECTON, DICKINSON AND COMPANY
8.1.1.Company overview
8.1.2.Company snapshot
8.1.3.Operating business segments
8.1.4.Product portfolio
8.1.5.Business performance
8.2.CORNING INCORPORATED
8.2.1.Company overview
8.2.2.Company snapshot
8.2.3.Operating business segments
8.2.4.Product portfolio
8.2.5.Business performance
8.2.6.Key strategic moves and developments
8.3.DANHER CORPORATION
8.3.1.Company overview
8.3.2.Company snapshot
8.3.3.Operating business segments
8.3.4.Product portfolio
8.3.5.Business performance
8.4.EPPENDORF AG
8.4.1.Company overview
8.4.2.Company snapshot
8.4.3.Operating business segments
8.4.4.Product portfolio
8.4.5.Business performance
8.5.HIMEDIA LABORATORIES
8.5.1.Company overview
8.5.2.Company snapshot
8.5.3.Operating business segments
8.5.4.Product portfolio
8.6.LONZA GROUP LTD
8.6.1.Company overview
8.6.2.Company snapshot
8.6.3.Operating business segments
8.6.4.Operating product portfolio
8.6.5.Business performance
8.6.6.Key strategic moves and developments
8.7.MERCK KGAA
8.7.1.Company overview
8.7.2.Company snapshot
8.7.3.Operating business segments
8.7.4.Product portfolio
8.7.5.Business performance
8.7.6.Key strategic moves and developments
8.8.PROMOCELL GmbH
8.8.1.Company overview
8.8.2.Company snapshot
8.8.3.Operating product segments
8.8.4.Product portfolio
8.9.SARTORIUS AG
8.9.1.Company overview
8.9.2.Company snapshot
8.9.3.Operating business segments
8.9.4.Product portfolio
8.9.5.Business performance
8.9.6.Key strategic moves and developments
8.10.THERMO FISHER SCIENTIFIC, INC.
8.10.1.Company overview
8.10.2.Company snapshot
8.10.3.Operating business segments
8.10.4.Product portfolio
8.10.5.Business performance
8.10.6.Key strategic moves and development
LIST OF TABLES

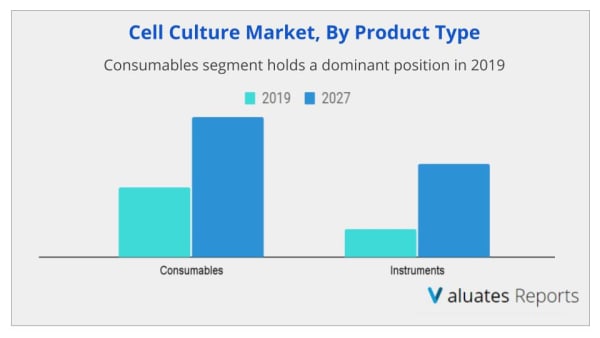
TABLE 01.CELL CULTURE MARKET, BY PRODUCT, 2019-2027 ($MILLION)
TABLE 02.INSTRUMENTS CELL CULTURE MARKET BY REGION 2019-2027, ($MILLION)
TABLE 03.CONSUMABLES CELL CULTURE MARKET BY REGION2019-2027, ($MILLION)
TABLE 04.CELL CULTURE MARKET, BY APPLICATION, 2019-2027 ($MILLION)
TABLE 05.CELL CULTURE MARKET FOR STEM CELL TECHNOLOGY, BY REGION 2019–2027($MILLION)
TABLE 06.CELL CULTURE MARKET FOR CANCER RESEARCH, BY REGION 2019–2027 ($MILLION)
TABLE 07.CELL CULTURE MARKET FOR DRUG SCREENING & DEVELOPMENT, BY REGION 2019–2027 ($MILLION)
TABLE 08.CELL CULTURE MARKET FOR TISSUE ENGINEERING & REGENERATIVE MEDICINE, BY REGION
2019–2027 ($MILLION)
TABLE 09.CELL CULTURE MARKET FOR OTHERS, BY REGION 2019–2027 ($MILLION)
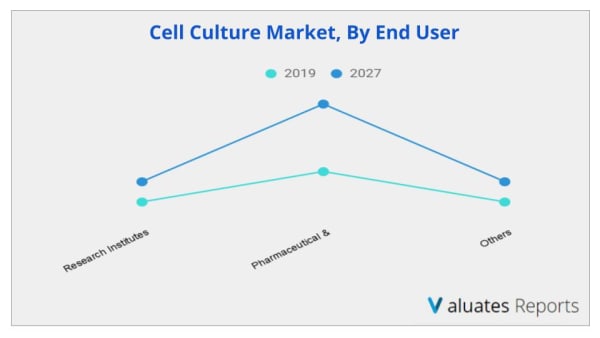
TABLE 10.CELL CULTURE MARKET, BY END USER, 2019-2027 ($MILLION)
TABLE 11.CELL CULTURE MARKET FOR RESEARCH INSTITUTES, BY REGION 2019–2027($MILLION)
TABLE 12.CELL CULTURE MARKET FOR PHARMACEUTICAL & BIOTECHNOLOGY COMPANIES, BY REGION 2019–2027 ($MILLION)
TABLE 13.CELL CULTURE MARKET FOR OTHERS, BY REGION 2019–2027 ($MILLION)
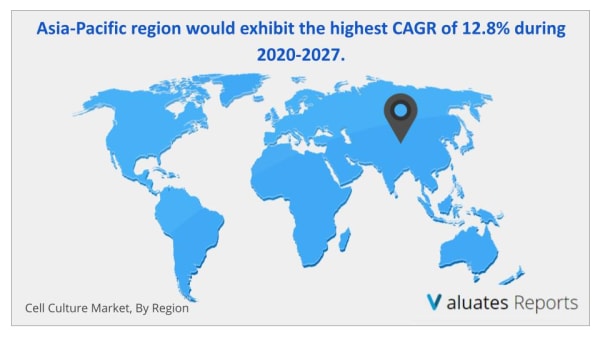
TABLE 14.CELL CULTURE MARKET REVENUE, BY REGION, 2019–2027($MILLION)
TABLE 15.NORTH AMERICA CELL CULTURE MARKET, BY COUNTRY, 2019–2027($MILLION)
TABLE 16.U.S. CELL CULTURE MARKET, BY PRODUCT TYPE, 2019–2027($MILLION)
TABLE 17.U.S. CELL CULTURE MARKET, BY APPLICATION, 2019–2027($MILLION)
TABLE 18.U.S. CELL CULTURE MARKET, BY END USER, 2019–2027($MILLION)
TABLE 19.CANADA CELL CULTURE MARKET, BY PRODUCT TYPE, 2019–2027($MILLION)
TABLE 20.CANADA CELL CULTURE MARKET, BY APPLICATION, 2019–2027($MILLION)
TABLE 21.CANADA CELL CULTURE MARKET, BY END USER, 2019–2027($MILLION)
TABLE 22.MEXICO CELL CULTURE MARKET, BY PRODUCT TYPE, 2019–2027($MILLION)
TABLE 23.MEXICO CELL CULTURE MARKET, BY APPLICATION, 2019–2027($MILLION)
TABLE 24.MEXICO CELL CULTURE MARKET, BY END USER, 2019–2027($MILLION)
TABLE 25.NORTH AMERICA CELL CULTURE MARKET, BY PRODUCT TYPE, 2019–2027($MILLION)
TABLE 26.NORTH AMERICA CELL CULTURE MARKET, BY APPLICATION, 2019–2027($MILLION)
TABLE 27.NORTH AMERICA CELL CULTURE MARKET, BY END USER, 2019–2027($MILLION)
TABLE 28.EUROPE CELL CULTURE MARKET, BY COUNTRY, 2019–2027($MILLION)
TABLE 29.GERMANY CELL CULTURE MARKET, BY PRODUCT TYPE, 2019–2027($MILLION)
TABLE 30.GERMANY CELL CULTURE MARKET, BY APPLICATION, 2019–2027($MILLION)
TABLE 31.GERMANY CELL CULTURE MARKET, BY END USER, 2019–2027($MILLION)
TABLE 32.FRANCE CELL CULTURE MARKET, BY PRODUCT TYPE, 2019–2027($MILLION)
TABLE 33.FRANCE CELL CULTURE MARKET, BY APPLICATION, 2019–2027($MILLION)
TABLE 34.FRANCE CELL CULTURE MARKET, BY END USER, 2019–2027($MILLION)
TABLE 35.UK CELL CULTURE MARKET, BY PRODUCT TYPE, 2019–2027($MILLION)
TABLE 36.UK CELL CULTURE MARKET, BY APPLICATION, 2019–2027($MILLION)
TABLE 37.UK CELL CULTURE MARKET, BY END USER, 2019–2027($MILLION)
TABLE 38.ITALY CELL CULTURE MARKET, BY PRODUCT TYPE, 2019–2027($MILLION)
TABLE 39.ITALY CELL CULTURE MARKET, BY APPLICATION, 2019–2027($MILLION)
TABLE 40.ITALY CELL CULTURE MARKET, BY END USER, 2019–2027($MILLION)
TABLE 41.SPAIN CELL CULTURE MARKET, BY PRODUCT TYPE, 2019–2027($MILLION)
TABLE 42.SPAIN CELL CULTURE MARKET, BY APPLICATION, 2019–2027($MILLION)
TABLE 43.SPAIN CELL CULTURE MARKET, BY END USER, 2019–2027($MILLION)
TABLE 44.REST OF EUROPE CELL CULTURE MARKET, BY PRODUCT TYPE, 2019–2027($MILLION)
TABLE 45.REST OF EUROPE CELL CULTURE MARKET, BY APPLICATION, 2019–2027($MILLION)
TABLE 46.REST OF EUROPE CELL CULTURE MARKET, BY END USER, 2019–2027($MILLION)
TABLE 47.EUROPE CELL CULTURE MARKET, BY PRODUCT TYPE, 2019–2027($MILLION)
TABLE 48.EUROPE CELL CULTURE MARKET, BY APPLICATION, 2019–2027($MILLION)
TABLE 49.EUROPE CELL CULTURE MARKET, BY END USER, 2019–2027($MILLION)
TABLE 50.ASIA-PACIFIC CELL CULTURE MARKET, BY COUNTRY, 2019–2027($MILLION)
TABLE 51.JAPAN CELL CULTURE MARKET, BY PRODUCT TYPE, 2019–2027($MILLION)
TABLE 52.CHINA CELL CULTURE MARKET, BY APPLICATION, 2019–2027($MILLION)
TABLE 53.CHINA CELL CULTURE MARKET, BY END USER, 2019–2027($MILLION)
TABLE 54.JAPAN CELL CULTURE MARKET, BY PRODUCT TYPE, 2019–2027($MILLION)
TABLE 55.JAPAN CELL CULTURE MARKET, BY APPLICATION, 2019–2027($MILLION)
TABLE 56.CHINA CELL CULTURE MARKET, BY END USER, 2019–2027($MILLION)
TABLE 57.AUSTRALIA CELL CULTURE MARKET, BY PRODUCT TYPE, 2019–2027($MILLION)
TABLE 58.AUSTRALIA CELL CULTURE MARKET, BY APPLICATION, 2019–2027($MILLION)
TABLE 59.AUSTRALIA CELL CULTURE MARKET, BY END USER, 2019–2027($MILLION)
TABLE 60.INDIA CELL CULTURE MARKET, BY PRODUCT TYPE, 2019–2027($MILLION)
TABLE 61.INDIA CELL CULTURE MARKET, BY APPLICATION, 2019–2027($MILLION)
TABLE 62.INDIA CELL CULTURE MARKET, BY END USER, 2019–2027($MILLION)
TABLE 63.SOUTH KOREA CELL CULTURE MARKET, BY PRODUCT TYPE, 2019–2027($MILLION)
TABLE 64.SOUTH KOREA CELL CULTURE MARKET, BY APPLICATION, 2019–2027($MILLION)
TABLE 65.SOUTH KOREA CELL CULTURE MARKET, BY END USER, 2019–2027($MILLION)
TABLE 66.REST OF ASIA-PACIFIC CELL CULTURE MARKET, BY PRODUCT TYPE, 2019–2027($MILLION)
TABLE 67.REST OF ASIA-PACIFIC CELL CULTURE MARKET, BY APPLICATION, 2019–2027($MILLION)
TABLE 68.REST OF ASIA-PACIFIC CELL CULTURE MARKET, BY END USER, 2019–2027($MILLION)
TABLE 69.ASIA-PACIFIC CELL CULTURE MARKET, BY PRODUCT TYPE, 2019–2027($MILLION)
TABLE 70.ASIA-PACIFIC CELL CULTURE MARKET, BY APPLICATION, 2019–2027($MILLION)
TABLE 71.ASIA-PACIFIC CELL CULTURE MARKET, BY END USER, 2019–2027($MILLION)
TABLE 72.LAMEA CELL CULTURE MARKET, BY COUNTRY, 2019–2027($MILLION)
TABLE 73.BRAZIL CELL CULTURE MARKET, BY PRODUCT TYPE, 2019–2027($MILLION)
TABLE 74.BRAZIL CELL CULTURE MARKET, BY APPLICATION, 2019–2027($MILLION)
TABLE 75.BRAZIL CELL CULTURE MARKET, BY END USER, 2019–2027($MILLION)
TABLE 76.SAUDI ARABIA CELL CULTURE MARKET, BY PRODUCT TYPE, 2019–2027($MILLION)
TABLE 77.SAUDI ARABIA CELL CULTURE MARKET, BY APPLICATION, 2019–2027($MILLION)
TABLE 78.SAUDI ARABIA CELL CULTURE MARKET, BY END USER, 2019–2027($MILLION)
TABLE 79.SOUTH AFRICA CELL CULTURE MARKET, BY PRODUCT TYPE, 2019–2027($MILLION)
TABLE 80.SOUTH AFRICA CELL CULTURE MARKET, BY APPLICATION, 2019–2027($MILLION)
TABLE 81.SOUTH AFRICA CELL CULTURE MARKET, BY END USER, 2019–2027($MILLION)
TABLE 82.REST OF LAMEA CELL CULTURE MARKET, BY PRODUCT TYPE, 2019–2027($MILLION)
TABLE 83.REST OF LAMEA CELL CULTURE MARKET, BY APPLICATION, 2019–2027($MILLION)
TABLE 84.REST OF LAMEA CELL CULTURE MARKET, BY END USER, 2019–2027($MILLION)
TABLE 85.LAMEA CELL CULTURE MARKET, BY PRODUCT TYPE, 2019–2027($MILLION)
TABLE 86.LAMEA CELL CULTURE MARKET, BY APPLICATION, 2019–2027($MILLION)
TABLE 87.LAMEA CELL CULTURE MARKET, BY END USER, 2019–2027($MILLION)
TABLE 88.BD: SNAPSHOT
TABLE 89.BD: OPERATING SEGMENTS
TABLE 90.BD: PRODUCT PORTFOLIO
TABLE 91.CORNING: COMPANY SNAPSHOT
TABLE 92.CORNING: OPERATING SEGMENT
TABLE 93.CORNING: PRODUCT PORTFOLIO
TABLE 94.CORNING: KEY STRATEGIC MOVES AND DEVELOPMENTS
TABLE 95.DANAHER: COMPANY SNAPSHOT
TABLE 96.DANAHER: OPERATING SEGMENTS
TABLE 97.DANAHER: PRODUCT PORTFOLIO
TABLE 98.EPPENDORF: COMPANY SNAPSHOT
TABLE 99.EPPENDORF: PRODUCT PORTFOLIO
TABLE 100.HIMEDIA: COMPANY SNAPSHOT
TABLE 101.HIMEDIA:OPERATING PRODUCT SEGMENT
TABLE 102.HIMEDIA: PRODUCT PORTFOLIO
TABLE 103.LONZA: COMPANY SNAPSHOT
TABLE 104.PRODUCT PORTFOLIO
TABLE 105.LONZA: PRODUCT PORTFOLIO
TABLE 106.LONZA: KEY STRATEGIC MOVES AND DEVELOPMENTS
TABLE 107.MERCK: COMPANY SNAPSHOT
TABLE 108.MERCK: OPERATING SEGMENTS
TABLE 109.MERCK: PRODUCT PORTFOLIO
TABLE 110.MERCK: KEY STRATEGIC MOVES AND DEVELOPMENTS
TABLE 111.PROMOCELL: COMPANY SNAPSHOT
TABLE 112.PROMOCELL: PRODUCT PORTFOLIO
TABLE 113.SARTORIUS: COMPANY SNAPSHOT
TABLE 114.SARTORIUS: OPERATING BUSINESS SEGMENTS
TABLE 115.SARTORIUS: PRODUCT PORTFOLIO
TABLE 116.SARTORIUS: KEY STRATEGIC MOVES AND DEVELOPMENTS
TABLE 117.THERMO FISHER: COMPANY SNAPSHOT
TABLE 118.THERMO FISHER.: OPERATING SEGMENTS
TABLE 119.THERMO FISHER.: PRODUCT PORTFOLIO
TABLE 120.THERMO FISHER: KEY STRATEGIC MOVES AND DEVELOPMENTS LIST OF FIGURES

FIGURE 01.GLOBAL CELL CULTURE MARKET SEGMENTATION
FIGURE 02.TOP INVESTMENT POCKETS
FIGURE 03.TOP WINNING STRATEGIES, BY YEAR, 2018–2020*
FIGURE 04.TOP WINNING STRATEGIES, BY DEVELOPMENT, 2018–2020* (%)
FIGURE 05.TOP WINNING STRATEGIES, BY COMPANY, 2018–2020*
FIGURE 06.HIGH BARGAINING POWER OF SUPPLIER
FIGURE 07.MODERATE BARGAINING POWER OF BUYERS
FIGURE 08.HIGH THREAT OF SUBSTITUTES
FIGURE 09.MODERATE INTENSITY OF RIVALRY
FIGURE 10.LOW THREAT OF NEW ENTRANT
FIGURE 11.MARKET SHARE ANALYSIS
FIGURE 12.IMPACT ANALYSES, CELL CULTURE MARKET
FIGURE 13.COMPARATIVE SHARE ANALYSIS OF INSTRUMENTS CELL CULTURE MARKET BY COUNTRY,
2019 & 2027 (%)
FIGURE 14.BIOREACTORS IN CELL CULTURE MARKET, 2019 & 2027 ($MILLION)
FIGURE 15.CELL CULTURE VESSELS IN CELL CULTURE MARKET, 2019 & 2027 ($MILLION)
FIGURE 16.CELL CULTURE STORAGE EQUIPMENT IN CELL CULTURE MARKET, 2019 & 2027 ($MILLION)
FIGURE 17.CELL CULTURE SUPPORTING INSTRUMENTS IN CELL CULTURE MARKET, 2019 & 2027 ($MILLION)
FIGURE 18.COMPARATIVE SHARE ANALYSIS OF CONSUMABLES CELL CULTURE MARKET, BY COUNTRY,
2019 & 2027 (%)
FIGURE 19.SERA IN CELL CULTURE MARKET, 2019 & 2027 ($MILLION)
FIGURE 20.MEDIA IN CELL CULTURE MARKET, 2019 & 2027 ($MILLION)
FIGURE 21.REAGENTS IN CELL CULTURE MARKET, 2019 & 2027 ($MILLION)
FIGURE 22.BIOREACTOR ACCESSORIES IN CELL CULTURE MARKET, 2019 & 2027 ($MILLION)
FIGURE 23.COMPARATIVE SHARE ANALYSIS OF CELL CULTURE MARKET FOR STEM CELL TECHNOLOGY,
BY COUNTRY, 2019 & 2027 (%)
FIGURE 24.COMPARATIVE SHARE ANALYSIS OF CELL CULTURE MARKET FOR CANCER RESEARCH, BY COUNTRY, 2019 & 2027 (%)
FIGURE 25.COMPARATIVE SHARE ANALYSIS OF CELL CULTURE MARKET FOR DRUG SCREENING & DEVELOPMENT, BY COUNTRY, 2019 & 2027 (%)
FIGURE 26.COMPARATIVE SHARE ANALYSIS OF CELL CULTURE MARKET FOR TISSUE ENGINEERING & REGENERATIVE MEDICINE, BY COUNTRY, 2019 & 2027 (%)
FIGURE 27.COMPARATIVE SHARE ANALYSIS OF CELL CULTURE MARKET FOR OTHERS, BY COUNTRY,
2019 & 2027 (%)
FIGURE 28.COMPARATIVE SHARE ANALYSIS OF CELL CULTURE MARKET FOR RESEARCH INSTITUTES,
BY COUNTRY, 2019 & 2027 (%)
FIGURE 29.COMPARATIVE SHARE ANALYSIS OF CELL CULTURE MARKET FOR PHARMACEUTICAL & BIOTECHNOLOGY COMPANIES, BY COUNTRY, 2019 & 2027 (%)
FIGURE 30.COMPARATIVE SHARE ANALYSIS OF CELL CULTURE MARKET FOR OTHERS, BY COUNTRY,
2019 & 2027 (%)
FIGURE 31.CANCER INCIDENCES IN GERMANY (2007 & 2050)
FIGURE 32.BD: NET SALES, 2017–2019 ($MILLION)
FIGURE 33.BD: REVENUE SHARE BY SEGMENT, 2019 (%)
FIGURE 34.BD: REVENUE SHARE, BY REGION, 2019 (%)
FIGURE 35.CORNING: NET SALES, 2017–2019 ($MILLION)
FIGURE 36.CORNING: REVENUE SHARE, BY SEGMENT, 2019 (%)
FIGURE 37.CORNING: REVENUE SHARE, BY REGION, 2019 (%)
FIGURE 38.DANAHER: NET SALES, 2017–2019 ($MILLION)
FIGURE 39.DANAHER: REVENUE SHARE BY SEGMENT, 2019 (%)
FIGURE 40.DANAHER: REVENUE SHARE BY REGION, 2019 (%)
FIGURE 41.EPPENDORF: NET SALES, 2017–2019 ($MILLION)
FIGURE 42.EPPENDORF: REVENUE SHARE, BY REGION, 2019 (%)
FIGURE 43.LONZA: NET SALES, 2017–2019 ($MILLION)
FIGURE 44.LONZA: REVENUE SHARE, BY SEGMENT, 2019 (%)
FIGURE 45.MERCK: NET SALES, 2017–2019 ($MILLION)
FIGURE 46.MERCK: REVENUE SHARE, BY SEGMENT, 2019 (%)
FIGURE 47.MERCK: REVENUE SHARE, BY REGION, 2019 (%)
FIGURE 48.SARTORIUS: NET SALES, 2017–2019 ($MILLION)
FIGURE 49.SARTORIUS: REVENUE SHARE BY SEGMENT, 2019 (%)
FIGURE 50.SARTORIUS: REVENUE SHARE BY REGION, 2019 (%)
FIGURE 51.THERMO FISHER: NET SALES, 2017–2019 ($MILLION)
FIGURE 52.THERMO FISHER: REVENUE SHARE, BY SEGMENT, 2019 (%)
FIGURE 53.THERMO FISHER: REVENUE SHARE, BY REGION, 2019 (%
SELECT A FORMAT
Added to Cart
Electronic (PDF)

$6168

This license allows only one user to access the PDF.
Electronic (PDF)

$6929

This license allows 1 - 5 user to access the PDF, license is suitable for small groups of 5 users working together
Electronic (PDF)

$9663

This license allows users/teams in a same Enterprise to use this report, various departments within an enterpise can use this report
Electronic (PDF)

$4125

This license just provides quantitative data in a excel sheet
Add to Cart
Buy Now (15% Discount)

OUR CUSTOMER

Novocure

RELATED REPORTS

Global Pharmaceutical Aseptic Fill and Finish CMO Service Market Research Report 2024

120 Pages
Type: Report
Code: QYRE-Auto-1R8980
Tue Feb 20 00:00:00 UTC 2024

Add to Cart

Global Quizartinib Market Research Report 2024

120 Pages
Type: Report
Code: QYRE-Auto-3Q8625
Tue Feb 20 00:00:00 UTC 2024

Add to Cart

Global Octreotide Market Research Report 2024

120 Pages
Type: Report
Code: QYRE-Auto-3X12361
Tue Feb 20 00:00:00 UTC 2024

Add to Cart

Global Veterinary Anesthesia Vaporizers Market Research Report 2024

120 Pages
Type: Report
Code: QYRE-Auto-35M13226
Tue Feb 20 00:00:00 UTC 2024

Add to Cart