1 Market Overview
1.1 Biostimulants Product Introduction
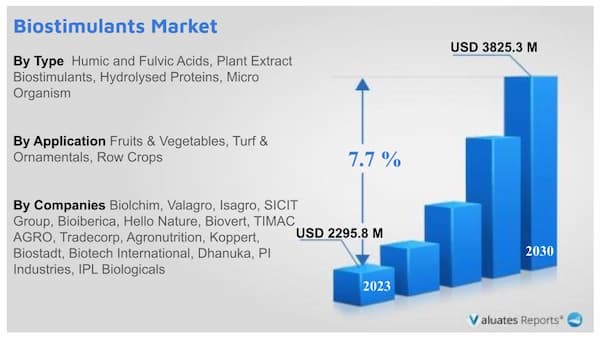
1.2 Global Biostimulants Market Size Forecast
1.2.1 Global Biostimulants Sales Value (2019-2030)
1.2.2 Global Biostimulants Sales Volume (2019-2030)
1.2.3 Global Biostimulants Sales Price (2019-2030)
1.3 Biostimulants Market Trends & Drivers
1.3.1 Biostimulants Industry Trends
1.3.2 Biostimulants Market Drivers & Opportunity
1.3.3 Biostimulants Market Challenges
1.3.4 Biostimulants Market Restraints
1.4 Assumptions and Limitations
1.5 Study Objectives
1.6 Years Considered
2 Competitive Analysis by Company
2.1 Global Biostimulants Players Revenue Ranking (2023)
2.2 Global Biostimulants Revenue by Company (2019-2024)
2.3 Global Biostimulants Players Sales Volume Ranking (2023)
2.4 Global Biostimulants Sales Volume by Company Players (2019-2024)
2.5 Global Biostimulants Average Price by Company (2019-2024)
2.6 Key Manufacturers Biostimulants Manufacturing Base Distribution and Headquarters
2.7 Key Manufacturers Biostimulants Product Offered
2.8 Key Manufacturers Time to Begin Mass Production of Biostimulants
2.9 Biostimulants Market Competitive Analysis
2.9.1 Biostimulants Market Concentration Rate (2019-2024)
2.9.2 Global 5 and 10 Largest Manufacturers by Biostimulants Revenue in 2023
2.9.3 Global Top Manufacturers by Company Type (Tier 1, Tier 2, and Tier 3) & (based on the Revenue in Biostimulants as of 2023)
2.10 Mergers & Acquisitions, Expansion
3 Segmentation by Type
3.1 Introduction by Type
3.1.1 Humic and Fulvic Acids
3.1.2 Plant Extract Biostimulants
3.1.3 Hydrolysed Proteins
3.1.4 Micro Organism
3.1.5 Others
3.2 Global Biostimulants Sales Value by Type
3.2.1 Global Biostimulants Sales Value by Type (2019 VS 2023 VS 2030)
3.2.2 Global Biostimulants Sales Value, by Type (2019-2030)
3.2.3 Global Biostimulants Sales Value, by Type (%) (2019-2030)
3.3 Global Biostimulants Sales Volume by Type
3.3.1 Global Biostimulants Sales Volume by Type (2019 VS 2023 VS 2030)
3.3.2 Global Biostimulants Sales Volume, by Type (2019-2030)
3.3.3 Global Biostimulants Sales Volume, by Type (%) (2019-2030)
3.4 Global Biostimulants Average Price by Type (2019-2030)
4 Segmentation by Application
4.1 Introduction by Application
4.1.1 Fruits & Vegetables
4.1.2 Turf & Ornamentals
4.1.3 Row Crops
4.1.4 Others
4.2 Global Biostimulants Sales Value by Application
4.2.1 Global Biostimulants Sales Value by Application (2019 VS 2023 VS 2030)
4.2.2 Global Biostimulants Sales Value, by Application (2019-2030)
4.2.3 Global Biostimulants Sales Value, by Application (%) (2019-2030)
4.3 Global Biostimulants Sales Volume by Application
4.3.1 Global Biostimulants Sales Volume by Application (2019 VS 2023 VS 2030)
4.3.2 Global Biostimulants Sales Volume, by Application (2019-2030)
4.3.3 Global Biostimulants Sales Volume, by Application (%) (2019-2030)
4.4 Global Biostimulants Average Price by Application (2019-2030)
5 Segmentation by Region
5.1 Global Biostimulants Sales Value by Region
5.1.1 Global Biostimulants Sales Value by Region: 2019 VS 2023 VS 2030
5.1.2 Global Biostimulants Sales Value by Region (2019-2024)
5.1.3 Global Biostimulants Sales Value by Region (2025-2030)
5.1.4 Global Biostimulants Sales Value by Region (%), (2019-2030)
5.2 Global Biostimulants Sales Volume by Region
5.2.1 Global Biostimulants Sales Volume by Region: 2019 VS 2023 VS 2030
5.2.2 Global Biostimulants Sales Volume by Region (2019-2024)
5.2.3 Global Biostimulants Sales Volume by Region (2025-2030)
5.2.4 Global Biostimulants Sales Volume by Region (%), (2019-2030)
5.3 Global Biostimulants Average Price by Region (2019-2030)
5.4 North America
5.4.1 North America Biostimulants Sales Value, 2019-2030
5.4.2 North America Biostimulants Sales Value by Country (%), 2023 VS 2030
5.5 Europe
5.5.1 Europe Biostimulants Sales Value, 2019-2030
5.5.2 Europe Biostimulants Sales Value by Country (%), 2023 VS 2030
5.6 Asia Pacific
5.6.1 Asia Pacific Biostimulants Sales Value, 2019-2030
5.6.2 Asia Pacific Biostimulants Sales Value by Country (%), 2023 VS 2030
5.7 South America
5.7.1 South America Biostimulants Sales Value, 2019-2030
5.7.2 South America Biostimulants Sales Value by Country (%), 2023 VS 2030
5.8 Middle East & Africa
5.8.1 Middle East & Africa Biostimulants Sales Value, 2019-2030
5.8.2 Middle East & Africa Biostimulants Sales Value by Country (%), 2023 VS 2030
6 Segmentation by Key Countries/Regions
6.1 Key Countries/Regions Biostimulants Sales Value Growth Trends, 2019 VS 2023 VS 2030
6.2 Key Countries/Regions Biostimulants Sales Value
6.2.1 Key Countries/Regions Biostimulants Sales Value, 2019-2030
6.2.2 Key Countries/Regions Biostimulants Sales Volume, 2019-2030
6.3 United States
6.3.1 United States Biostimulants Sales Value, 2019-2030
6.3.2 United States Biostimulants Sales Value by Type (%), 2023 VS 2030
6.3.3 United States Biostimulants Sales Value by Application, 2023 VS 2030
6.4 Europe
6.4.1 Europe Biostimulants Sales Value, 2019-2030
6.4.2 Europe Biostimulants Sales Value by Type (%), 2023 VS 2030
6.4.3 Europe Biostimulants Sales Value by Application, 2023 VS 2030
6.5 China
6.5.1 China Biostimulants Sales Value, 2019-2030
6.5.2 China Biostimulants Sales Value by Type (%), 2023 VS 2030
6.5.3 China Biostimulants Sales Value by Application, 2023 VS 2030
6.6 Japan
6.6.1 Japan Biostimulants Sales Value, 2019-2030
6.6.2 Japan Biostimulants Sales Value by Type (%), 2023 VS 2030
6.6.3 Japan Biostimulants Sales Value by Application, 2023 VS 2030
6.7 South Korea
6.7.1 South Korea Biostimulants Sales Value, 2019-2030
6.7.2 South Korea Biostimulants Sales Value by Type (%), 2023 VS 2030
6.7.3 South Korea Biostimulants Sales Value by Application, 2023 VS 2030
6.8 Southeast Asia
6.8.1 Southeast Asia Biostimulants Sales Value, 2019-2030
6.8.2 Southeast Asia Biostimulants Sales Value by Type (%), 2023 VS 2030
6.8.3 Southeast Asia Biostimulants Sales Value by Application, 2023 VS 2030
6.9 India
6.9.1 India Biostimulants Sales Value, 2019-2030
6.9.2 India Biostimulants Sales Value by Type (%), 2023 VS 2030
6.9.3 India Biostimulants Sales Value by Application, 2023 VS 2030
7 Company Profiles
7.1 Biolchim
7.1.1 Biolchim Company Information
7.1.2 Biolchim Introduction and Business Overview
7.1.3 Biolchim Biostimulants Sales, Revenue and Gross Margin (2019-2024)
7.1.4 Biolchim Biostimulants Product Offerings
7.1.5 Biolchim Recent Development
7.2 Valagro
7.2.1 Valagro Company Information
7.2.2 Valagro Introduction and Business Overview
7.2.3 Valagro Biostimulants Sales, Revenue and Gross Margin (2019-2024)
7.2.4 Valagro Biostimulants Product Offerings
7.2.5 Valagro Recent Development
7.3 Isagro
7.3.1 Isagro Company Information
7.3.2 Isagro Introduction and Business Overview
7.3.3 Isagro Biostimulants Sales, Revenue and Gross Margin (2019-2024)
7.3.4 Isagro Biostimulants Product Offerings
7.3.5 Isagro Recent Development
7.4 SICIT Group
7.4.1 SICIT Group Company Information
7.4.2 SICIT Group Introduction and Business Overview
7.4.3 SICIT Group Biostimulants Sales, Revenue and Gross Margin (2019-2024)
7.4.4 SICIT Group Biostimulants Product Offerings
7.4.5 SICIT Group Recent Development
7.5 Bioiberica
7.5.1 Bioiberica Company Information
7.5.2 Bioiberica Introduction and Business Overview
7.5.3 Bioiberica Biostimulants Sales, Revenue and Gross Margin (2019-2024)
7.5.4 Bioiberica Biostimulants Product Offerings
7.5.5 Bioiberica Recent Development
7.6 Hello Nature
7.6.1 Hello Nature Company Information
7.6.2 Hello Nature Introduction and Business Overview
7.6.3 Hello Nature Biostimulants Sales, Revenue and Gross Margin (2019-2024)
7.6.4 Hello Nature Biostimulants Product Offerings
7.6.5 Hello Nature Recent Development
7.7 Biovert
7.7.1 Biovert Company Information
7.7.2 Biovert Introduction and Business Overview
7.7.3 Biovert Biostimulants Sales, Revenue and Gross Margin (2019-2024)
7.7.4 Biovert Biostimulants Product Offerings
7.7.5 Biovert Recent Development
7.8 TIMAC AGRO
7.8.1 TIMAC AGRO Company Information
7.8.2 TIMAC AGRO Introduction and Business Overview
7.8.3 TIMAC AGRO Biostimulants Sales, Revenue and Gross Margin (2019-2024)
7.8.4 TIMAC AGRO Biostimulants Product Offerings
7.8.5 TIMAC AGRO Recent Development
7.9 Tradecorp
7.9.1 Tradecorp Company Information
7.9.2 Tradecorp Introduction and Business Overview
7.9.3 Tradecorp Biostimulants Sales, Revenue and Gross Margin (2019-2024)
7.9.4 Tradecorp Biostimulants Product Offerings
7.9.5 Tradecorp Recent Development
7.10 Agronutrition
7.10.1 Agronutrition Company Information
7.10.2 Agronutrition Introduction and Business Overview
7.10.3 Agronutrition Biostimulants Sales, Revenue and Gross Margin (2019-2024)
7.10.4 Agronutrition Biostimulants Product Offerings
7.10.5 Agronutrition Recent Development
7.11 Koppert
7.11.1 Koppert Company Information
7.11.2 Koppert Introduction and Business Overview
7.11.3 Koppert Biostimulants Sales, Revenue and Gross Margin (2019-2024)
7.11.4 Koppert Biostimulants Product Offerings
7.11.5 Koppert Recent Development
7.12 Arysta LifeScience Corporation
7.12.1 Arysta LifeScience Corporation Company Information
7.12.2 Arysta LifeScience Corporation Introduction and Business Overview
7.12.3 Arysta LifeScience Corporation Biostimulants Sales, Revenue and Gross Margin (2019-2024)
7.12.4 Arysta LifeScience Corporation Biostimulants Product Offerings
7.12.5 Arysta LifeScience Corporation Recent Development
7.13 Biostadt
7.13.1 Biostadt Company Information
7.13.2 Biostadt Introduction and Business Overview
7.13.3 Biostadt Biostimulants Sales, Revenue and Gross Margin (2019-2024)
7.13.4 Biostadt Biostimulants Product Offerings
7.13.5 Biostadt Recent Development
7.14 Biotech International
7.14.1 Biotech International Company Information
7.14.2 Biotech International Introduction and Business Overview
7.14.3 Biotech International Biostimulants Sales, Revenue and Gross Margin (2019-2024)
7.14.4 Biotech International Biostimulants Product Offerings
7.14.5 Biotech International Recent Development
7.15 Dhanuka
7.15.1 Dhanuka Company Information
7.15.2 Dhanuka Introduction and Business Overview
7.15.3 Dhanuka Biostimulants Sales, Revenue and Gross Margin (2019-2024)
7.15.4 Dhanuka Biostimulants Product Offerings
7.15.5 Dhanuka Recent Development
7.16 PI Industries
7.16.1 PI Industries Company Information
7.16.2 PI Industries Introduction and Business Overview
7.16.3 PI Industries Biostimulants Sales, Revenue and Gross Margin (2019-2024)
7.16.4 PI Industries Biostimulants Product Offerings
7.16.5 PI Industries Recent Development
7.17 IPL Biologicals
7.17.1 IPL Biologicals Company Information
7.17.2 IPL Biologicals Introduction and Business Overview
7.17.3 IPL Biologicals Biostimulants Sales, Revenue and Gross Margin (2019-2024)
7.17.4 IPL Biologicals Biostimulants Product Offerings
7.17.5 IPL Biologicals Recent Development
7.18 Fengdan Baili
7.18.1 Fengdan Baili Company Information
7.18.2 Fengdan Baili Introduction and Business Overview
7.18.3 Fengdan Baili Biostimulants Sales, Revenue and Gross Margin (2019-2024)
7.18.4 Fengdan Baili Biostimulants Product Offerings
7.18.5 Fengdan Baili Recent Development
7.19 Guangzhou Sgy Agricultural Science
7.19.1 Guangzhou Sgy Agricultural Science Company Information
7.19.2 Guangzhou Sgy Agricultural Science Introduction and Business Overview
7.19.3 Guangzhou Sgy Agricultural Science Biostimulants Sales, Revenue and Gross Margin (2019-2024)
7.19.4 Guangzhou Sgy Agricultural Science Biostimulants Product Offerings
7.19.5 Guangzhou Sgy Agricultural Science Recent Development
7.20 Angel Yeast
7.20.1 Angel Yeast Company Information
7.20.2 Angel Yeast Introduction and Business Overview
7.20.3 Angel Yeast Biostimulants Sales, Revenue and Gross Margin (2019-2024)
7.20.4 Angel Yeast Biostimulants Product Offerings
7.20.5 Angel Yeast Recent Development
7.21 Leili
7.21.1 Leili Company Information
7.21.2 Leili Introduction and Business Overview
7.21.3 Leili Biostimulants Sales, Revenue and Gross Margin (2019-2024)
7.21.4 Leili Biostimulants Product Offerings
7.21.5 Leili Recent Development
7.22 Humikey
7.22.1 Humikey Company Information
7.22.2 Humikey Introduction and Business Overview
7.22.3 Humikey Biostimulants Sales, Revenue and Gross Margin (2019-2024)
7.22.4 Humikey Biostimulants Product Offerings
7.22.5 Humikey Recent Development
7.23 AMMS Century
7.23.1 AMMS Century Company Information
7.23.2 AMMS Century Introduction and Business Overview
7.23.3 AMMS Century Biostimulants Sales, Revenue and Gross Margin (2019-2024)
7.23.4 AMMS Century Biostimulants Product Offerings
7.23.5 AMMS Century Recent Development
7.24 Acadian Seaplants
7.24.1 Acadian Seaplants Company Information
7.24.2 Acadian Seaplants Introduction and Business Overview
7.24.3 Acadian Seaplants Biostimulants Sales, Revenue and Gross Margin (2019-2024)
7.24.4 Acadian Seaplants Biostimulants Product Offerings
7.24.5 Acadian Seaplants Recent Development
7.25 Agricen
7.25.1 Agricen Company Information
7.25.2 Agricen Introduction and Business Overview
7.25.3 Agricen Biostimulants Sales, Revenue and Gross Margin (2019-2024)
7.25.4 Agricen Biostimulants Product Offerings
7.25.5 Agricen Recent Development
7.26 Marrone Bio Innovations
7.26.1 Marrone Bio Innovations Company Information
7.26.2 Marrone Bio Innovations Introduction and Business Overview
7.26.3 Marrone Bio Innovations Biostimulants Sales, Revenue and Gross Margin (2019-2024)
7.26.4 Marrone Bio Innovations Biostimulants Product Offerings
7.26.5 Marrone Bio Innovations Recent Development
7.27 Advanced Nutrients
7.27.1 Advanced Nutrients Company Information
7.27.2 Advanced Nutrients Introduction and Business Overview
7.27.3 Advanced Nutrients Biostimulants Sales, Revenue and Gross Margin (2019-2024)
7.27.4 Advanced Nutrients Biostimulants Product Offerings
7.27.5 Advanced Nutrients Recent Development
7.28 BioLiNE Corp
7.28.1 BioLiNE Corp Company Information
7.28.2 BioLiNE Corp Introduction and Business Overview
7.28.3 BioLiNE Corp Biostimulants Sales, Revenue and Gross Margin (2019-2024)
7.28.4 BioLiNE Corp Biostimulants Product Offerings
7.28.5 BioLiNE Corp Recent Development
8 Industry Chain Analysis
8.1 Biostimulants Industrial Chain
8.2 Biostimulants Upstream Analysis
8.2.1 Key Raw Materials
8.2.2 Raw Materials Key Suppliers
8.2.3 Manufacturing Cost Structure
8.3 Midstream Analysis
8.4 Downstream Analysis (Customers Analysis)
8.5 Sales Model and Sales Channels
8.5.1 Biostimulants Sales Model
8.5.2 Sales Channel
8.5.3 Biostimulants Distributors
9 Research Findings and Conclusion
10 Appendix
10.1 Research Methodology
10.1.1 Methodology/Research Approach
10.1.2 Data Source
10.2 Author Details
10.3 Disclaimer
List of Tables
Table 1. Biostimulants Market Trends
Table 2. Biostimulants Market Drivers & Opportunity
Table 3. Biostimulants Market Challenges
Table 4. Biostimulants Market Restraints
Table 5. Global Biostimulants Revenue by Company (2019-2024) & (US$ Million)
Table 6. Global Biostimulants Revenue Market Share by Company (2019-2024)
Table 7. Global Biostimulants Sales Volume by Company (2019-2024) & (K MT)
Table 8. Global Biostimulants Sales Volume Market Share by Company (2019-2024)
Table 9. Global Market Biostimulants Price by Company (2019-2024) & (USD/MT)
Table 10. Key Manufacturers Biostimulants Manufacturing Base Distribution and Headquarters
Table 11. Key Manufacturers Biostimulants Product Type
Table 12. Key Manufacturers Time to Begin Mass Production of Biostimulants
Table 13. Global Biostimulants Manufacturers Market Concentration Ratio (CR5 and HHI)
Table 14. Global Top Manufacturers Market Share by Company Type (Tier 1, Tier 2, and Tier 3) & (based on the Revenue in Biostimulants as of 2023)
Table 15. Mergers & Acquisitions, Expansion Plans
Table 16. Global Biostimulants Sales Value by Type: 2019 VS 2023 VS 2030 (US$ Million)
Table 17. Global Biostimulants Sales Value by Type (2019-2024) & (US$ Million)
Table 18. Global Biostimulants Sales Value by Type (2025-2030) & (US$ Million)
Table 19. Global Biostimulants Sales Market Share in Value by Type (2019-2024) & (%)
Table 20. Global Biostimulants Sales Market Share in Value by Type (2025-2030) & (%)
Table 21. Global Biostimulants Sales Volume by Type: 2019 VS 2023 VS 2030 (K MT)
Table 22. Global Biostimulants Sales Volume by Type (2019-2024) & (K MT)
Table 23. Global Biostimulants Sales Volume by Type (2025-2030) & (K MT)
Table 24. Global Biostimulants Sales Market Share in Volume by Type (2019-2024) & (%)
Table 25. Global Biostimulants Sales Market Share in Volume by Type (2025-2030) & (%)
Table 26. Global Biostimulants Price by Type (2019-2024) & (USD/MT)
Table 27. Global Biostimulants Price by Type (2025-2030) & (USD/MT)
Table 28. Global Biostimulants Sales Value by Application: 2019 VS 2023 VS 2030 (US$ Million)
Table 29. Global Biostimulants Sales Value by Application (2019-2024) & (US$ Million)
Table 30. Global Biostimulants Sales Value by Application (2025-2030) & (US$ Million)
Table 31. Global Biostimulants Sales Market Share in Value by Application (2019-2024) & (%)
Table 32. Global Biostimulants Sales Market Share in Value by Application (2025-2030) & (%)
Table 33. Global Biostimulants Sales Volume by Application: 2019 VS 2023 VS 2030 (K MT)
Table 34. Global Biostimulants Sales Volume by Application (2019-2024) & (K MT)
Table 35. Global Biostimulants Sales Volume by Application (2025-2030) & (K MT)
Table 36. Global Biostimulants Sales Market Share in Volume by Application (2019-2024) & (%)
Table 37. Global Biostimulants Sales Market Share in Volume by Application (2025-2030) & (%)
Table 38. Global Biostimulants Price by Application (2019-2024) & (USD/MT)
Table 39. Global Biostimulants Price by Application (2025-2030) & (USD/MT)
Table 40. Global Biostimulants Sales Value by Region: 2019 VS 2023 VS 2030 (US$ Million)
Table 41. Global Biostimulants Sales Value by Region (2019-2024) & (US$ Million)
Table 42. Global Biostimulants Sales Value by Region (2025-2030) & (US$ Million)
Table 43. Global Biostimulants Sales Value by Region (2019-2024) & (%)
Table 44. Global Biostimulants Sales Value by Region (2025-2030) & (%)
Table 45. Global Biostimulants Sales Volume by Region (K MT): 2019 VS 2023 VS 2030
Table 46. Global Biostimulants Sales Volume by Region (2019-2024) & (K MT)
Table 47. Global Biostimulants Sales Volume by Region (2025-2030) & (K MT)
Table 48. Global Biostimulants Sales Volume by Region (2019-2024) & (%)
Table 49. Global Biostimulants Sales Volume by Region (2025-2030) & (%)
Table 50. Global Biostimulants Average Price by Region (2019-2024) & (USD/MT)
Table 51. Global Biostimulants Average Price by Region (2025-2030) & (USD/MT)
Table 52. Key Countries/Regions Biostimulants Sales Value Growth Trends, (US$ Million): 2019 VS 2023 VS 2030
Table 53. Key Countries/Regions Biostimulants Sales Value, (2019-2024) & (US$ Million)
Table 54. Key Countries/Regions Biostimulants Sales Value, (2025-2030) & (US$ Million)
Table 55. Key Countries/Regions Biostimulants Sales Volume, (2019-2024) & (K MT)
Table 56. Key Countries/Regions Biostimulants Sales Volume, (2025-2030) & (K MT)
Table 57. Biolchim Company Information
Table 58. Biolchim Introduction and Business Overview
Table 59. Biolchim Biostimulants Sales (K MT), Revenue (US$ Million), Price (USD/MT) and Gross Margin (2019-2024)
Table 60. Biolchim Biostimulants Product Offerings
Table 61. Biolchim Recent Development
Table 62. Valagro Company Information
Table 63. Valagro Introduction and Business Overview
Table 64. Valagro Biostimulants Sales (K MT), Revenue (US$ Million), Price (USD/MT) and Gross Margin (2019-2024)
Table 65. Valagro Biostimulants Product Offerings
Table 66. Valagro Recent Development
Table 67. Isagro Company Information
Table 68. Isagro Introduction and Business Overview
Table 69. Isagro Biostimulants Sales (K MT), Revenue (US$ Million), Price (USD/MT) and Gross Margin (2019-2024)
Table 70. Isagro Biostimulants Product Offerings
Table 71. Isagro Recent Development
Table 72. SICIT Group Company Information
Table 73. SICIT Group Introduction and Business Overview
Table 74. SICIT Group Biostimulants Sales (K MT), Revenue (US$ Million), Price (USD/MT) and Gross Margin (2019-2024)
Table 75. SICIT Group Biostimulants Product Offerings
Table 76. SICIT Group Recent Development
Table 77. Bioiberica Company Information
Table 78. Bioiberica Introduction and Business Overview
Table 79. Bioiberica Biostimulants Sales (K MT), Revenue (US$ Million), Price (USD/MT) and Gross Margin (2019-2024)
Table 80. Bioiberica Biostimulants Product Offerings
Table 81. Bioiberica Recent Development
Table 82. Hello Nature Company Information
Table 83. Hello Nature Introduction and Business Overview
Table 84. Hello Nature Biostimulants Sales (K MT), Revenue (US$ Million), Price (USD/MT) and Gross Margin (2019-2024)
Table 85. Hello Nature Biostimulants Product Offerings
Table 86. Hello Nature Recent Development
Table 87. Biovert Company Information
Table 88. Biovert Introduction and Business Overview
Table 89. Biovert Biostimulants Sales (K MT), Revenue (US$ Million), Price (USD/MT) and Gross Margin (2019-2024)
Table 90. Biovert Biostimulants Product Offerings
Table 91. Biovert Recent Development
Table 92. TIMAC AGRO Company Information
Table 93. TIMAC AGRO Introduction and Business Overview
Table 94. TIMAC AGRO Biostimulants Sales (K MT), Revenue (US$ Million), Price (USD/MT) and Gross Margin (2019-2024)
Table 95. TIMAC AGRO Biostimulants Product Offerings
Table 96. TIMAC AGRO Recent Development
Table 97. Tradecorp Company Information
Table 98. Tradecorp Introduction and Business Overview
Table 99. Tradecorp Biostimulants Sales (K MT), Revenue (US$ Million), Price (USD/MT) and Gross Margin (2019-2024)
Table 100. Tradecorp Biostimulants Product Offerings
Table 101. Tradecorp Recent Development
Table 102. Agronutrition Company Information
Table 103. Agronutrition Introduction and Business Overview
Table 104. Agronutrition Biostimulants Sales (K MT), Revenue (US$ Million), Price (USD/MT) and Gross Margin (2019-2024)
Table 105. Agronutrition Biostimulants Product Offerings
Table 106. Agronutrition Recent Development
Table 107. Koppert Company Information
Table 108. Koppert Introduction and Business Overview
Table 109. Koppert Biostimulants Sales (K MT), Revenue (US$ Million), Price (USD/MT) and Gross Margin (2019-2024)
Table 110. Koppert Biostimulants Product Offerings
Table 111. Koppert Recent Development
Table 112. Arysta LifeScience Corporation Company Information
Table 113. Arysta LifeScience Corporation Introduction and Business Overview
Table 114. Arysta LifeScience Corporation Biostimulants Sales (K MT), Revenue (US$ Million), Price (USD/MT) and Gross Margin (2019-2024)
Table 115. Arysta LifeScience Corporation Biostimulants Product Offerings
Table 116. Arysta LifeScience Corporation Recent Development
Table 117. Biostadt Company Information
Table 118. Biostadt Introduction and Business Overview
Table 119. Biostadt Biostimulants Sales (K MT), Revenue (US$ Million), Price (USD/MT) and Gross Margin (2019-2024)
Table 120. Biostadt Biostimulants Product Offerings
Table 121. Biostadt Recent Development
Table 122. Biotech International Company Information
Table 123. Biotech International Introduction and Business Overview
Table 124. Biotech International Biostimulants Sales (K MT), Revenue (US$ Million), Price (USD/MT) and Gross Margin (2019-2024)
Table 125. Biotech International Biostimulants Product Offerings
Table 126. Biotech International Recent Development
Table 127. Dhanuka Company Information
Table 128. Dhanuka Introduction and Business Overview
Table 129. Dhanuka Biostimulants Sales (K MT), Revenue (US$ Million), Price (USD/MT) and Gross Margin (2019-2024)
Table 130. Dhanuka Biostimulants Product Offerings
Table 131. Dhanuka Recent Development
Table 132. PI Industries Company Information
Table 133. PI Industries Introduction and Business Overview
Table 134. PI Industries Biostimulants Sales (K MT), Revenue (US$ Million), Price (USD/MT) and Gross Margin (2019-2024)
Table 135. PI Industries Biostimulants Product Offerings
Table 136. PI Industries Recent Development
Table 137. IPL Biologicals Company Information
Table 138. IPL Biologicals Introduction and Business Overview
Table 139. IPL Biologicals Biostimulants Sales (K MT), Revenue (US$ Million), Price (USD/MT) and Gross Margin (2019-2024)
Table 140. IPL Biologicals Biostimulants Product Offerings
Table 141. IPL Biologicals Recent Development
Table 142. Fengdan Baili Company Information
Table 143. Fengdan Baili Introduction and Business Overview
Table 144. Fengdan Baili Biostimulants Sales (K MT), Revenue (US$ Million), Price (USD/MT) and Gross Margin (2019-2024)
Table 145. Fengdan Baili Biostimulants Product Offerings
Table 146. Fengdan Baili Recent Development
Table 147. Guangzhou Sgy Agricultural Science Company Information
Table 148. Guangzhou Sgy Agricultural Science Introduction and Business Overview
Table 149. Guangzhou Sgy Agricultural Science Biostimulants Sales (K MT), Revenue (US$ Million), Price (USD/MT) and Gross Margin (2019-2024)
Table 150. Guangzhou Sgy Agricultural Science Biostimulants Product Offerings
Table 151. Guangzhou Sgy Agricultural Science Recent Development
Table 152. Angel Yeast Company Information
Table 153. Angel Yeast Introduction and Business Overview
Table 154. Angel Yeast Biostimulants Sales (K MT), Revenue (US$ Million), Price (USD/MT) and Gross Margin (2019-2024)
Table 155. Angel Yeast Biostimulants Product Offerings
Table 156. Angel Yeast Recent Development
Table 157. Leili Company Information
Table 158. Leili Introduction and Business Overview
Table 159. Leili Biostimulants Sales (K MT), Revenue (US$ Million), Price (USD/MT) and Gross Margin (2019-2024)
Table 160. Leili Biostimulants Product Offerings
Table 161. Leili Recent Development
Table 162. Humikey Company Information
Table 163. Humikey Introduction and Business Overview
Table 164. Humikey Biostimulants Sales (K MT), Revenue (US$ Million), Price (USD/MT) and Gross Margin (2019-2024)
Table 165. Humikey Biostimulants Product Offerings
Table 166. Humikey Recent Development
Table 167. AMMS Century Company Information
Table 168. AMMS Century Introduction and Business Overview
Table 169. AMMS Century Biostimulants Sales (K MT), Revenue (US$ Million), Price (USD/MT) and Gross Margin (2019-2024)
Table 170. AMMS Century Biostimulants Product Offerings
Table 171. AMMS Century Recent Development
Table 172. Acadian Seaplants Company Information
Table 173. Acadian Seaplants Introduction and Business Overview
Table 174. Acadian Seaplants Biostimulants Sales (K MT), Revenue (US$ Million), Price (USD/MT) and Gross Margin (2019-2024)
Table 175. Acadian Seaplants Biostimulants Product Offerings
Table 176. Acadian Seaplants Recent Development
Table 177. Agricen Introduction and Business Overview
Table 178. Agricen Biostimulants Sales (K MT), Revenue (US$ Million), Price (USD/MT) and Gross Margin (2019-2024)
Table 179. Agricen Biostimulants Product Offerings
Table 180. Agricen Recent Development
Table 181. Agricen Company Information
Table 182. Marrone Bio Innovations Company Information
Table 183. Marrone Bio Innovations Introduction and Business Overview
Table 184. Marrone Bio Innovations Biostimulants Sales (K MT), Revenue (US$ Million), Price (USD/MT) and Gross Margin (2019-2024)
Table 185. Marrone Bio Innovations Biostimulants Product Offerings
Table 186. Marrone Bio Innovations Recent Development
Table 187. Advanced Nutrients Company Information
Table 188. Advanced Nutrients Introduction and Business Overview
Table 189. Advanced Nutrients Biostimulants Sales (K MT), Revenue (US$ Million), Price (USD/MT) and Gross Margin (2019-2024)
Table 190. Advanced Nutrients Biostimulants Product Offerings
Table 191. Advanced Nutrients Recent Development
Table 192. BioLiNE Corp Company Information
Table 193. BioLiNE Corp Introduction and Business Overview
Table 194. BioLiNE Corp Biostimulants Sales (K MT), Revenue (US$ Million), Price (USD/MT) and Gross Margin (2019-2024)
Table 195. BioLiNE Corp Biostimulants Product Offerings
Table 196. BioLiNE Corp Recent Development
Table 197. Key Raw Materials Lists
Table 198. Raw Materials Key Suppliers Lists
Table 199. Biostimulants Downstream Customers
Table 200. Biostimulants Distributors List
Table 201. Research Programs/Design for This Report
Table 202. Key Data Information from Secondary Sources
Table 203. Key Data Information from Primary Sources
List of Figures
Figure 1. Biostimulants Product Picture
Figure 2. Global Biostimulants Sales Value, 2019 VS 2023 VS 2030 (US$ Million)
Figure 3. Global Biostimulants Sales Value (2019-2030) & (US$ Million)
Figure 4. Global Biostimulants Sales Volume (2019-2030) & (K MT)
Figure 5. Global Biostimulants Sales Price (2019-2030) & (USD/MT)
Figure 6. Biostimulants Report Years Considered
Figure 7. Global Biostimulants Players Revenue Ranking (2023) & (US$ Million)
Figure 8. Global Biostimulants Players Sales Volume Ranking (2023) & (K MT)
Figure 9. The 5 and 10 Largest Manufacturers in the World: Market Share by Biostimulants Revenue in 2023
Figure 10. Biostimulants Market Share by Company Type (Tier 1, Tier 2, and Tier 3): 2019 VS 2023
Figure 11. Humic and Fulvic Acids Picture
Figure 12. Plant Extract Biostimulants Picture
Figure 13. Hydrolysed Proteins Picture
Figure 14. Micro Organism Picture
Figure 15. Others Picture
Figure 16. Global Biostimulants Sales Value by Type (2019 VS 2023 VS 2030) & (US$ Million)
Figure 17. Global Biostimulants Sales Value Market Share by Type, 2023 & 2030
Figure 18. Global Biostimulants Sales Volume by Type (2019 VS 2023 VS 2030) & (K MT)
Figure 19. Global Biostimulants Sales Volume Market Share by Type, 2023 & 2030
Figure 20. Global Biostimulants Price by Type (2019-2030) & (USD/MT)
Figure 21. Product Picture of Fruits & Vegetables
Figure 22. Product Picture of Turf & Ornamentals
Figure 23. Product Picture of Row Crops
Figure 24. Product Picture of Others
Figure 25. Global Biostimulants Sales Value by Application (2019 VS 2023 VS 2030) & (US$ Million)
Figure 26. Global Biostimulants Sales Value Market Share by Application, 2023 & 2030
Figure 27. Global Biostimulants Sales Volume by Application (2019 VS 2023 VS 2030) & (K MT)
Figure 28. Global Biostimulants Sales Volume Market Share by Application, 2023 & 2030
Figure 29. Global Biostimulants Price by Application (2019-2030) & (USD/MT)
Figure 30. North America Biostimulants Sales Value (2019-2030) & (US$ Million)
Figure 31. North America Biostimulants Sales Value by Country (%), 2023 VS 2030
Figure 32. Europe Biostimulants Sales Value (2019-2030) & (US$ Million)
Figure 33. Europe Biostimulants Sales Value by Country (%), 2023 VS 2030
Figure 34. Asia Pacific Biostimulants Sales Value (2019-2030) & (US$ Million)
Figure 35. Asia Pacific Biostimulants Sales Value by Country (%), 2023 VS 2030
Figure 36. South America Biostimulants Sales Value (2019-2030) & (US$ Million)
Figure 37. South America Biostimulants Sales Value by Country (%), 2023 VS 2030
Figure 38. Middle East & Africa Biostimulants Sales Value (2019-2030) & (US$ Million)
Figure 39. Middle East & Africa Biostimulants Sales Value by Country (%), 2023 VS 2030
Figure 40. Key Countries/Regions Biostimulants Sales Value (%), (2019-2030)
Figure 41. Key Countries/Regions Biostimulants Sales Volume (%), (2019-2030)
Figure 42. United States Biostimulants Sales Value, (2019-2030) & (US$ Million)
Figure 43. United States Biostimulants Sales Value by Type (%), 2023 VS 2030
Figure 44. United States Biostimulants Sales Value by Application (%), 2023 VS 2030
Figure 45. Europe Biostimulants Sales Value, (2019-2030) & (US$ Million)
Figure 46. Europe Biostimulants Sales Value by Type (%), 2023 VS 2030
Figure 47. Europe Biostimulants Sales Value by Application (%), 2023 VS 2030
Figure 48. China Biostimulants Sales Value, (2019-2030) & (US$ Million)
Figure 49. China Biostimulants Sales Value by Type (%), 2023 VS 2030
Figure 50. China Biostimulants Sales Value by Application (%), 2023 VS 2030
Figure 51. Japan Biostimulants Sales Value, (2019-2030) & (US$ Million)
Figure 52. Japan Biostimulants Sales Value by Type (%), 2023 VS 2030
Figure 53. Japan Biostimulants Sales Value by Application (%), 2023 VS 2030
Figure 54. South Korea Biostimulants Sales Value, (2019-2030) & (US$ Million)
Figure 55. South Korea Biostimulants Sales Value by Type (%), 2023 VS 2030
Figure 56. South Korea Biostimulants Sales Value by Application (%), 2023 VS 2030
Figure 57. Southeast Asia Biostimulants Sales Value, (2019-2030) & (US$ Million)
Figure 58. Southeast Asia Biostimulants Sales Value by Type (%), 2023 VS 2030
Figure 59. Southeast Asia Biostimulants Sales Value by Application (%), 2023 VS 2030
Figure 60. India Biostimulants Sales Value, (2019-2030) & (US$ Million)
Figure 61. India Biostimulants Sales Value by Type (%), 2023 VS 2030
Figure 62. India Biostimulants Sales Value by Application (%), 2023 VS 2030
Figure 63. Biostimulants Industrial Chain
Figure 64. Biostimulants Manufacturing Cost Structure
Figure 65. Channels of Distribution (Direct Sales, and Distribution)
Figure 66. Bottom-up and Top-down Approaches for This Report
Figure 67. Data Triangulation
Figure 68. Key Executives Interviewed