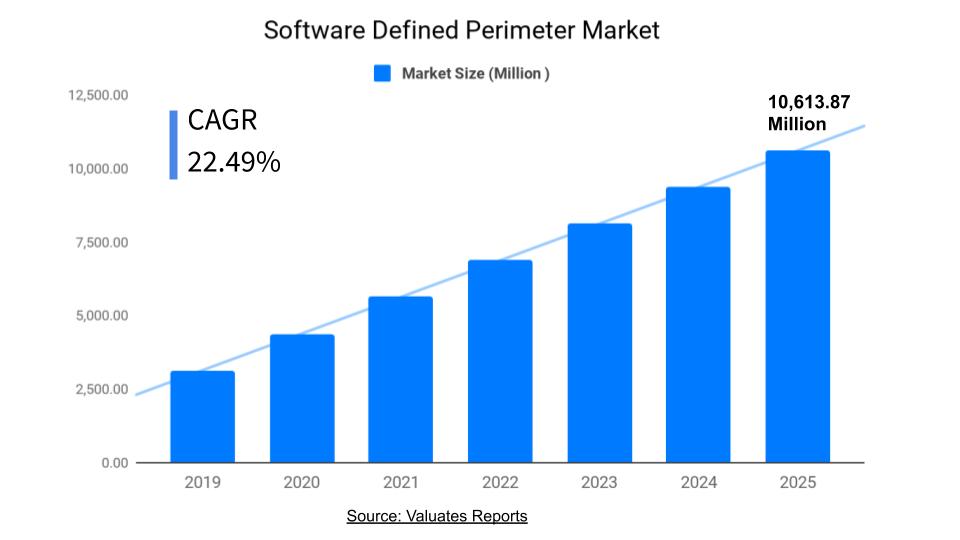
TABLE 1. GLOBAL SOFTWARE DEFINED PERIMETER MARKET SIZE, 2017-2025 (USD MILLION)
TABLE 2. GLOBAL SOFTWARE DEFINED PERIMETER MARKET SIZE, BY ENFORCEMENT POINT, 2017-2025 (USD MILLION)
TABLE 3. GLOBAL SOFTWARE DEFINED PERIMETER MARKET SIZE, BY CONTROLLER, BY GEOGRAPHY, 2017-2025 (USD MILLION)
TABLE 4. GLOBAL SOFTWARE DEFINED PERIMETER MARKET SIZE, BY END POINT, BY GEOGRAPHY, 2017-2025 (USD MILLION)
TABLE 5. GLOBAL SOFTWARE DEFINED PERIMETER MARKET SIZE, BY GATEWAY, BY GEOGRAPHY, 2017-2025 (USD MILLION)
TABLE 6. GLOBAL SOFTWARE DEFINED PERIMETER MARKET SIZE, BY COMPONENT, 2017-2025 (USD MILLION)
TABLE 7. GLOBAL SOFTWARE DEFINED PERIMETER MARKET SIZE, BY SERVICES, BY GEOGRAPHY, 2017-2025 (USD MILLION)
TABLE 8. GLOBAL SOFTWARE DEFINED PERIMETER MARKET SIZE, BY SOLUTIONS, BY GEOGRAPHY, 2017-2025 (USD MILLION)
TABLE 9. GLOBAL SOFTWARE DEFINED PERIMETER MARKET SIZE, BY DEPLOYMENT, 2017-2025 (USD MILLION)
TABLE 10. GLOBAL SOFTWARE DEFINED PERIMETER MARKET SIZE, BY ON-CLOUD, BY GEOGRAPHY, 2017-2025 (USD MILLION)
TABLE 11. GLOBAL SOFTWARE DEFINED PERIMETER MARKET SIZE, BY ON-PREMISES, BY GEOGRAPHY, 2017-2025 (USD MILLION)
TABLE 12. GLOBAL SOFTWARE DEFINED PERIMETER MARKET SIZE, BY END USER, 2017-2025 (USD MILLION)
TABLE 13. GLOBAL SOFTWARE DEFINED PERIMETER MARKET SIZE, BY BANKING, FINANCIAL SERVICES, AND INSURANCE, BY GEOGRAPHY, 2017-2025 (USD MILLION)
TABLE 14. GLOBAL SOFTWARE DEFINED PERIMETER MARKET SIZE, BY DEFENSE, BY GEOGRAPHY, 2017-2025 (USD MILLION)
TABLE 15. GLOBAL SOFTWARE DEFINED PERIMETER MARKET SIZE, BY EDUCATION, BY GEOGRAPHY, 2017-2025 (USD MILLION)
TABLE 16. GLOBAL SOFTWARE DEFINED PERIMETER MARKET SIZE, BY GOVERNMENT, BY GEOGRAPHY, 2017-2025 (USD MILLION)
TABLE 17. GLOBAL SOFTWARE DEFINED PERIMETER MARKET SIZE, BY HEALTHCARE, BY GEOGRAPHY, 2017-2025 (USD MILLION)
TABLE 18. GLOBAL SOFTWARE DEFINED PERIMETER MARKET SIZE, BY INFORMATION TECHNOLOGY ENABLED SERVICES, BY GEOGRAPHY, 2017-2025 (USD MILLION)
TABLE 19. GLOBAL SOFTWARE DEFINED PERIMETER MARKET SIZE, BY MEDIA & ENTERTAINMENT, BY GEOGRAPHY, 2017-2025 (USD MILLION)
TABLE 20. GLOBAL SOFTWARE DEFINED PERIMETER MARKET SIZE, BY TELECOM, BY GEOGRAPHY, 2017-2025 (USD MILLION)
TABLE 21. GLOBAL SOFTWARE DEFINED PERIMETER MARKET SIZE, BY GEOGRAPHY, 2017-2025 (USD MILLION)
TABLE 22. AMERICAS SOFTWARE DEFINED PERIMETER MARKET SIZE, BY GEOGRAPHY, 2017-2025 (USD MILLION)
TABLE 23. AMERICAS SOFTWARE DEFINED PERIMETER MARKET SIZE, BY ENFORCEMENT POINT, 2017-2025 (USD MILLION)
TABLE 24. AMERICAS SOFTWARE DEFINED PERIMETER MARKET SIZE, BY COMPONENT, 2017-2025 (USD MILLION)
TABLE 25. AMERICAS SOFTWARE DEFINED PERIMETER MARKET SIZE, BY DEPLOYMENT, 2017-2025 (USD MILLION)
TABLE 26. AMERICAS SOFTWARE DEFINED PERIMETER MARKET SIZE, BY END USER, 2017-2025 (USD MILLION)
TABLE 27. ARGENTINA SOFTWARE DEFINED PERIMETER MARKET SIZE, BY ENFORCEMENT POINT, 2017-2025 (USD MILLION)
TABLE 28. ARGENTINA SOFTWARE DEFINED PERIMETER MARKET SIZE, BY COMPONENT, 2017-2025 (USD MILLION)
TABLE 29. ARGENTINA SOFTWARE DEFINED PERIMETER MARKET SIZE, BY DEPLOYMENT, 2017-2025 (USD MILLION)
TABLE 30. ARGENTINA SOFTWARE DEFINED PERIMETER MARKET SIZE, BY END USER, 2017-2025 (USD MILLION)
TABLE 31. BRAZIL SOFTWARE DEFINED PERIMETER MARKET SIZE, BY ENFORCEMENT POINT, 2017-2025 (USD MILLION)
TABLE 32. BRAZIL SOFTWARE DEFINED PERIMETER MARKET SIZE, BY COMPONENT, 2017-2025 (USD MILLION)
TABLE 33. BRAZIL SOFTWARE DEFINED PERIMETER MARKET SIZE, BY DEPLOYMENT, 2017-2025 (USD MILLION)
TABLE 34. BRAZIL SOFTWARE DEFINED PERIMETER MARKET SIZE, BY END USER, 2017-2025 (USD MILLION)
TABLE 35. CANADA SOFTWARE DEFINED PERIMETER MARKET SIZE, BY ENFORCEMENT POINT, 2017-2025 (USD MILLION)
TABLE 36. CANADA SOFTWARE DEFINED PERIMETER MARKET SIZE, BY COMPONENT, 2017-2025 (USD MILLION)
TABLE 37. CANADA SOFTWARE DEFINED PERIMETER MARKET SIZE, BY DEPLOYMENT, 2017-2025 (USD MILLION)
TABLE 38. CANADA SOFTWARE DEFINED PERIMETER MARKET SIZE, BY END USER, 2017-2025 (USD MILLION)
TABLE 39. MEXICO SOFTWARE DEFINED PERIMETER MARKET SIZE, BY ENFORCEMENT POINT, 2017-2025 (USD MILLION)
TABLE 40. MEXICO SOFTWARE DEFINED PERIMETER MARKET SIZE, BY COMPONENT, 2017-2025 (USD MILLION)
TABLE 41. MEXICO SOFTWARE DEFINED PERIMETER MARKET SIZE, BY DEPLOYMENT, 2017-2025 (USD MILLION)
TABLE 42. MEXICO SOFTWARE DEFINED PERIMETER MARKET SIZE, BY END USER, 2017-2025 (USD MILLION)
TABLE 43. UNITED STATES SOFTWARE DEFINED PERIMETER MARKET SIZE, BY ENFORCEMENT POINT, 2017-2025 (USD MILLION)
TABLE 44. UNITED STATES SOFTWARE DEFINED PERIMETER MARKET SIZE, BY COMPONENT, 2017-2025 (USD MILLION)
TABLE 45. UNITED STATES SOFTWARE DEFINED PERIMETER MARKET SIZE, BY DEPLOYMENT, 2017-2025 (USD MILLION)
TABLE 46. UNITED STATES SOFTWARE DEFINED PERIMETER MARKET SIZE, BY END USER, 2017-2025 (USD MILLION)
TABLE 47. ASIA-PACIFIC SOFTWARE DEFINED PERIMETER MARKET SIZE, BY GEOGRAPHY, 2017-2025 (USD MILLION)
TABLE 48. ASIA-PACIFIC SOFTWARE DEFINED PERIMETER MARKET SIZE, BY ENFORCEMENT POINT, 2017-2025 (USD MILLION)
TABLE 49. ASIA-PACIFIC SOFTWARE DEFINED PERIMETER MARKET SIZE, BY COMPONENT, 2017-2025 (USD MILLION)
TABLE 50. ASIA-PACIFIC SOFTWARE DEFINED PERIMETER MARKET SIZE, BY DEPLOYMENT, 2017-2025 (USD MILLION)
TABLE 51. ASIA-PACIFIC SOFTWARE DEFINED PERIMETER MARKET SIZE, BY END USER, 2017-2025 (USD MILLION)
TABLE 52. AUSTRALIA SOFTWARE DEFINED PERIMETER MARKET SIZE, BY ENFORCEMENT POINT, 2017-2025 (USD MILLION)
TABLE 53. AUSTRALIA SOFTWARE DEFINED PERIMETER MARKET SIZE, BY COMPONENT, 2017-2025 (USD MILLION)
TABLE 54. AUSTRALIA SOFTWARE DEFINED PERIMETER MARKET SIZE, BY DEPLOYMENT, 2017-2025 (USD MILLION)
TABLE 55. AUSTRALIA SOFTWARE DEFINED PERIMETER MARKET SIZE, BY END USER, 2017-2025 (USD MILLION)
TABLE 56. CHINA SOFTWARE DEFINED PERIMETER MARKET SIZE, BY ENFORCEMENT POINT, 2017-2025 (USD MILLION)
TABLE 57. CHINA SOFTWARE DEFINED PERIMETER MARKET SIZE, BY COMPONENT, 2017-2025 (USD MILLION)
TABLE 58. CHINA SOFTWARE DEFINED PERIMETER MARKET SIZE, BY DEPLOYMENT, 2017-2025 (USD MILLION)
TABLE 59. CHINA SOFTWARE DEFINED PERIMETER MARKET SIZE, BY END USER, 2017-2025 (USD MILLION)
TABLE 60. INDIA SOFTWARE DEFINED PERIMETER MARKET SIZE, BY ENFORCEMENT POINT, 2017-2025 (USD MILLION)
TABLE 61. INDIA SOFTWARE DEFINED PERIMETER MARKET SIZE, BY COMPONENT, 2017-2025 (USD MILLION)
TABLE 62. INDIA SOFTWARE DEFINED PERIMETER MARKET SIZE, BY DEPLOYMENT, 2017-2025 (USD MILLION)
TABLE 63. INDIA SOFTWARE DEFINED PERIMETER MARKET SIZE, BY END USER, 2017-2025 (USD MILLION)
TABLE 64. INDONESIA SOFTWARE DEFINED PERIMETER MARKET SIZE, BY ENFORCEMENT POINT, 2017-2025 (USD MILLION)
TABLE 65. INDONESIA SOFTWARE DEFINED PERIMETER MARKET SIZE, BY COMPONENT, 2017-2025 (USD MILLION)
TABLE 66. INDONESIA SOFTWARE DEFINED PERIMETER MARKET SIZE, BY DEPLOYMENT, 2017-2025 (USD MILLION)
TABLE 67. INDONESIA SOFTWARE DEFINED PERIMETER MARKET SIZE, BY END USER, 2017-2025 (USD MILLION)
TABLE 68. JAPAN SOFTWARE DEFINED PERIMETER MARKET SIZE, BY ENFORCEMENT POINT, 2017-2025 (USD MILLION)
TABLE 69. JAPAN SOFTWARE DEFINED PERIMETER MARKET SIZE, BY COMPONENT, 2017-2025 (USD MILLION)
TABLE 70. JAPAN SOFTWARE DEFINED PERIMETER MARKET SIZE, BY DEPLOYMENT, 2017-2025 (USD MILLION)
TABLE 71. JAPAN SOFTWARE DEFINED PERIMETER MARKET SIZE, BY END USER, 2017-2025 (USD MILLION)
TABLE 72. MALAYSIA SOFTWARE DEFINED PERIMETER MARKET SIZE, BY ENFORCEMENT POINT, 2017-2025 (USD MILLION)
TABLE 73. MALAYSIA SOFTWARE DEFINED PERIMETER MARKET SIZE, BY COMPONENT, 2017-2025 (USD MILLION)
TABLE 74. MALAYSIA SOFTWARE DEFINED PERIMETER MARKET SIZE, BY DEPLOYMENT, 2017-2025 (USD MILLION)
TABLE 75. MALAYSIA SOFTWARE DEFINED PERIMETER MARKET SIZE, BY END USER, 2017-2025 (USD MILLION)
TABLE 76. PHILIPPINES SOFTWARE DEFINED PERIMETER MARKET SIZE, BY ENFORCEMENT POINT, 2017-2025 (USD MILLION)
TABLE 77. PHILIPPINES SOFTWARE DEFINED PERIMETER MARKET SIZE, BY COMPONENT, 2017-2025 (USD MILLION)
TABLE 78. PHILIPPINES SOFTWARE DEFINED PERIMETER MARKET SIZE, BY DEPLOYMENT, 2017-2025 (USD MILLION)
TABLE 79. PHILIPPINES SOFTWARE DEFINED PERIMETER MARKET SIZE, BY END USER, 2017-2025 (USD MILLION)
TABLE 80. SOUTH KOREA SOFTWARE DEFINED PERIMETER MARKET SIZE, BY ENFORCEMENT POINT, 2017-2025 (USD MILLION)
TABLE 81. SOUTH KOREA SOFTWARE DEFINED PERIMETER MARKET SIZE, BY COMPONENT, 2017-2025 (USD MILLION)
TABLE 82. SOUTH KOREA SOFTWARE DEFINED PERIMETER MARKET SIZE, BY DEPLOYMENT, 2017-2025 (USD MILLION)
TABLE 83. SOUTH KOREA SOFTWARE DEFINED PERIMETER MARKET SIZE, BY END USER, 2017-2025 (USD MILLION)
TABLE 84. THAILAND SOFTWARE DEFINED PERIMETER MARKET SIZE, BY ENFORCEMENT POINT, 2017-2025 (USD MILLION)
TABLE 85. THAILAND SOFTWARE DEFINED PERIMETER MARKET SIZE, BY COMPONENT, 2017-2025 (USD MILLION)
TABLE 86. THAILAND SOFTWARE DEFINED PERIMETER MARKET SIZE, BY DEPLOYMENT, 2017-2025 (USD MILLION)
TABLE 87. THAILAND SOFTWARE DEFINED PERIMETER MARKET SIZE, BY END USER, 2017-2025 (USD MILLION)
TABLE 88. EUROPE, MIDDLE EAST & AFRICA SOFTWARE DEFINED PERIMETER MARKET SIZE, BY GEOGRAPHY, 2017-2025 (USD MILLION)
TABLE 89. EUROPE, MIDDLE EAST & AFRICA SOFTWARE DEFINED PERIMETER MARKET SIZE, BY ENFORCEMENT POINT, 2017-2025 (USD MILLION)
TABLE 90. EUROPE, MIDDLE EAST & AFRICA SOFTWARE DEFINED PERIMETER MARKET SIZE, BY COMPONENT, 2017-2025 (USD MILLION)
TABLE 91. EUROPE, MIDDLE EAST & AFRICA SOFTWARE DEFINED PERIMETER MARKET SIZE, BY DEPLOYMENT, 2017-2025 (USD MILLION)
TABLE 92. EUROPE, MIDDLE EAST & AFRICA SOFTWARE DEFINED PERIMETER MARKET SIZE, BY END USER, 2017-2025 (USD MILLION)
TABLE 93. FRANCE SOFTWARE DEFINED PERIMETER MARKET SIZE, BY ENFORCEMENT POINT, 2017-2025 (USD MILLION)
TABLE 94. FRANCE SOFTWARE DEFINED PERIMETER MARKET SIZE, BY COMPONENT, 2017-2025 (USD MILLION)
TABLE 95. FRANCE SOFTWARE DEFINED PERIMETER MARKET SIZE, BY DEPLOYMENT, 2017-2025 (USD MILLION)
TABLE 96. FRANCE SOFTWARE DEFINED PERIMETER MARKET SIZE, BY END USER, 2017-2025 (USD MILLION)
TABLE 97. GERMANY SOFTWARE DEFINED PERIMETER MARKET SIZE, BY ENFORCEMENT POINT, 2017-2025 (USD MILLION)
TABLE 98. GERMANY SOFTWARE DEFINED PERIMETER MARKET SIZE, BY COMPONENT, 2017-2025 (USD MILLION)
TABLE 99. GERMANY SOFTWARE DEFINED PERIMETER MARKET SIZE, BY DEPLOYMENT, 2017-2025 (USD MILLION)
TABLE 100. GERMANY SOFTWARE DEFINED PERIMETER MARKET SIZE, BY END USER, 2017-2025 (USD MILLION)
TABLE 101. ITALY SOFTWARE DEFINED PERIMETER MARKET SIZE, BY ENFORCEMENT POINT, 2017-2025 (USD MILLION)
TABLE 102. ITALY SOFTWARE DEFINED PERIMETER MARKET SIZE, BY COMPONENT, 2017-2025 (USD MILLION)
TABLE 103. ITALY SOFTWARE DEFINED PERIMETER MARKET SIZE, BY DEPLOYMENT, 2017-2025 (USD MILLION)
TABLE 104. ITALY SOFTWARE DEFINED PERIMETER MARKET SIZE, BY END USER, 2017-2025 (USD MILLION)
TABLE 105. NETHERLANDS SOFTWARE DEFINED PERIMETER MARKET SIZE, BY ENFORCEMENT POINT, 2017-2025 (USD MILLION)
TABLE 106. NETHERLANDS SOFTWARE DEFINED PERIMETER MARKET SIZE, BY COMPONENT, 2017-2025 (USD MILLION)
TABLE 107. NETHERLANDS SOFTWARE DEFINED PERIMETER MARKET SIZE, BY DEPLOYMENT, 2017-2025 (USD MILLION)
TABLE 108. NETHERLANDS SOFTWARE DEFINED PERIMETER MARKET SIZE, BY END USER, 2017-2025 (USD MILLION)
TABLE 109. QATAR SOFTWARE DEFINED PERIMETER MARKET SIZE, BY ENFORCEMENT POINT, 2017-2025 (USD MILLION)
TABLE 110. QATAR SOFTWARE DEFINED PERIMETER MARKET SIZE, BY COMPONENT, 2017-2025 (USD MILLION)
TABLE 111. QATAR SOFTWARE DEFINED PERIMETER MARKET SIZE, BY DEPLOYMENT, 2017-2025 (USD MILLION)
TABLE 112. QATAR SOFTWARE DEFINED PERIMETER MARKET SIZE, BY END USER, 2017-2025 (USD MILLION)
TABLE 113. RUSSIA SOFTWARE DEFINED PERIMETER MARKET SIZE, BY ENFORCEMENT POINT, 2017-2025 (USD MILLION)
TABLE 114. RUSSIA SOFTWARE DEFINED PERIMETER MARKET SIZE, BY COMPONENT, 2017-2025 (USD MILLION)
TABLE 115. RUSSIA SOFTWARE DEFINED PERIMETER MARKET SIZE, BY DEPLOYMENT, 2017-2025 (USD MILLION)
TABLE 116. RUSSIA SOFTWARE DEFINED PERIMETER MARKET SIZE, BY END USER, 2017-2025 (USD MILLION)
TABLE 117. SAUDI ARABIA SOFTWARE DEFINED PERIMETER MARKET SIZE, BY ENFORCEMENT POINT, 2017-2025 (USD MILLION)
TABLE 118. SAUDI ARABIA SOFTWARE DEFINED PERIMETER MARKET SIZE, BY COMPONENT, 2017-2025 (USD MILLION)
TABLE 119. SAUDI ARABIA SOFTWARE DEFINED PERIMETER MARKET SIZE, BY DEPLOYMENT, 2017-2025 (USD MILLION)
TABLE 120. SAUDI ARABIA SOFTWARE DEFINED PERIMETER MARKET SIZE, BY END USER, 2017-2025 (USD MILLION)
TABLE 121. SOUTH AFRICA SOFTWARE DEFINED PERIMETER MARKET SIZE, BY ENFORCEMENT POINT, 2017-2025 (USD MILLION)
TABLE 122. SOUTH AFRICA SOFTWARE DEFINED PERIMETER MARKET SIZE, BY COMPONENT, 2017-2025 (USD MILLION)
TABLE 123. SOUTH AFRICA SOFTWARE DEFINED PERIMETER MARKET SIZE, BY DEPLOYMENT, 2017-2025 (USD MILLION)
TABLE 124. SOUTH AFRICA SOFTWARE DEFINED PERIMETER MARKET SIZE, BY END USER, 2017-2025 (USD MILLION)
TABLE 125. SPAIN SOFTWARE DEFINED PERIMETER MARKET SIZE, BY ENFORCEMENT POINT, 2017-2025 (USD MILLION)
TABLE 126. SPAIN SOFTWARE DEFINED PERIMETER MARKET SIZE, BY COMPONENT, 2017-2025 (USD MILLION)
TABLE 127. SPAIN SOFTWARE DEFINED PERIMETER MARKET SIZE, BY DEPLOYMENT, 2017-2025 (USD MILLION)
TABLE 128. SPAIN SOFTWARE DEFINED PERIMETER MARKET SIZE, BY END USER, 2017-2025 (USD MILLION)
TABLE 129. UNITED ARAB EMIRATES SOFTWARE DEFINED PERIMETER MARKET SIZE, BY ENFORCEMENT POINT, 2017-2025 (USD MILLION)
TABLE 130. UNITED ARAB EMIRATES SOFTWARE DEFINED PERIMETER MARKET SIZE, BY COMPONENT, 2017-2025 (USD MILLION)
TABLE 131. UNITED ARAB EMIRATES SOFTWARE DEFINED PERIMETER MARKET SIZE, BY DEPLOYMENT, 2017-2025 (USD MILLION)
TABLE 132. UNITED ARAB EMIRATES SOFTWARE DEFINED PERIMETER MARKET SIZE, BY END USER, 2017-2025 (USD MILLION)
TABLE 133. UNITED KINGDOM SOFTWARE DEFINED PERIMETER MARKET SIZE, BY ENFORCEMENT POINT, 2017-2025 (USD MILLION)
TABLE 134. UNITED KINGDOM SOFTWARE DEFINED PERIMETER MARKET SIZE, BY COMPONENT, 2017-2025 (USD MILLION)
TABLE 135. UNITED KINGDOM SOFTWARE DEFINED PERIMETER MARKET SIZE, BY DEPLOYMENT, 2017-2025 (USD MILLION)
TABLE 136. UNITED KINGDOM SOFTWARE DEFINED PERIMETER MARKET SIZE, BY END USER, 2017-2025 (USD MILLION)
TABLE 137. GLOBAL SOFTWARE DEFINED PERIMETER MARKET: SCORES
TABLE 138. GLOBAL SOFTWARE DEFINED PERIMETER MARKET: BUSINESS STRATEGY
TABLE 139. GLOBAL SOFTWARE DEFINED PERIMETER MARKET: PRODUCT SATISFACTION
TABLE 140. GLOBAL SOFTWARE DEFINED PERIMETER MARKET: RANKING
TABLE 141. GLOBAL SOFTWARE DEFINED PERIMETER MARKET: MERGER & ACQUISITION
TABLE 142. GLOBAL SOFTWARE DEFINED PERIMETER MARKET: AGREEMENT, COLLABORATION, & PARTNERSHIP
TABLE 143. GLOBAL SOFTWARE DEFINED PERIMETER MARKET: NEW PRODUCT LAUNCH & ENHANCEMENT
TABLE 144. GLOBAL SOFTWARE DEFINED PERIMETER MARKET: INVESTMENT & FUNDING
TABLE 145. GLOBAL SOFTWARE DEFINED PERIMETER MARKET: AWARD, RECOGNITION, & EXPANSION
TABLE 146. GLOBAL SOFTWARE DEFINED PERIMETER MARKET: EDITION DETAILS
TABLE 147. GLOBAL SOFTWARE DEFINED PERIMETER MARKET: LICENSE DETAILS
TABLE 148. GLOBAL SOFTWARE DEFINED PERIMETER MARKET: PRICING DETAILS