0
U.S. (TOLL FREE)
+1 (315) 215-3225
Automative

0
U.S. (TOLL FREE)
+1 (315) 215-3225
Rocket Propulsion Market By Orbit (LEO and Elliptical, GEO, MEO), By End Use (Civil and Government, Commercial, Military), By Application (Communication, Earth Observation, Navigation, Global Positioning System (GPS) and Surveillance, Technology Development and Education, Others), By Propulsion (Solid, Liquid, Hybrid): Global Opportunity Analysis and Industry Forecast, 2021-2031
Published Date: November 2022
|
Report Code: ALLI-Auto-0B898
Home | Market Reports | Business & Industrial| Aerospace & Defense| Space Technology
Rocket Propulsion Market By Orbit LEO and Elliptical GEO MEO By End Use Civil and Government Commercial Military By Application Communication Earth Observation Navigation Global Positioning System GPS and Surveillance Technology Development and Education Others By Propulsion Solid Liquid Hybrid Global Opportunity Analysis and Industry Forecast 2021 2031
BUY CHAPTERS

Rocket Propulsion Market By Orbit (LEO and Elliptical, GEO, MEO), By End Use (Civil and Government, Commercial, Military), By Application (Communication, Earth Observation, Navigation, Global Positioning System (GPS) and Surveillance, Technology Development and Education, Others), By Propulsion (Solid, Liquid, Hybrid): Global Opportunity Analysis and Industry Forecast, 2021-2031

Code: ALLI-Auto-0B898
Report
November 2022
Pages:238
Allied Market Research
Buy Now with 15% Discount
DESCRIPTION
TABLE OF CONTENT
TABLES & FIGURES

Rocket Propulsion Market Size

By orbit, the LEO and elliptical segment was the highest revenue contributor to the market, and is estimated to reach $6.68 billion by 2031, with a CAGR of 5.6%.

Rocket Propulsion Market

Rocket Propulsion Market

The rocket propulsion market is expected to experience a significant growth rate of 5.3% from 2022-2031, owing to increase in space launch activities and rise in investments in space sector–
Rocket propulsion is a method used to send a projectile and out space while breaking earth’s gravity. The propulsion system used in rockets generate an enormous push; thus, lifting the rocket from ground and propelling it in space. A rocket can be aircraft, spacecraft, missile, or a vehicle which generates thrust. Thrust is generated by propulsion system of the rocket. Rocket engines use three states of propellants: solid, liquid, and hybrid (combination of solid and liquid propellants). Solid rocket engines use solid fuels, generate high thrust, and are more reliable than other propulsion systems. However, solid rocket engines do not have the capability of restart. While liquid rocket engine uses liquid fuel, generates lots of thrust, and are more controllable than solid propellant rockets. However, liquid rocket engines have complex design and thereby having high costs. Hybrid propulsion system in rockets uses both solid & liquid fuel in two different phases. Hybrid rocket engines possess capabilities of both solid & liquid propulsion systems. The rocket propulsion system dates backs thousands of years, but the accelerated growth and technological innovations in modern rocketry began in past decade. These systems are used for several operations such as launching vehicles to space, placing artificial satellite in orbit, human space flight and space exploration.
The key factors driving the growth of the rocket propulsion market include increase in space exploration mission and increase in requirement of global connectivity communication-based satellite constellations, which creates lucrative opportunities for the growth of the market across the globe. Moreover, the factors such as technological advancement of peripheral components, increase in defense budget allocation, usage of life extension vehicle, increase in satellite launch activities and adoption of SWaP in manufacturing operations also propels the market toward a positive growth across the globe.
The rising implementation of CubeSats, which are modular and small satellites with easier to launch and reduced costs has boosted the constellations popularity. SpaceX is a known as major player for its Starlink constellation, which is established to provide internet access to remote places. The company launched 1,500 satellites and more are scheduled to be launched. The use of satellites for national security, remote sensing, earth observation, government communications, R&D, telecommunication, space observation, and surveillance has fueled the growth of the satellite industry.
The rocket propulsion market is segmented into orbit, end use, application, propulsion, and region. By orbit, the market is divided into LEO and Elliptical, GEO, and MEO. By End Use, it is segmented into civil and government, commercial, and military. By application, it is categorized into communication, earth observation, navigation, global positioning system (GPS) and surveillance, technology development and education, and others. By propulsion, it is classified into solid, liquid, and hybrid. By region, it is analyzed across North America (U.S., Canada and Mexico), Europe (Germany, France, Italy, Spain, Russia, UK, Rest of Europe), Asia-Pacific (China, India, Japan, South Korea, Rest of Asia-Pacific), and LAMEA (Latin America, Middle East and Africa).
The key players profiled in the study include Airbus, Blue Origin, Boeing, Mitsubishi Heavy Industries, Moog Inc., Northrop Grumman, Rocket Lab USA, SAFRAN S.A., SpaceX, and Virgin Galactic. The players in the market have been actively engaged in the adoption of various strategies such as acquisition, product launch, and expansion to remain competitive and gain advantage over the competitors in the market. For instance, in August 2022, Northrop Grumman Corporation and Firefly Aerospace joined forces to offer an American-built first-stage upgrade for the Antares rocket and a new medium launch vehicle to serve commercial, civil, and national security space launch markets.
Key Market Insights
However, the MEO segment is estimated to hold a CAGR of 4.3% during the forecast period.
By end use, the civil and government segment dominated the global market, and is estimated to reach $1.62 billion by 2031, with a CAGR of 5.4%. However, the military segment is expected to be the fastest growing segment with the CAGR of 4.5% during the forecast period.
By application, the communication segment was the highest revenue contributor to the market, with $2.38 billion in 2021, and is estimated to reach $4.13 billion by 2031, with a CAGR of 5.9%.
By propulsion, the liquid segment was the highest revenue contributor to the market, with $2.22 billion in 2021, and is estimated to reach $3.57 billion, with a CAGR of 5.1% from 2022 to 2031.
By region, North America was the highest revenue contributor, accounting for $2.33 billion in 2021, and is estimated to reach $3.89 billion by 2031, with a CAGR of 5.5%.

Overview

Rocket propulsion is a method used to send a projectile and out space while breaking earth’s gravity. The propulsion system used in rockets generate an enormous forwards push thus lifting the rocket from ground and propelling it towards space. A rocket can be aircraft, spacecraft, missile, or a vehicle which generates thrust. Thrust is generated by propulsion system of the rocket. Rocket engines use three states of propellants: solid, liquid, and hybrid (combination of solid and liquid propellants). Solid rocket engines use solid fuels, generates high thrust, and are more reliable than other propulsion systems. However, solid rocket engines do not have the capability of restart. While liquid rocket engine uses liquid fuel, generates lots of thrust, and are more controllable than solid propellant rockets. However, liquid rocket engines have complex design and thereby having high costs. Hybrid propulsion system in rockets uses both solid & liquid fuel in two different phases. Hybrid rocket engines possess capabilities of both solid & liquid propulsion systems. The rocket propulsion system dates backs thousands of years, but the accelerated growth and technological innovations in modern rocketry began in past decade. These systems are used for several operations such as launching vehicles to space, placing artificial satellite in orbit, human space flight and space exploration.
For the purpose of analysis, the global rocket propulsion market is segmented into orbit, end-use, application, propulsion, and region. By orbit, the market is classified into LEO & Elliptical, GEO, MEO. Depending on end use, it is segregated into commercial, military, and civil and government. On the basis of application, it is fragmented into communication, earth observation, navigation, global positioning system (GPS) and surveillance, technology development and education, and others. Depending on end use, it is segregated into solid, liquid, and hybrid. Region wise, it is analyzed across North America, Europe, Asia-Pacific, and LAMEA.
Growth drivers, restraints, and opportunities are explained in the study to better understand the market dynamics. This study further highlights key areas of investment. In addition, it includes Porter’s five forces analysis to understand the competitive scenario of the industry and the role of each stakeholder. The study features strategies adopted by key market players to maintain their foothold in the market.
Companies have adopted product development, collaboration, and long-term agreements as their key development strategies. The key players profiled in this report include Airbus, Blue Origin, Boeing, Mitsubishi Heavy Industries, Moog Inc., Northrop Grumman, Rocket Lab USA, SAFRAN S.A., SpaceX, and Virgin Galactic.

Key Benefits For Stakeholders

●This study presents analytical depiction of the global rocket propulsion market analysis along with current trends and future estimations to depict imminent investment pockets.
●The overall rocket propulsion market opportunity is determined by understanding profitable trends to gain a stronger foothold.
●The report presents information related to the key drivers, restraints, and opportunities of the global rocket propulsion market with a detailed impact analysis.
●The current rocket propulsion market is quantitatively analyzed from 2022 to 2031 to benchmark the financial competency.
●Porter’s five forces analysis illustrates the potency of the buyers and suppliers in the industry.
Key Market Segments
○ Blue Origi

Scope of Rocket Propulsion Market Report

Report Metric Details
Report Name Rocket Propulsion Market
Forecasted market size in 2031 $ 6.68 billion
CAGR 5.6%
Forecasted years 2024 - 2031
By Orbit ● LEO and Elliptical
● GEO
● MEO
By End Use ● Civil and Government
● Commercial
● Military
By Application ● Communication
● Earth Observation
● Navigation, Global Positioning System (GPS) and Surveillance
● Technology Development and Education
● Others
By Propulsion ● Solid
● Liquid
● Hybrid
By Region
  • North America (United States, Canada)
  • Europe (Germany, France, UK, Italy, Russia) Rest of Europe
  • Nordic Countries
  • Asia-Pacific (China, Japan, South Korea)
  • Southeast Asia (India, Australia)
  • Rest of Asia
  • Latin America (Mexico, Brazil)
  • Rest of Latin America
  • Middle East & Africa (Turkey, Saudi Arabia, UAE, Rest of MEA)
Forecast units USD million in value
Report coverage Revenue and volume forecast, company share, competitive landscape, growth factors and trends

FAQ for this report

What is the Rocket Propulsion Market size in 2031?

Ans: The Rocket Propulsion Market size in 2031 will be $ 6.68 billion.

What are the Application segmentation covered in the Rocket Propulsion Market report?

Ans: The Applications covered in the Rocket Propulsion Market report are ● Communication, ● Earth Observation, ● Navigation, Global Positioning System (GPS) and Surveillance, ● Technology Development and Education, ● Others

CHAPTER 1:INTRODUCTION
1.1.Report description
1.2.Key market segments
1.3.Key benefits to the stakeholders
1.4.Research Methodology
1.4.1.Secondary research
1.4.2.Primary research
1.4.3.Analyst tools and models
CHAPTER 2:EXECUTIVE SUMMARY
2.1.Key findings of the study
2.2.CXO Perspective
CHAPTER 3:MARKET OVERVIEW
3.1.Market definition and scope
3.2.Key findings
3.2.1.Top investment pockets
3.3.Porter’s five forces analysis
3.4.Top player positioning
3.5.Market dynamics
3.5.1.Drivers
3.5.2.Restraints
3.5.3.Opportunities
3.6.COVID-19 Impact Analysis on the market
CHAPTER 4: ROCKET PROPULSION MARKET, BY ORBIT
4.1 Overview
4.1.1 Market size and forecast
4.2 LEO and Elliptical
4.2.1 Key market trends, growth factors and opportunities
4.2.2 Market size and forecast, by region
4.2.3 Market share analysis by country
4.3 GEO
4.3.1 Key market trends, growth factors and opportunities
4.3.2 Market size and forecast, by region
4.3.3 Market share analysis by country
4.4 MEO
4.4.1 Key market trends, growth factors and opportunities
4.4.2 Market size and forecast, by region
4.4.3 Market share analysis by country
CHAPTER 5: ROCKET PROPULSION MARKET, BY END USE
5.1 Overview
5.1.1 Market size and forecast
5.2 Civil and Government
5.2.1 Key market trends, growth factors and opportunities
5.2.2 Market size and forecast, by region
5.2.3 Market share analysis by country
5.3 Commercial
5.3.1 Key market trends, growth factors and opportunities
5.3.2 Market size and forecast, by region
5.3.3 Market share analysis by country
5.4 Military
5.4.1 Key market trends, growth factors and opportunities
5.4.2 Market size and forecast, by region
5.4.3 Market share analysis by country
CHAPTER 6: ROCKET PROPULSION MARKET, BY APPLICATION
6.1 Overview
6.1.1 Market size and forecast
6.2 Communication
6.2.1 Key market trends, growth factors and opportunities
6.2.2 Market size and forecast, by region
6.2.3 Market share analysis by country
6.3 Earth Observation
6.3.1 Key market trends, growth factors and opportunities
6.3.2 Market size and forecast, by region
6.3.3 Market share analysis by country
6.4 Navigation, Global Positioning System (GPS) and Surveillance
6.4.1 Key market trends, growth factors and opportunities
6.4.2 Market size and forecast, by region
6.4.3 Market share analysis by country
6.5 Technology Development and Education
6.5.1 Key market trends, growth factors and opportunities
6.5.2 Market size and forecast, by region
6.5.3 Market share analysis by country
6.6 Others
6.6.1 Key market trends, growth factors and opportunities
6.6.2 Market size and forecast, by region
6.6.3 Market share analysis by country
CHAPTER 7: ROCKET PROPULSION MARKET, BY PROPULSION
7.1 Overview
7.1.1 Market size and forecast
7.2 Solid
7.2.1 Key market trends, growth factors and opportunities
7.2.2 Market size and forecast, by region
7.2.3 Market share analysis by country
7.3 Liquid
7.3.1 Key market trends, growth factors and opportunities
7.3.2 Market size and forecast, by region
7.3.3 Market share analysis by country
7.4 Hybrid
7.4.1 Key market trends, growth factors and opportunities
7.4.2 Market size and forecast, by region
7.4.3 Market share analysis by country
CHAPTER 8: ROCKET PROPULSION MARKET, BY REGION
8.1 Overview
8.1.1 Market size and forecast
8.2 North America
8.2.1 Key trends and opportunities
8.2.2 North America Market size and forecast, by Orbit
8.2.3 North America Market size and forecast, by End Use
8.2.4 North America Market size and forecast, by Application
8.2.5 North America Market size and forecast, by Propulsion
8.2.6 North America Market size and forecast, by country
8.2.6.1 U.S.
8.2.6.1.1 Key market trends, growth factors and opportunities
8.2.6.1.2 Market size and forecast, by Orbit
8.2.6.1.3 Market size and forecast, by End Use
8.2.6.1.4 Market size and forecast, by Application
8.2.6.1.5 Market size and forecast, by Propulsion
8.2.6.2 Canada
8.2.6.2.1 Key market trends, growth factors and opportunities
8.2.6.2.2 Market size and forecast, by Orbit
8.2.6.2.3 Market size and forecast, by End Use
8.2.6.2.4 Market size and forecast, by Application
8.2.6.2.5 Market size and forecast, by Propulsion
8.2.6.3 Mexico
8.2.6.3.1 Key market trends, growth factors and opportunities
8.2.6.3.2 Market size and forecast, by Orbit
8.2.6.3.3 Market size and forecast, by End Use
8.2.6.3.4 Market size and forecast, by Application
8.2.6.3.5 Market size and forecast, by Propulsion
8.3 Europe
8.3.1 Key trends and opportunities
8.3.2 Europe Market size and forecast, by Orbit
8.3.3 Europe Market size and forecast, by End Use
8.3.4 Europe Market size and forecast, by Application
8.3.5 Europe Market size and forecast, by Propulsion
8.3.6 Europe Market size and forecast, by country
8.3.6.1 Germany
8.3.6.1.1 Key market trends, growth factors and opportunities
8.3.6.1.2 Market size and forecast, by Orbit
8.3.6.1.3 Market size and forecast, by End Use
8.3.6.1.4 Market size and forecast, by Application
8.3.6.1.5 Market size and forecast, by Propulsion
8.3.6.2 France
8.3.6.2.1 Key market trends, growth factors and opportunities
8.3.6.2.2 Market size and forecast, by Orbit
8.3.6.2.3 Market size and forecast, by End Use
8.3.6.2.4 Market size and forecast, by Application
8.3.6.2.5 Market size and forecast, by Propulsion
8.3.6.3 Italy
8.3.6.3.1 Key market trends, growth factors and opportunities
8.3.6.3.2 Market size and forecast, by Orbit
8.3.6.3.3 Market size and forecast, by End Use
8.3.6.3.4 Market size and forecast, by Application
8.3.6.3.5 Market size and forecast, by Propulsion
8.3.6.4 Spain
8.3.6.4.1 Key market trends, growth factors and opportunities
8.3.6.4.2 Market size and forecast, by Orbit
8.3.6.4.3 Market size and forecast, by End Use
8.3.6.4.4 Market size and forecast, by Application
8.3.6.4.5 Market size and forecast, by Propulsion
8.3.6.5 Russia
8.3.6.5.1 Key market trends, growth factors and opportunities
8.3.6.5.2 Market size and forecast, by Orbit
8.3.6.5.3 Market size and forecast, by End Use
8.3.6.5.4 Market size and forecast, by Application
8.3.6.5.5 Market size and forecast, by Propulsion
8.3.6.6 UK
8.3.6.6.1 Key market trends, growth factors and opportunities
8.3.6.6.2 Market size and forecast, by Orbit
8.3.6.6.3 Market size and forecast, by End Use
8.3.6.6.4 Market size and forecast, by Application
8.3.6.6.5 Market size and forecast, by Propulsion
8.3.6.7 Rest of Europe
8.3.6.7.1 Key market trends, growth factors and opportunities
8.3.6.7.2 Market size and forecast, by Orbit
8.3.6.7.3 Market size and forecast, by End Use
8.3.6.7.4 Market size and forecast, by Application
8.3.6.7.5 Market size and forecast, by Propulsion
8.4 Asia-Pacific
8.4.1 Key trends and opportunities
8.4.2 Asia-Pacific Market size and forecast, by Orbit
8.4.3 Asia-Pacific Market size and forecast, by End Use
8.4.4 Asia-Pacific Market size and forecast, by Application
8.4.5 Asia-Pacific Market size and forecast, by Propulsion
8.4.6 Asia-Pacific Market size and forecast, by country
8.4.6.1 China
8.4.6.1.1 Key market trends, growth factors and opportunities
8.4.6.1.2 Market size and forecast, by Orbit
8.4.6.1.3 Market size and forecast, by End Use
8.4.6.1.4 Market size and forecast, by Application
8.4.6.1.5 Market size and forecast, by Propulsion
8.4.6.2 India
8.4.6.2.1 Key market trends, growth factors and opportunities
8.4.6.2.2 Market size and forecast, by Orbit
8.4.6.2.3 Market size and forecast, by End Use
8.4.6.2.4 Market size and forecast, by Application
8.4.6.2.5 Market size and forecast, by Propulsion
8.4.6.3 Japan
8.4.6.3.1 Key market trends, growth factors and opportunities
8.4.6.3.2 Market size and forecast, by Orbit
8.4.6.3.3 Market size and forecast, by End Use
8.4.6.3.4 Market size and forecast, by Application
8.4.6.3.5 Market size and forecast, by Propulsion
8.4.6.4 South Korea
8.4.6.4.1 Key market trends, growth factors and opportunities
8.4.6.4.2 Market size and forecast, by Orbit
8.4.6.4.3 Market size and forecast, by End Use
8.4.6.4.4 Market size and forecast, by Application
8.4.6.4.5 Market size and forecast, by Propulsion
8.4.6.5 Rest of Asia-Pacific
8.4.6.5.1 Key market trends, growth factors and opportunities
8.4.6.5.2 Market size and forecast, by Orbit
8.4.6.5.3 Market size and forecast, by End Use
8.4.6.5.4 Market size and forecast, by Application
8.4.6.5.5 Market size and forecast, by Propulsion
8.5 LAMEA
8.5.1 Key trends and opportunities
8.5.2 LAMEA Market size and forecast, by Orbit
8.5.3 LAMEA Market size and forecast, by End Use
8.5.4 LAMEA Market size and forecast, by Application
8.5.5 LAMEA Market size and forecast, by Propulsion
8.5.6 LAMEA Market size and forecast, by country
8.5.6.1 Latin America
8.5.6.1.1 Key market trends, growth factors and opportunities
8.5.6.1.2 Market size and forecast, by Orbit
8.5.6.1.3 Market size and forecast, by End Use
8.5.6.1.4 Market size and forecast, by Application
8.5.6.1.5 Market size and forecast, by Propulsion
8.5.6.2 Middle East
8.5.6.2.1 Key market trends, growth factors and opportunities
8.5.6.2.2 Market size and forecast, by Orbit
8.5.6.2.3 Market size and forecast, by End Use
8.5.6.2.4 Market size and forecast, by Application
8.5.6.2.5 Market size and forecast, by Propulsion
8.5.6.3 Africa
8.5.6.3.1 Key market trends, growth factors and opportunities
8.5.6.3.2 Market size and forecast, by Orbit
8.5.6.3.3 Market size and forecast, by End Use
8.5.6.3.4 Market size and forecast, by Application
8.5.6.3.5 Market size and forecast, by Propulsion
CHAPTER 9: COMPANY LANDSCAPE
9.1. Introduction
9.2. Top winning strategies
9.3. Product Mapping of Top 10 Player
9.4. Competitive Dashboard
9.5. Competitive Heatmap
9.6. Key developments
CHAPTER 10: COMPANY PROFILES
10.1 Airbus
10.1.1 Company overview
10.1.2 Company snapshot
10.1.3 Operating business segments
10.1.4 Product portfolio
10.1.5 Business performance
10.1.6 Key strategic moves and developments
10.2 Rocket Lab USA
10.2.1 Company overview
10.2.2 Company snapshot
10.2.3 Operating business segments
10.2.4 Product portfolio
10.2.5 Business performance
10.2.6 Key strategic moves and developments
10.3 Boeing Company
10.3.1 Company overview
10.3.2 Company snapshot
10.3.3 Operating business segments
10.3.4 Product portfolio
10.3.5 Business performance
10.3.6 Key strategic moves and developments
10.4 Mitsubishi Heavy Industries
10.4.1 Company overview
10.4.2 Company snapshot
10.4.3 Operating business segments
10.4.4 Product portfolio
10.4.5 Business performance
10.4.6 Key strategic moves and developments
10.5 Spacex
10.5.1 Company overview
10.5.2 Company snapshot
10.5.3 Operating business segments
10.5.4 Product portfolio
10.5.5 Business performance
10.5.6 Key strategic moves and developments
10.6 Blue Origin
10.6.1 Company overview
10.6.2 Company snapshot
10.6.3 Operating business segments
10.6.4 Product portfolio
10.6.5 Business performance
10.6.6 Key strategic moves and developments
10.7 Virgin Gallactic
10.7.1 Company overview
10.7.2 Company snapshot
10.7.3 Operating business segments
10.7.4 Product portfolio
10.7.5 Business performance
10.7.6 Key strategic moves and developments
10.8 Northrop Grumman
10.8.1 Company overview
10.8.2 Company snapshot
10.8.3 Operating business segments
10.8.4 Product portfolio
10.8.5 Business performance
10.8.6 Key strategic moves and developments
10.9 Moog Inc.
10.9.1 Company overview
10.9.2 Company snapshot
10.9.3 Operating business segments
10.9.4 Product portfolio
10.9.5 Business performance
10.9.6 Key strategic moves and developments
10.10 Safran S.A.
10.10.1 Company overview
10.10.2 Company snapshot
10.10.3 Operating business segments
10.10.4 Product portfolio
10.10.5 Business performance
10.10.6 Key strategic moves and development
LIST OF TABLES
TABLE 1. GLOBAL ROCKET PROPULSION MARKET, BY ORBIT, 2021-2031 (REVENUE, $MILLION)
TABLE 2. ROCKET PROPULSION MARKET FOR LEO AND ELLIPTICAL, BY REGION, 2021-2031 (REVENUE, $MILLION)
TABLE 3. ROCKET PROPULSION MARKET FOR LEO AND ELLIPTICAL, BY COUNTRY, 2021-2031 (REVENUE, $MILLION)
TABLE 4. ROCKET PROPULSION MARKET FOR GEO, BY REGION, 2021-2031 (REVENUE, $MILLION)
TABLE 5. ROCKET PROPULSION MARKET FOR GEO, BY COUNTRY, 2021-2031 (REVENUE, $MILLION)
TABLE 6. ROCKET PROPULSION MARKET FOR MEO, BY REGION, 2021-2031 (REVENUE, $MILLION)
TABLE 7. ROCKET PROPULSION MARKET FOR MEO, BY COUNTRY, 2021-2031 (REVENUE, $MILLION)
TABLE 8. GLOBAL ROCKET PROPULSION MARKET, BY END USE, 2021-2031 (REVENUE, $MILLION)
TABLE 9. ROCKET PROPULSION MARKET FOR CIVIL AND GOVERNMENT, BY REGION, 2021-2031 (REVENUE, $MILLION)
TABLE 10. ROCKET PROPULSION MARKET FOR CIVIL AND GOVERNMENT, BY COUNTRY, 2021-2031 (REVENUE, $MILLION)
TABLE 11. ROCKET PROPULSION MARKET FOR COMMERCIAL, BY REGION, 2021-2031 (REVENUE, $MILLION)
TABLE 12. ROCKET PROPULSION MARKET FOR COMMERCIAL, BY COUNTRY, 2021-2031 (REVENUE, $MILLION)
TABLE 13. ROCKET PROPULSION MARKET FOR MILITARY, BY REGION, 2021-2031 (REVENUE, $MILLION)
TABLE 14. ROCKET PROPULSION MARKET FOR MILITARY, BY COUNTRY, 2021-2031 (REVENUE, $MILLION)
TABLE 15. GLOBAL ROCKET PROPULSION MARKET, BY APPLICATION, 2021-2031 (REVENUE, $MILLION)
TABLE 16. ROCKET PROPULSION MARKET FOR COMMUNICATION, BY REGION, 2021-2031 (REVENUE, $MILLION)
TABLE 17. ROCKET PROPULSION MARKET FOR COMMUNICATION, BY COUNTRY, 2021-2031 (REVENUE, $MILLION)
TABLE 18. ROCKET PROPULSION MARKET FOR EARTH OBSERVATION, BY REGION, 2021-2031 (REVENUE, $MILLION)
TABLE 19. ROCKET PROPULSION MARKET FOR EARTH OBSERVATION, BY COUNTRY, 2021-2031 (REVENUE, $MILLION)
TABLE 20. ROCKET PROPULSION MARKET FOR NAVIGATION, GLOBAL POSITIONING SYSTEM (GPS) AND SURVEILLANCE, BY REGION, 2021-2031 (REVENUE, $MILLION)
TABLE 21. ROCKET PROPULSION MARKET FOR NAVIGATION, GLOBAL POSITIONING SYSTEM (GPS) AND SURVEILLANCE, BY COUNTRY, 2021-2031 (REVENUE, $MILLION)
TABLE 22. ROCKET PROPULSION MARKET FOR TECHNOLOGY DEVELOPMENT AND EDUCATION, BY REGION, 2021-2031 (REVENUE, $MILLION)
TABLE 23. ROCKET PROPULSION MARKET FOR TECHNOLOGY DEVELOPMENT AND EDUCATION, BY COUNTRY, 2021-2031 (REVENUE, $MILLION)
TABLE 24. ROCKET PROPULSION MARKET FOR OTHERS, BY REGION, 2021-2031 (REVENUE, $MILLION)
TABLE 25. ROCKET PROPULSION MARKET FOR OTHERS, BY COUNTRY, 2021-2031 (REVENUE, $MILLION)
TABLE 26. GLOBAL ROCKET PROPULSION MARKET, BY PROPULSION, 2021-2031 (REVENUE, $MILLION)
TABLE 27. ROCKET PROPULSION MARKET FOR SOLID, BY REGION, 2021-2031 (REVENUE, $MILLION)
TABLE 28. ROCKET PROPULSION MARKET FOR SOLID, BY COUNTRY, 2021-2031 (REVENUE, $MILLION)
TABLE 29. ROCKET PROPULSION MARKET FOR LIQUID, BY REGION, 2021-2031 (REVENUE, $MILLION)
TABLE 30. ROCKET PROPULSION MARKET FOR LIQUID, BY COUNTRY, 2021-2031 (REVENUE, $MILLION)
TABLE 31. ROCKET PROPULSION MARKET FOR HYBRID, BY REGION, 2021-2031 (REVENUE, $MILLION)
TABLE 32. ROCKET PROPULSION MARKET FOR HYBRID, BY COUNTRY, 2021-2031 (REVENUE, $MILLION)
TABLE 33. ROCKET PROPULSION MARKET, BY REGION, 2021-2031 (REVENUE, $MILLION)
TABLE 34. NORTH AMERICA ROCKET PROPULSION MARKET, BY ORBIT, 2021-2031 (REVENUE, $MILLION)
TABLE 35. NORTH AMERICA ROCKET PROPULSION MARKET, BY END USE, 2021-2031 (REVENUE, $MILLION)
TABLE 36. NORTH AMERICA ROCKET PROPULSION MARKET, BY APPLICATION, 2021-2031 (REVENUE, $MILLION)
TABLE 37. NORTH AMERICA ROCKET PROPULSION MARKET, BY PROPULSION, 2021-2031 (REVENUE, $MILLION)
TABLE 38. NORTH AMERICA ROCKET PROPULSION MARKET, BY COUNTRY, 2021-2031 (REVENUE, $MILLION)
TABLE 39. U.S. ROCKET PROPULSION MARKET, BY ORBIT, 2021-2031 (REVENUE, $MILLION)
TABLE 40. U.S. ROCKET PROPULSION MARKET, BY END USE, 2021-2031 (REVENUE, $MILLION)
TABLE 41. U.S. ROCKET PROPULSION MARKET, BY APPLICATION, 2021-2031 (REVENUE, $MILLION)
TABLE 42. U.S. ROCKET PROPULSION MARKET, BY PROPULSION, 2021-2031 (REVENUE, $MILLION)
TABLE 43. CANADA ROCKET PROPULSION MARKET, BY ORBIT, 2021-2031 (REVENUE, $MILLION)
TABLE 44. CANADA ROCKET PROPULSION MARKET, BY END USE, 2021-2031 (REVENUE, $MILLION)
TABLE 45. CANADA ROCKET PROPULSION MARKET, BY APPLICATION, 2021-2031 (REVENUE, $MILLION)
TABLE 46. CANADA ROCKET PROPULSION MARKET, BY PROPULSION, 2021-2031 (REVENUE, $MILLION)
TABLE 47. MEXICO ROCKET PROPULSION MARKET, BY ORBIT, 2021-2031 (REVENUE, $MILLION)
TABLE 48. MEXICO ROCKET PROPULSION MARKET, BY END USE, 2021-2031 (REVENUE, $MILLION)
TABLE 49. MEXICO ROCKET PROPULSION MARKET, BY APPLICATION, 2021-2031 (REVENUE, $MILLION)
TABLE 50. MEXICO ROCKET PROPULSION MARKET, BY PROPULSION, 2021-2031 (REVENUE, $MILLION)
TABLE 51. EUROPE ROCKET PROPULSION MARKET, BY ORBIT, 2021-2031 (REVENUE, $MILLION)
TABLE 52. EUROPE ROCKET PROPULSION MARKET, BY END USE, 2021-2031 (REVENUE, $MILLION)
TABLE 53. EUROPE ROCKET PROPULSION MARKET, BY APPLICATION, 2021-2031 (REVENUE, $MILLION)
TABLE 54. EUROPE ROCKET PROPULSION MARKET, BY PROPULSION, 2021-2031 (REVENUE, $MILLION)
TABLE 55. EUROPE ROCKET PROPULSION MARKET, BY COUNTRY, 2021-2031 (REVENUE, $MILLION)
TABLE 56. GERMANY ROCKET PROPULSION MARKET, BY ORBIT, 2021-2031 (REVENUE, $MILLION)
TABLE 57. GERMANY ROCKET PROPULSION MARKET, BY END USE, 2021-2031 (REVENUE, $MILLION)
TABLE 58. GERMANY ROCKET PROPULSION MARKET, BY APPLICATION, 2021-2031 (REVENUE, $MILLION)
TABLE 59. GERMANY ROCKET PROPULSION MARKET, BY PROPULSION, 2021-2031 (REVENUE, $MILLION)
TABLE 60. FRANCE ROCKET PROPULSION MARKET, BY ORBIT, 2021-2031 (REVENUE, $MILLION)
TABLE 61. FRANCE ROCKET PROPULSION MARKET, BY END USE, 2021-2031 (REVENUE, $MILLION)
TABLE 62. FRANCE ROCKET PROPULSION MARKET, BY APPLICATION, 2021-2031 (REVENUE, $MILLION)
TABLE 63. FRANCE ROCKET PROPULSION MARKET, BY PROPULSION, 2021-2031 (REVENUE, $MILLION)
TABLE 64. ITALY ROCKET PROPULSION MARKET, BY ORBIT, 2021-2031 (REVENUE, $MILLION)
TABLE 65. ITALY ROCKET PROPULSION MARKET, BY END USE, 2021-2031 (REVENUE, $MILLION)
TABLE 66. ITALY ROCKET PROPULSION MARKET, BY APPLICATION, 2021-2031 (REVENUE, $MILLION)
TABLE 67. ITALY ROCKET PROPULSION MARKET, BY PROPULSION, 2021-2031 (REVENUE, $MILLION)
TABLE 68. SPAIN ROCKET PROPULSION MARKET, BY ORBIT, 2021-2031 (REVENUE, $MILLION)
TABLE 69. SPAIN ROCKET PROPULSION MARKET, BY END USE, 2021-2031 (REVENUE, $MILLION)
TABLE 70. SPAIN ROCKET PROPULSION MARKET, BY APPLICATION, 2021-2031 (REVENUE, $MILLION)
TABLE 71. SPAIN ROCKET PROPULSION MARKET, BY PROPULSION, 2021-2031 (REVENUE, $MILLION)
TABLE 72. RUSSIA ROCKET PROPULSION MARKET, BY ORBIT, 2021-2031 (REVENUE, $MILLION)
TABLE 73. RUSSIA ROCKET PROPULSION MARKET, BY END USE, 2021-2031 (REVENUE, $MILLION)
TABLE 74. RUSSIA ROCKET PROPULSION MARKET, BY APPLICATION, 2021-2031 (REVENUE, $MILLION)
TABLE 75. RUSSIA ROCKET PROPULSION MARKET, BY PROPULSION, 2021-2031 (REVENUE, $MILLION)
TABLE 76. UK ROCKET PROPULSION MARKET, BY ORBIT, 2021-2031 (REVENUE, $MILLION)
TABLE 77. UK ROCKET PROPULSION MARKET, BY END USE, 2021-2031 (REVENUE, $MILLION)
TABLE 78. UK ROCKET PROPULSION MARKET, BY APPLICATION, 2021-2031 (REVENUE, $MILLION)
TABLE 79. UK ROCKET PROPULSION MARKET, BY PROPULSION, 2021-2031 (REVENUE, $MILLION)
TABLE 80. REST OF EUROPE ROCKET PROPULSION MARKET, BY ORBIT, 2021-2031 (REVENUE, $MILLION)
TABLE 81. REST OF EUROPE ROCKET PROPULSION MARKET, BY END USE, 2021-2031 (REVENUE, $MILLION)
TABLE 82. REST OF EUROPE ROCKET PROPULSION MARKET, BY APPLICATION, 2021-2031 (REVENUE, $MILLION)
TABLE 83. REST OF EUROPE ROCKET PROPULSION MARKET, BY PROPULSION, 2021-2031 (REVENUE, $MILLION)
TABLE 84. ASIA-PACIFIC ROCKET PROPULSION MARKET, BY ORBIT, 2021-2031 (REVENUE, $MILLION)
TABLE 85. ASIA-PACIFIC ROCKET PROPULSION MARKET, BY END USE, 2021-2031 (REVENUE, $MILLION)
TABLE 86. ASIA-PACIFIC ROCKET PROPULSION MARKET, BY APPLICATION, 2021-2031 (REVENUE, $MILLION)
TABLE 87. ASIA-PACIFIC ROCKET PROPULSION MARKET, BY PROPULSION, 2021-2031 (REVENUE, $MILLION)
TABLE 88. ASIA-PACIFIC ROCKET PROPULSION MARKET, BY COUNTRY, 2021-2031 (REVENUE, $MILLION)
TABLE 89. CHINA ROCKET PROPULSION MARKET, BY ORBIT, 2021-2031 (REVENUE, $MILLION)
TABLE 90. CHINA ROCKET PROPULSION MARKET, BY END USE, 2021-2031 (REVENUE, $MILLION)
TABLE 91. CHINA ROCKET PROPULSION MARKET, BY APPLICATION, 2021-2031 (REVENUE, $MILLION)
TABLE 92. CHINA ROCKET PROPULSION MARKET, BY PROPULSION, 2021-2031 (REVENUE, $MILLION)
TABLE 93. INDIA ROCKET PROPULSION MARKET, BY ORBIT, 2021-2031 (REVENUE, $MILLION)
TABLE 94. INDIA ROCKET PROPULSION MARKET, BY END USE, 2021-2031 (REVENUE, $MILLION)
TABLE 95. INDIA ROCKET PROPULSION MARKET, BY APPLICATION, 2021-2031 (REVENUE, $MILLION)
TABLE 96. INDIA ROCKET PROPULSION MARKET, BY PROPULSION, 2021-2031 (REVENUE, $MILLION)
TABLE 97. JAPAN ROCKET PROPULSION MARKET, BY ORBIT, 2021-2031 (REVENUE, $MILLION)
TABLE 98. JAPAN ROCKET PROPULSION MARKET, BY END USE, 2021-2031 (REVENUE, $MILLION)
TABLE 99. JAPAN ROCKET PROPULSION MARKET, BY APPLICATION, 2021-2031 (REVENUE, $MILLION)
TABLE 100. JAPAN ROCKET PROPULSION MARKET, BY PROPULSION, 2021-2031 (REVENUE, $MILLION)
TABLE 101. SOUTH KOREA ROCKET PROPULSION MARKET, BY ORBIT, 2021-2031 (REVENUE, $MILLION)
TABLE 102. SOUTH KOREA ROCKET PROPULSION MARKET, BY END USE, 2021-2031 (REVENUE, $MILLION)
TABLE 103. SOUTH KOREA ROCKET PROPULSION MARKET, BY APPLICATION, 2021-2031 (REVENUE, $MILLION)
TABLE 104. SOUTH KOREA ROCKET PROPULSION MARKET, BY PROPULSION, 2021-2031 (REVENUE, $MILLION)
TABLE 105. REST OF ASIA-PACIFIC ROCKET PROPULSION MARKET, BY ORBIT, 2021-2031 (REVENUE, $MILLION)
TABLE 106. REST OF ASIA-PACIFIC ROCKET PROPULSION MARKET, BY END USE, 2021-2031 (REVENUE, $MILLION)
TABLE 107. REST OF ASIA-PACIFIC ROCKET PROPULSION MARKET, BY APPLICATION, 2021-2031 (REVENUE, $MILLION)
TABLE 108. REST OF ASIA-PACIFIC ROCKET PROPULSION MARKET, BY PROPULSION, 2021-2031 (REVENUE, $MILLION)
TABLE 109. LAMEA ROCKET PROPULSION MARKET, BY ORBIT, 2021-2031 (REVENUE, $MILLION)
TABLE 110. LAMEA ROCKET PROPULSION MARKET, BY END USE, 2021-2031 (REVENUE, $MILLION)
TABLE 111. LAMEA ROCKET PROPULSION MARKET, BY APPLICATION, 2021-2031 (REVENUE, $MILLION)
TABLE 112. LAMEA ROCKET PROPULSION MARKET, BY PROPULSION, 2021-2031 (REVENUE, $MILLION)
TABLE 113. LAMEA ROCKET PROPULSION MARKET, BY COUNTRY, 2021-2031 (REVENUE, $MILLION)
TABLE 114. LATIN AMERICA ROCKET PROPULSION MARKET, BY ORBIT, 2021-2031 (REVENUE, $MILLION)
TABLE 115. LATIN AMERICA ROCKET PROPULSION MARKET, BY END USE, 2021-2031 (REVENUE, $MILLION)
TABLE 116. LATIN AMERICA ROCKET PROPULSION MARKET, BY APPLICATION, 2021-2031 (REVENUE, $MILLION)
TABLE 117. LATIN AMERICA ROCKET PROPULSION MARKET, BY PROPULSION, 2021-2031 (REVENUE, $MILLION)
TABLE 118. MIDDLE EAST ROCKET PROPULSION MARKET, BY ORBIT, 2021-2031 (REVENUE, $MILLION)
TABLE 119. MIDDLE EAST ROCKET PROPULSION MARKET, BY END USE, 2021-2031 (REVENUE, $MILLION)
TABLE 120. MIDDLE EAST ROCKET PROPULSION MARKET, BY APPLICATION, 2021-2031 (REVENUE, $MILLION)
TABLE 121. MIDDLE EAST ROCKET PROPULSION MARKET, BY PROPULSION, 2021-2031 (REVENUE, $MILLION)
TABLE 122. AFRICA ROCKET PROPULSION MARKET, BY ORBIT, 2021-2031 (REVENUE, $MILLION)
TABLE 123. AFRICA ROCKET PROPULSION MARKET, BY END USE, 2021-2031 (REVENUE, $MILLION)
TABLE 124. AFRICA ROCKET PROPULSION MARKET, BY APPLICATION, 2021-2031 (REVENUE, $MILLION)
TABLE 125. AFRICA ROCKET PROPULSION MARKET, BY PROPULSION, 2021-2031 (REVENUE, $MILLION)
TABLE 126.AIRBUS: COMPANY SNAPSHOT
TABLE 127.AIRBUS: OPERATING SEGMENTS
TABLE 128.AIRBUS: PRODUCT PORTFOLIO
TABLE 129.AIRBUS: NET SALES
TABLE 130.AIRBUS: KEY STRATERGIES
TABLE 131.ROCKET LAB USA: COMPANY SNAPSHOT
TABLE 132.ROCKET LAB USA: OPERATING SEGMENTS
TABLE 133.ROCKET LAB USA: PRODUCT PORTFOLIO
TABLE 134.ROCKET LAB USA: NET SALES
TABLE 135.ROCKET LAB USA: KEY STRATERGIES
TABLE 136.BOEING COMPANY: COMPANY SNAPSHOT
TABLE 137.BOEING COMPANY: OPERATING SEGMENTS
TABLE 138.BOEING COMPANY: PRODUCT PORTFOLIO
TABLE 139.BOEING COMPANY: NET SALES
TABLE 140.BOEING COMPANY: KEY STRATERGIES
TABLE 141.MITSUBISHI HEAVY INDUSTRIES: COMPANY SNAPSHOT
TABLE 142.MITSUBISHI HEAVY INDUSTRIES: OPERATING SEGMENTS
TABLE 143.MITSUBISHI HEAVY INDUSTRIES: PRODUCT PORTFOLIO
TABLE 144.MITSUBISHI HEAVY INDUSTRIES: NET SALES
TABLE 145.MITSUBISHI HEAVY INDUSTRIES: KEY STRATERGIES
TABLE 146.SPACEX: COMPANY SNAPSHOT
TABLE 147.SPACEX: OPERATING SEGMENTS
TABLE 148.SPACEX: PRODUCT PORTFOLIO
TABLE 149.SPACEX: NET SALES
TABLE 150.SPACEX: KEY STRATERGIES
TABLE 151.BLUE ORIGIN: COMPANY SNAPSHOT
TABLE 152.BLUE ORIGIN: OPERATING SEGMENTS
TABLE 153.BLUE ORIGIN: PRODUCT PORTFOLIO
TABLE 154.BLUE ORIGIN: NET SALES
TABLE 155.BLUE ORIGIN: KEY STRATERGIES
TABLE 156.VIRGIN GALLACTIC: COMPANY SNAPSHOT
TABLE 157.VIRGIN GALLACTIC: OPERATING SEGMENTS
TABLE 158.VIRGIN GALLACTIC: PRODUCT PORTFOLIO
TABLE 159.VIRGIN GALLACTIC: NET SALES
TABLE 160.VIRGIN GALLACTIC: KEY STRATERGIES
TABLE 161.NORTHROP GRUMMAN: COMPANY SNAPSHOT
TABLE 162.NORTHROP GRUMMAN: OPERATING SEGMENTS
TABLE 163.NORTHROP GRUMMAN: PRODUCT PORTFOLIO
TABLE 164.NORTHROP GRUMMAN: NET SALES
TABLE 165.NORTHROP GRUMMAN: KEY STRATERGIES
TABLE 166.MOOG INC.: COMPANY SNAPSHOT
TABLE 167.MOOG INC.: OPERATING SEGMENTS
TABLE 168.MOOG INC.: PRODUCT PORTFOLIO
TABLE 169.MOOG INC.: NET SALES
TABLE 170.MOOG INC.: KEY STRATERGIES
TABLE 171.SAFRAN S.A.: COMPANY SNAPSHOT
TABLE 172.SAFRAN S.A.: OPERATING SEGMENTS
TABLE 173.SAFRAN S.A.: PRODUCT PORTFOLIO
TABLE 174.SAFRAN S.A.: NET SALES
TABLE 175.SAFRAN S.A.: KEY STRATERGIES LIST OF FIGURES
FIGURE 1.ROCKET PROPULSION MARKET SEGMENTATION
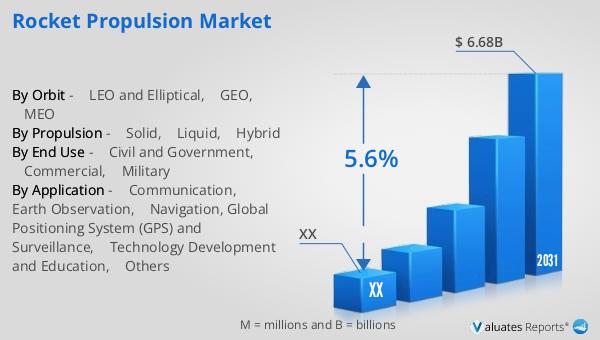
FIGURE 2.ROCKET PROPULSION MARKET,2021-2031
FIGURE 3.ROCKET PROPULSION MARKET,2021-2031
FIGURE 4. TOP INVESTMENT POCKETS, BY REGION
FIGURE 5.PORTER FIVE-1
FIGURE 6.PORTER FIVE-2
FIGURE 7.PORTER FIVE-3
FIGURE 8.PORTER FIVE-4
FIGURE 9.PORTER FIVE-5
FIGURE 10.TOP PLAYER POSITIONING
FIGURE 11.ROCKET PROPULSION MARKET:DRIVERS, RESTRAINTS AND OPPORTUNITIES
FIGURE 12.ROCKET PROPULSION MARKET,BY ORBIT,2021(%)
FIGURE 13.COMPARATIVE SHARE ANALYSIS OF LEO AND ELLIPTICAL ROCKET PROPULSION MARKET,2021-2031(%)
FIGURE 14.COMPARATIVE SHARE ANALYSIS OF GEO ROCKET PROPULSION MARKET,2021-2031(%)
FIGURE 15.COMPARATIVE SHARE ANALYSIS OF MEO ROCKET PROPULSION MARKET,2021-2031(%)
FIGURE 16.ROCKET PROPULSION MARKET,BY END USE,2021(%)
FIGURE 17.COMPARATIVE SHARE ANALYSIS OF CIVIL AND GOVERNMENT ROCKET PROPULSION MARKET,2021-2031(%)
FIGURE 18.COMPARATIVE SHARE ANALYSIS OF COMMERCIAL ROCKET PROPULSION MARKET,2021-2031(%)
FIGURE 19.COMPARATIVE SHARE ANALYSIS OF MILITARY ROCKET PROPULSION MARKET,2021-2031(%)
FIGURE 20.ROCKET PROPULSION MARKET,BY APPLICATION,2021(%)
FIGURE 21.COMPARATIVE SHARE ANALYSIS OF COMMUNICATION ROCKET PROPULSION MARKET,2021-2031(%)
FIGURE 22.COMPARATIVE SHARE ANALYSIS OF EARTH OBSERVATION ROCKET PROPULSION MARKET,2021-2031(%)
FIGURE 23.COMPARATIVE SHARE ANALYSIS OF NAVIGATION, GLOBAL POSITIONING SYSTEM (GPS) AND SURVEILLANCE ROCKET PROPULSION MARKET,2021-2031(%)
FIGURE 24.COMPARATIVE SHARE ANALYSIS OF TECHNOLOGY DEVELOPMENT AND EDUCATION ROCKET PROPULSION MARKET,2021-2031(%)
FIGURE 25.COMPARATIVE SHARE ANALYSIS OF OTHERS ROCKET PROPULSION MARKET,2021-2031(%)
FIGURE 26.ROCKET PROPULSION MARKET,BY PROPULSION,2021(%)
FIGURE 27.COMPARATIVE SHARE ANALYSIS OF SOLID ROCKET PROPULSION MARKET,2021-2031(%)
FIGURE 28.COMPARATIVE SHARE ANALYSIS OF LIQUID ROCKET PROPULSION MARKET,2021-2031(%)
FIGURE 29.COMPARATIVE SHARE ANALYSIS OF HYBRID ROCKET PROPULSION MARKET,2021-2031(%)
FIGURE 30.ROCKET PROPULSION MARKET BY REGION,2021
FIGURE 31.U.S. ROCKET PROPULSION MARKET,2021-2031($MILLION)
FIGURE 32.CANADA ROCKET PROPULSION MARKET,2021-2031($MILLION)
FIGURE 33.MEXICO ROCKET PROPULSION MARKET,2021-2031($MILLION)
FIGURE 34.GERMANY ROCKET PROPULSION MARKET,2021-2031($MILLION)
FIGURE 35.FRANCE ROCKET PROPULSION MARKET,2021-2031($MILLION)
FIGURE 36.ITALY ROCKET PROPULSION MARKET,2021-2031($MILLION)
FIGURE 37.SPAIN ROCKET PROPULSION MARKET,2021-2031($MILLION)
FIGURE 38.RUSSIA ROCKET PROPULSION MARKET,2021-2031($MILLION)
FIGURE 39.UK ROCKET PROPULSION MARKET,2021-2031($MILLION)
FIGURE 40.REST OF EUROPE ROCKET PROPULSION MARKET,2021-2031($MILLION)
FIGURE 41.CHINA ROCKET PROPULSION MARKET,2021-2031($MILLION)
FIGURE 42.INDIA ROCKET PROPULSION MARKET,2021-2031($MILLION)
FIGURE 43.JAPAN ROCKET PROPULSION MARKET,2021-2031($MILLION)
FIGURE 44.SOUTH KOREA ROCKET PROPULSION MARKET,2021-2031($MILLION)
FIGURE 45.REST OF ASIA-PACIFIC ROCKET PROPULSION MARKET,2021-2031($MILLION)
FIGURE 46.LATIN AMERICA ROCKET PROPULSION MARKET,2021-2031($MILLION)
FIGURE 47.MIDDLE EAST ROCKET PROPULSION MARKET,2021-2031($MILLION)
FIGURE 48.AFRICA ROCKET PROPULSION MARKET,2021-2031($MILLION)
FIGURE 49. TOP WINNING STRATEGIES, BY YEAR
FIGURE 50. TOP WINNING STRATEGIES, BY DEVELOPMENT
FIGURE 51. TOP WINNING STRATEGIES, BY COMPANY
FIGURE 52.PRODUCT MAPPING OF TOP 10 PLAYERS
FIGURE 53.COMPETITIVE DASHBOARD
FIGURE 54.COMPETITIVE HEATMAP OF TOP 10 KEY PLAYERS
FIGURE 55.AIRBUS.: NET SALES ($MILLION)
FIGURE 56.ROCKET LAB USA.: NET SALES ($MILLION)
FIGURE 57.BOEING COMPANY.: NET SALES ($MILLION)
FIGURE 58.MITSUBISHI HEAVY INDUSTRIES.: NET SALES ($MILLION)
FIGURE 59.SPACEX.: NET SALES ($MILLION)
FIGURE 60.BLUE ORIGIN.: NET SALES ($MILLION)
FIGURE 61.VIRGIN GALLACTIC.: NET SALES ($MILLION)
FIGURE 62.NORTHROP GRUMMAN.: NET SALES ($MILLION)
FIGURE 63.MOOG INC..: NET SALES ($MILLION)
FIGURE 64.SAFRAN S.A..: NET SALES ($MILLION
SELECT A FORMAT
Added to Cart
Electronic (PDF)

$5730

This license allows only one user to access the PDF.
Electronic (PDF)

$6450

This license allows 1 - 5 user to access the PDF, license is suitable for small groups of 5 users working together
Electronic (PDF)

$9600

This license allows users/teams in a same Enterprise to use this report, various departments within an enterpise can use this report
Electronic (PDF)

$3840

This license just provides quantitative data in a excel sheet
Add to Cart
Buy Now (15% Discount)

OUR CUSTOMER

Accenture

SIMILAR REPORTS