0
U.S. (TOLL FREE)
+1 (315) 215-3225
Automative

0
U.S. (TOLL FREE)
+1 (315) 215-3225
Murumuru Butter Market By Nature (Conventional, Organic), By End User (Hair Care, Skin Care, Lip Care), By Distribution Channel (B2B, B2C): Global Opportunity Analysis and Industry Forecast, 2021-2031
Published Date: October 2022
|
Report Code: ALLI-Auto-0D857
Home | Market Reports | Beauty & Fitness| Face & Body Care| Skin & Nail Care
Murumuru Butter Market By Nature Conventional Organic By End User Hair Care Skin Care Lip Care By Distribution Channel B2B B2C Global Opportunity Analysis and Industry Forecast 2021 2031
BUY CHAPTERS

Murumuru Butter Market By Nature (Conventional, Organic), By End User (Hair Care, Skin Care, Lip Care), By Distribution Channel (B2B, B2C): Global Opportunity Analysis and Industry Forecast, 2021-2031

Code: ALLI-Auto-0D857
Report
October 2022
Pages:250
Allied Market Research
Buy Now with 15% Discount
DESCRIPTION
TABLE OF CONTENT
TABLES & FIGURES

Murumuru Butter Market Size

According to a new report published by , titled, “Murumuru Butter Market," The murumuru butter market size was valued at $802.00 million in 2021, and is estimated to reach $1.8 billion by 2031, growing at a CAGR of 8.4% from 2022 to 2031.

Murumuru Butter Market

Murumuru Butter Market

Murumuru butter is made from the fruit and fat of murumuru nuts. Nuts fall from tall palm trees that grow everywhere in moist soil and moist pools. They are usually made in Belem at the mouth of the Amazon and are abundant there. Similar to coconut oil, murumuru butter is known for its nutritious properties and it has multiple benefits for skin, hair, and lips. Murumuru butter is an effective moisturizing ingredient for dry and rough skin as an exceptional emollient. Clients can use murumuru butter to remove curly hair, similar to conditioners. Compared to coconut oil and cocoa butter, it is less prone to acne and can be used by people with acne-prone skin. Murumuru butter reduces signs of aging such as fine lines and wrinkles over time. It also treats skin conditions such as eczema and psoriasis.
Since murumuru butter is a moisturizing and healing ingredient, Garshick who is a board-certified general medical dermatologist and cosmetics dermatology says it can be stacked with most other ingredients. “When used with moisturizers such as hyaluronic acid and glycerin, it is especially effective because it helps absorb water and murumuru helps keep that water in place,” she says. Patel points out that murumuru butter also works well with other emollients such as cocoa butter, shea butter, avocado oil, vitamin E, and coconut oil. Murumuru is a light butter. Therefore, it is best used for the following hair types: wavy hair, fine hair, low porosity hair, and non-thick hair. the murumuru butter is expected to continue to rise as a result of the hectic lifestyle.
The availability of murumuru butter on any kind of online site, supermarket, hypermarkets, or cosmetics store is predicted to boost the  global murumuru butter market. The murumuru butter entices customers with its wide range of products, propelling the global murumuru butter market. Furthermore, murumuru butter offers not only skin or air problems  but also produces lots of makeup products, such as contour, and concealer, which contribute to the market growth.
According to the global murumuru butter analysis, the market is segmented on the basis of nature, end user, distribution channel, and region. On the basis of nature, the market is classified into conventional and organic. The conventional segment occupied the major share of the market in 2020 and is projected to maintain their dominance during the forecast period. The organic segment of murumuru butter market is anticipated to grow at the highest CAGR in the future.
On the basis of end-user, the market is segmented into haircare, skincare, and lip care. The haircare segment is anticipated to grow at the highest rate during the forecast period, owing to the trend of using cosmetics for benefits. Moreover, the market for skincare and lip care products are anticipated to grow at the highest CAGR in future.
On the basis of distribution channel, it is categorized into B2B and B2C. The B2C segment is anticipated to dominate the market during the forecast period, due to the rise in online sites, variety stores and high disposable income of people.
In 2021, North America accounted for more than half the share of the global murumuru butter market and is expected to maintain its dominance during the forecast period. Moreover, Asia-Pacific and LAMEA are expected to possess the highest CAGRs, owing to the surge in demand for cosmetics products in the market.
Surge in demand for cosmetics due to hectic lifestyles, increase in the use of murumuru butter, rise in technological advancements, and surge in demand for murumuru butter from the retail industry and online sites are factors driving the growth of the global murumuru butter market.
Porter's five forces analysis for the murumuru butter market trends highlights market competition in terms of the power of buyers, suppliers, manufacturers, and new entrants.
Furthermore, a shift in the living standards of the consumers, as well as an increase in the per capita income of the consumers have resulted in the launch of new products and the entry of new players in the market during the forecast period.
The impact of the COVID-19 pandemic on the murumuru butter market growth was negative, due to the supply chain disruption. All manufacturing and production units were halted during the outbreak. In addition, trade restrictions and travel restrictions hindered the growth of the global murumuru butter market demand.
The major players analyzed for the global murumuru butter industry jarchem industries, Inc., Liberty Natural Products, Caribbean Natural Products Inc, BERACA INGREDIENTS NATURAIS SA, LUSH RETAIL LIMITED, NSI Group, LLC, Vigon International, Inc, Hallstar Company, H.F.Ed. Meyer GmbH & Co. KG , O&3 Limited  . These major market players have adopted various strategies such as collaboration to expand their market reach. The new market players are also entering the market with the latest and advanced versions of murumuru butter products.
KEY FINDINGS OF THE STUDY
By nature, conventional murumuru butter was the highest contributors for  the market in 2021, and is anticipated to grow at a significant CAGR of 8.3% during the forecast period.
By end user, the haircare segment is expected to witness growth at a CAGR of 9.1%, in terms of value, during the forecast period.
By distribution channel, the B2C segment is anticipated to witness growth at a CAGR of 8.9% during the forecast period.
Region-wise, North America was the dominant region in 2021, occupying more than half of the murumuru butter market share

Overview

The global murumuru butter market size was valued at $802 million in 2021, and is projected to reach $1.8 billion by 2031, growing at a CAGR of 8.4% from 2022 to 2031.Murumuru butter is one of the best organic ingredients currently used in the cosmetics industry. It was found in the Amazon rainforests of Brazil and is made from Murmur palms. This versatile butter has a creamy, yellowish texture and a distinctive aroma that is overwhelming for some. Studies have shown that this butter is rich in oleic acid, fatty acids, vitamin A, and anti-inflammatory and antibacterial effects. Murumuru butter is the best natural skin care product owing to the presence of vitamins A and C in breast milk, omega 3, 6, 9, and 47% lauric acid. This butter also contains seven other essential acids that help rebuild bodybuilding and skin. Some of these acids include myristic acid, oleic acid, linoleic acid, and palmitic acid. The combination of these acids and other ingredients makes murumuru butter a natural moisturizer for sensitive skin.
The murumuru butter market is segmented on the basis of nature, end user, distribution channel, and region. On the basis of, the market is divided into conventional and organic. On the basis of end user, it is classified into haircare, skincare, and lip care. On the basis of distribution channel, the market is divided into B2B and B2C.
On the basis of region, the market is analyzed across North America (the U.S., Canada, and Mexico), Europe (UK, Italy, Spain, Russia, Turkey and the Rest of Europe), Asia-Pacific (China, Japan, India, Thailand, Australia, and Rest of Asia-Pacific), and LAMEA (Brazil, Argentina, United Arab Emirates, and Rest of LAMEA).
The impact of the COVID-19 outbreak was quite negative on the growth of the global murumuru butter market. The trade restrictions and lockdown resulted in the halting of production and manufacturing units. The recovery of the murumuru butter market is expected in near future.
In North America and Europe, the murumuru butter market has witnessed a higher penetration rate. However, this product has low availability in some major areas of Asia-Pacific, which can be attributed to poor macroeconomic variables such as low internet penetration and inadequate marketing techniques by market players. As a result, the expansion of the murumuru butter market is constrained by a lack of such products.

KEY BENEFITS FOR STAKEHOLDERS

●This report provides a quantitative analysis of the current trends, estimations, and dynamics from 2020 to 2031 to assist to identify the prevailing market opportunities.
●Major countries in each region are mapped according to the individual market revenue.
●The region-wise and country-wise murumuru butter market conditions are comprehensively analyzed.
●This study evaluates the competitive landscape and the value chain analysis to understand the competitive environment across geographies.
●An in-depth analysis of each segment of the murumuru butter market is provided to assist the prevailing market opportunities.
KEY MARKET SEGMENTS
●By Nature
●Conventional
●Organic
●By End-User
●Haircare
●Skincare
●Lip Care
●By Distribution Channel
●B2B
●B2C

Key Benefits For Stakeholders

●This report provides a quantitative analysis of the market segments, current trends, estimations, and dynamics of the murumuru butter market analysis from 2021 to 2031 to identify the prevailing murumuru butter market opportunities.
●The market research is offered along with information related to key drivers, restraints, and opportunities.
●Porter's five forces analysis highlights the potency of buyers and suppliers to enable stakeholders make profit-oriented business decisions and strengthen their supplier-buyer network.
●In-depth analysis of the murumuru butter market segmentation assists to determine the prevailing market opportunities.
●Major countries in each region are mapped according to their revenue contribution to the global market.
●Market player positioning facilitates benchmarking and provides a clear understanding of the present position of the market players.
●The report includes the analysis of the regional as well as global murumuru butter market trends, key players, market segments, application areas, and market growth strategies.
Key Market Segments
○ Paris Fragnance US

Scope of Murumuru Butter Market Report

Report Metric Details
Report Name Murumuru Butter Market
Accounted market size in 2021 $ 802.00 million
Forecasted market size in 2031 $ 1.8 billion
CAGR 8.4%
Base Year 2021
Forecasted years 2024 - 2031
By Region
  • North America (United States, Canada)
  • Europe (Germany, France, UK, Italy, Russia) Rest of Europe
  • Nordic Countries
  • Asia-Pacific (China, Japan, South Korea)
  • Southeast Asia (India, Australia)
  • Rest of Asia
  • Latin America (Mexico, Brazil)
  • Rest of Latin America
  • Middle East & Africa (Turkey, Saudi Arabia, UAE, Rest of MEA)
By Nature ● Conventional
● Organic
By End User ● Hair Care
● Skin Care
● Lip Care
By Distribution Channel ● B2B
● B2C
Forecast units USD million in value
Report coverage Revenue and volume forecast, company share, competitive landscape, growth factors and trends

FAQ for this report

How fast is Murumuru Butter Market growing?

Ans: The Murumuru Butter Market witnessing a CAGR of 8.4% during the forecast period 2024-2031.

What is the Murumuru Butter Market size in 2031?

Ans: The Murumuru Butter Market size in 2031 will be $ 1.8 billion.

What are the End User segmentation covered in the Murumuru Butter Market report?

Ans: The End users covered in the Murumuru Butter Market report are ● Hair Care, ● Skin Care, ● Lip Care

CHAPTER 1:INTRODUCTION
1.1.Report description
1.2.Key market segments
1.3.Key benefits to the stakeholders
1.4.Research Methodology
1.4.1.Secondary research
1.4.2.Primary research
1.4.3.Analyst tools and models
CHAPTER 2:EXECUTIVE SUMMARY
2.1.Key findings of the study
2.2.CXO Perspective
CHAPTER 3:MARKET OVERVIEW
3.1.Market definition and scope
3.2.Key findings
3.2.1.Top investment pockets
3.3.Porter’s five forces analysis
3.4.Top player positioning
3.5.Market dynamics
3.5.1.Drivers
3.5.2.Restraints
3.5.3.Opportunities
3.6.COVID-19 Impact Analysis on the market
CHAPTER 4: MURUMURU BUTTER MARKET, BY NATURE
4.1 Overview
4.1.1 Market size and forecast
4.2 Conventional
4.2.1 Key market trends, growth factors and opportunities
4.2.2 Market size and forecast, by region
4.2.3 Market analysis by country
4.3 Organic
4.3.1 Key market trends, growth factors and opportunities
4.3.2 Market size and forecast, by region
4.3.3 Market analysis by country
CHAPTER 5: MURUMURU BUTTER MARKET, BY END USER
5.1 Overview
5.1.1 Market size and forecast
5.2 Hair Care
5.2.1 Key market trends, growth factors and opportunities
5.2.2 Market size and forecast, by region
5.2.3 Market analysis by country
5.3 Skin Care
5.3.1 Key market trends, growth factors and opportunities
5.3.2 Market size and forecast, by region
5.3.3 Market analysis by country
5.4 Lip Care
5.4.1 Key market trends, growth factors and opportunities
5.4.2 Market size and forecast, by region
5.4.3 Market analysis by country
CHAPTER 6: MURUMURU BUTTER MARKET, BY DISTRIBUTION CHANNEL
6.1 Overview
6.1.1 Market size and forecast
6.2 B2B
6.2.1 Key market trends, growth factors and opportunities
6.2.2 Market size and forecast, by region
6.2.3 Market analysis by country
6.3 B2C
6.3.1 Key market trends, growth factors and opportunities
6.3.2 Market size and forecast, by region
6.3.3 Market analysis by country
CHAPTER 7: MURUMURU BUTTER MARKET, BY REGION
7.1 Overview
7.1.1 Market size and forecast
7.2 North America
7.2.1 Key trends and opportunities
7.2.2 North America Market size and forecast, by Nature
7.2.3 North America Market size and forecast, by End User
7.2.4 North America Market size and forecast, by Distribution Channel
7.2.5 North America Market size and forecast, by country
7.2.5.1 U.S.
7.2.5.1.1 Market size and forecast, by Nature
7.2.5.1.2 Market size and forecast, by End User
7.2.5.1.3 Market size and forecast, by Distribution Channel
7.2.5.2 Canada
7.2.5.2.1 Market size and forecast, by Nature
7.2.5.2.2 Market size and forecast, by End User
7.2.5.2.3 Market size and forecast, by Distribution Channel
7.2.5.3 Mexico
7.2.5.3.1 Market size and forecast, by Nature
7.2.5.3.2 Market size and forecast, by End User
7.2.5.3.3 Market size and forecast, by Distribution Channel
7.3 Europe
7.3.1 Key trends and opportunities
7.3.2 Europe Market size and forecast, by Nature
7.3.3 Europe Market size and forecast, by End User
7.3.4 Europe Market size and forecast, by Distribution Channel
7.3.5 Europe Market size and forecast, by country
7.3.5.1 U.K.
7.3.5.1.1 Market size and forecast, by Nature
7.3.5.1.2 Market size and forecast, by End User
7.3.5.1.3 Market size and forecast, by Distribution Channel
7.3.5.2 Italy
7.3.5.2.1 Market size and forecast, by Nature
7.3.5.2.2 Market size and forecast, by End User
7.3.5.2.3 Market size and forecast, by Distribution Channel
7.3.5.3 Spain
7.3.5.3.1 Market size and forecast, by Nature
7.3.5.3.2 Market size and forecast, by End User
7.3.5.3.3 Market size and forecast, by Distribution Channel
7.3.5.4 Russia
7.3.5.4.1 Market size and forecast, by Nature
7.3.5.4.2 Market size and forecast, by End User
7.3.5.4.3 Market size and forecast, by Distribution Channel
7.3.5.5 Turkey
7.3.5.5.1 Market size and forecast, by Nature
7.3.5.5.2 Market size and forecast, by End User
7.3.5.5.3 Market size and forecast, by Distribution Channel
7.3.5.6 Rest of Europe
7.3.5.6.1 Market size and forecast, by Nature
7.3.5.6.2 Market size and forecast, by End User
7.3.5.6.3 Market size and forecast, by Distribution Channel
7.4 Asia-Pacific
7.4.1 Key trends and opportunities
7.4.2 Asia-Pacific Market size and forecast, by Nature
7.4.3 Asia-Pacific Market size and forecast, by End User
7.4.4 Asia-Pacific Market size and forecast, by Distribution Channel
7.4.5 Asia-Pacific Market size and forecast, by country
7.4.5.1 China
7.4.5.1.1 Market size and forecast, by Nature
7.4.5.1.2 Market size and forecast, by End User
7.4.5.1.3 Market size and forecast, by Distribution Channel
7.4.5.2 Japan
7.4.5.2.1 Market size and forecast, by Nature
7.4.5.2.2 Market size and forecast, by End User
7.4.5.2.3 Market size and forecast, by Distribution Channel
7.4.5.3 India
7.4.5.3.1 Market size and forecast, by Nature
7.4.5.3.2 Market size and forecast, by End User
7.4.5.3.3 Market size and forecast, by Distribution Channel
7.4.5.4 Thailand
7.4.5.4.1 Market size and forecast, by Nature
7.4.5.4.2 Market size and forecast, by End User
7.4.5.4.3 Market size and forecast, by Distribution Channel
7.4.5.5 Australia
7.4.5.5.1 Market size and forecast, by Nature
7.4.5.5.2 Market size and forecast, by End User
7.4.5.5.3 Market size and forecast, by Distribution Channel
7.4.5.6 Rest of Asia-Pacific
7.4.5.6.1 Market size and forecast, by Nature
7.4.5.6.2 Market size and forecast, by End User
7.4.5.6.3 Market size and forecast, by Distribution Channel
7.5 LAMEA
7.5.1 Key trends and opportunities
7.5.2 LAMEA Market size and forecast, by Nature
7.5.3 LAMEA Market size and forecast, by End User
7.5.4 LAMEA Market size and forecast, by Distribution Channel
7.5.5 LAMEA Market size and forecast, by country
7.5.5.1 Brazil
7.5.5.1.1 Market size and forecast, by Nature
7.5.5.1.2 Market size and forecast, by End User
7.5.5.1.3 Market size and forecast, by Distribution Channel
7.5.5.2 Argentina
7.5.5.2.1 Market size and forecast, by Nature
7.5.5.2.2 Market size and forecast, by End User
7.5.5.2.3 Market size and forecast, by Distribution Channel
7.5.5.3 UAE
7.5.5.3.1 Market size and forecast, by Nature
7.5.5.3.2 Market size and forecast, by End User
7.5.5.3.3 Market size and forecast, by Distribution Channel
7.5.5.4 Rest of LAMEA
7.5.5.4.1 Market size and forecast, by Nature
7.5.5.4.2 Market size and forecast, by End User
7.5.5.4.3 Market size and forecast, by Distribution Channel
CHAPTER 8: COMPANY LANDSCAPE
8.1. Introduction
8.2. Top winning strategies
8.3. Product Mapping of Top 10 Player
8.4. Competitive Dashboard
8.5. Competitive Heatmap
8.6. Key developments
CHAPTER 9: COMPANY PROFILES
9.1 Citróleo Groups
9.1.1 Company overview
9.1.2 Company snapshot
9.1.3 Operating business segments
9.1.4 Product portfolio
9.1.5 Business performance
9.1.6 Key strategic moves and developments
9.2 Natural Products
9.2.1 Company overview
9.2.2 Company snapshot
9.2.3 Operating business segments
9.2.4 Product portfolio
9.2.5 Business performance
9.2.6 Key strategic moves and developments
9.3 Jarchem Industries
9.3.1 Company overview
9.3.2 Company snapshot
9.3.3 Operating business segments
9.3.4 Product portfolio
9.3.5 Business performance
9.3.6 Key strategic moves and developments
9.4 Beraca Ingredientes Naturais SA
9.4.1 Company overview
9.4.2 Company snapshot
9.4.3 Operating business segments
9.4.4 Product portfolio
9.4.5 Business performance
9.4.6 Key strategic moves and developments
9.5 Lush Retail
9.5.1 Company overview
9.5.2 Company snapshot
9.5.3 Operating business segments
9.5.4 Product portfolio
9.5.5 Business performance
9.5.6 Key strategic moves and developments
9.6 Natural Sourcing
9.6.1 Company overview
9.6.2 Company snapshot
9.6.3 Operating business segments
9.6.4 Product portfolio
9.6.5 Business performance
9.6.6 Key strategic moves and developments
9.7 Crafters Choice Brands
9.7.1 Company overview
9.7.2 Company snapshot
9.7.3 Operating business segments
9.7.4 Product portfolio
9.7.5 Business performance
9.7.6 Key strategic moves and developments
9.8 Vigon International
9.8.1 Company overview
9.8.2 Company snapshot
9.8.3 Operating business segments
9.8.4 Product portfolio
9.8.5 Business performance
9.8.6 Key strategic moves and developments
9.9 O&3
9.9.1 Company overview
9.9.2 Company snapshot
9.9.3 Operating business segments
9.9.4 Product portfolio
9.9.5 Business performance
9.9.6 Key strategic moves and developments
9.10 Hallstar
9.10.1 Company overview
9.10.2 Company snapshot
9.10.3 Operating business segments
9.10.4 Product portfolio
9.10.5 Business performance
9.10.6 Key strategic moves and developments
9.11 Henry Lamotte Oils GmbH
9.11.1 Company overview
9.11.2 Company snapshot
9.11.3 Operating business segments
9.11.4 Product portfolio
9.11.5 Business performance
9.11.6 Key strategic moves and developments
9.12 Gracefruit
9.12.1 Company overview
9.12.2 Company snapshot
9.12.3 Operating business segments
9.12.4 Product portfolio
9.12.5 Business performance
9.12.6 Key strategic moves and developments
9.13 Parchem fine & speciality chemical
9.13.1 Company overview
9.13.2 Company snapshot
9.13.3 Operating business segments
9.13.4 Product portfolio
9.13.5 Business performance
9.13.6 Key strategic moves and developments
9.14 Mystic Moments
9.14.1 Company overview
9.14.2 Company snapshot
9.14.3 Operating business segments
9.14.4 Product portfolio
9.14.5 Business performance
9.14.6 Key strategic moves and developments
9.15 Jadeward International
9.15.1 Company overview
9.15.2 Company snapshot
9.15.3 Operating business segments
9.15.4 Product portfolio
9.15.5 Business performance
9.15.6 Key strategic moves and developments
9.16 Paris Fragnance USA
9.16.1 Company overview
9.16.2 Company snapshot
9.16.3 Operating business segments
9.16.4 Product portfolio
9.16.5 Business performance
9.16.6 Key strategic moves and development
LIST OF TABLES
TABLE 1. GLOBAL MURUMURU BUTTER MARKET, BY NATURE, 2021-2031 ($MILLION)
TABLE 2. MURUMURU BUTTER MARKET SIZE, FOR CONVENTIONAL, BY REGION, 2021-2031 ($MILLION)
TABLE 3. MURUMURU BUTTER MARKET FOR CONVENTIONAL BY COUNTRY, 2021-2031 ($MILLION)
TABLE 4. MURUMURU BUTTER MARKET SIZE, FOR ORGANIC, BY REGION, 2021-2031 ($MILLION)
TABLE 5. MURUMURU BUTTER MARKET FOR ORGANIC BY COUNTRY, 2021-2031 ($MILLION)
TABLE 6. GLOBAL MURUMURU BUTTER MARKET, BY END USER, 2021-2031 ($MILLION)
TABLE 7. MURUMURU BUTTER MARKET SIZE, FOR HAIR CARE, BY REGION, 2021-2031 ($MILLION)
TABLE 8. MURUMURU BUTTER MARKET FOR HAIR CARE BY COUNTRY, 2021-2031 ($MILLION)
TABLE 9. MURUMURU BUTTER MARKET SIZE, FOR SKIN CARE, BY REGION, 2021-2031 ($MILLION)
TABLE 10. MURUMURU BUTTER MARKET FOR SKIN CARE BY COUNTRY, 2021-2031 ($MILLION)
TABLE 11. MURUMURU BUTTER MARKET SIZE, FOR LIP CARE, BY REGION, 2021-2031 ($MILLION)
TABLE 12. MURUMURU BUTTER MARKET FOR LIP CARE BY COUNTRY, 2021-2031 ($MILLION)
TABLE 13. GLOBAL MURUMURU BUTTER MARKET, BY DISTRIBUTION CHANNEL, 2021-2031 ($MILLION)
TABLE 14. MURUMURU BUTTER MARKET SIZE, FOR B2B, BY REGION, 2021-2031 ($MILLION)
TABLE 15. MURUMURU BUTTER MARKET FOR B2B BY COUNTRY, 2021-2031 ($MILLION)
TABLE 16. MURUMURU BUTTER MARKET SIZE, FOR B2C, BY REGION, 2021-2031 ($MILLION)
TABLE 17. MURUMURU BUTTER MARKET FOR B2C BY COUNTRY, 2021-2031 ($MILLION)
TABLE 18. MURUMURU BUTTER MARKET, BY REGION, 2021-2031 ($MILLION)
TABLE 19. NORTH AMERICA MURUMURU BUTTER MARKET, BY NATURE, 2021-2031 ($MILLION)
TABLE 20. NORTH AMERICA MURUMURU BUTTER MARKET, BY END USER, 2021-2031 ($MILLION)
TABLE 21. NORTH AMERICA MURUMURU BUTTER MARKET, BY DISTRIBUTION CHANNEL, 2021-2031 ($MILLION)
TABLE 22. NORTH AMERICA MURUMURU BUTTER MARKET, BY COUNTRY, 2021-2031 ($MILLION)
TABLE 23. U.S. MURUMURU BUTTER MARKET, BY NATURE, 2021-2031 ($MILLION)
TABLE 24. U.S. MURUMURU BUTTER MARKET, BY END USER, 2021-2031 ($MILLION)
TABLE 25. U.S. MURUMURU BUTTER MARKET, BY DISTRIBUTION CHANNEL, 2021-2031 ($MILLION)
TABLE 26. CANADA MURUMURU BUTTER MARKET, BY NATURE, 2021-2031 ($MILLION)
TABLE 27. CANADA MURUMURU BUTTER MARKET, BY END USER, 2021-2031 ($MILLION)
TABLE 28. CANADA MURUMURU BUTTER MARKET, BY DISTRIBUTION CHANNEL, 2021-2031 ($MILLION)
TABLE 29. MEXICO MURUMURU BUTTER MARKET, BY NATURE, 2021-2031 ($MILLION)
TABLE 30. MEXICO MURUMURU BUTTER MARKET, BY END USER, 2021-2031 ($MILLION)
TABLE 31. MEXICO MURUMURU BUTTER MARKET, BY DISTRIBUTION CHANNEL, 2021-2031 ($MILLION)
TABLE 32. EUROPE MURUMURU BUTTER MARKET, BY NATURE, 2021-2031 ($MILLION)
TABLE 33. EUROPE MURUMURU BUTTER MARKET, BY END USER, 2021-2031 ($MILLION)
TABLE 34. EUROPE MURUMURU BUTTER MARKET, BY DISTRIBUTION CHANNEL, 2021-2031 ($MILLION)
TABLE 35. EUROPE MURUMURU BUTTER MARKET, BY COUNTRY, 2021-2031 ($MILLION)
TABLE 36. U.K. MURUMURU BUTTER MARKET, BY NATURE, 2021-2031 ($MILLION)
TABLE 37. U.K. MURUMURU BUTTER MARKET, BY END USER, 2021-2031 ($MILLION)
TABLE 38. U.K. MURUMURU BUTTER MARKET, BY DISTRIBUTION CHANNEL, 2021-2031 ($MILLION)
TABLE 39. ITALY MURUMURU BUTTER MARKET, BY NATURE, 2021-2031 ($MILLION)
TABLE 40. ITALY MURUMURU BUTTER MARKET, BY END USER, 2021-2031 ($MILLION)
TABLE 41. ITALY MURUMURU BUTTER MARKET, BY DISTRIBUTION CHANNEL, 2021-2031 ($MILLION)
TABLE 42. SPAIN MURUMURU BUTTER MARKET, BY NATURE, 2021-2031 ($MILLION)
TABLE 43. SPAIN MURUMURU BUTTER MARKET, BY END USER, 2021-2031 ($MILLION)
TABLE 44. SPAIN MURUMURU BUTTER MARKET, BY DISTRIBUTION CHANNEL, 2021-2031 ($MILLION)
TABLE 45. RUSSIA MURUMURU BUTTER MARKET, BY NATURE, 2021-2031 ($MILLION)
TABLE 46. RUSSIA MURUMURU BUTTER MARKET, BY END USER, 2021-2031 ($MILLION)
TABLE 47. RUSSIA MURUMURU BUTTER MARKET, BY DISTRIBUTION CHANNEL, 2021-2031 ($MILLION)
TABLE 48. TURKEY MURUMURU BUTTER MARKET, BY NATURE, 2021-2031 ($MILLION)
TABLE 49. TURKEY MURUMURU BUTTER MARKET, BY END USER, 2021-2031 ($MILLION)
TABLE 50. TURKEY MURUMURU BUTTER MARKET, BY DISTRIBUTION CHANNEL, 2021-2031 ($MILLION)
TABLE 51. REST OF EUROPE MURUMURU BUTTER MARKET, BY NATURE, 2021-2031 ($MILLION)
TABLE 52. REST OF EUROPE MURUMURU BUTTER MARKET, BY END USER, 2021-2031 ($MILLION)
TABLE 53. REST OF EUROPE MURUMURU BUTTER MARKET, BY DISTRIBUTION CHANNEL, 2021-2031 ($MILLION)
TABLE 54. ASIA-PACIFIC MURUMURU BUTTER MARKET, BY NATURE, 2021-2031 ($MILLION)
TABLE 55. ASIA-PACIFIC MURUMURU BUTTER MARKET, BY END USER, 2021-2031 ($MILLION)
TABLE 56. ASIA-PACIFIC MURUMURU BUTTER MARKET, BY DISTRIBUTION CHANNEL, 2021-2031 ($MILLION)
TABLE 57. ASIA-PACIFIC MURUMURU BUTTER MARKET, BY COUNTRY, 2021-2031 ($MILLION)
TABLE 58. CHINA MURUMURU BUTTER MARKET, BY NATURE, 2021-2031 ($MILLION)
TABLE 59. CHINA MURUMURU BUTTER MARKET, BY END USER, 2021-2031 ($MILLION)
TABLE 60. CHINA MURUMURU BUTTER MARKET, BY DISTRIBUTION CHANNEL, 2021-2031 ($MILLION)
TABLE 61. JAPAN MURUMURU BUTTER MARKET, BY NATURE, 2021-2031 ($MILLION)
TABLE 62. JAPAN MURUMURU BUTTER MARKET, BY END USER, 2021-2031 ($MILLION)
TABLE 63. JAPAN MURUMURU BUTTER MARKET, BY DISTRIBUTION CHANNEL, 2021-2031 ($MILLION)
TABLE 64. INDIA MURUMURU BUTTER MARKET, BY NATURE, 2021-2031 ($MILLION)
TABLE 65. INDIA MURUMURU BUTTER MARKET, BY END USER, 2021-2031 ($MILLION)
TABLE 66. INDIA MURUMURU BUTTER MARKET, BY DISTRIBUTION CHANNEL, 2021-2031 ($MILLION)
TABLE 67. THAILAND MURUMURU BUTTER MARKET, BY NATURE, 2021-2031 ($MILLION)
TABLE 68. THAILAND MURUMURU BUTTER MARKET, BY END USER, 2021-2031 ($MILLION)
TABLE 69. THAILAND MURUMURU BUTTER MARKET, BY DISTRIBUTION CHANNEL, 2021-2031 ($MILLION)
TABLE 70. AUSTRALIA MURUMURU BUTTER MARKET, BY NATURE, 2021-2031 ($MILLION)
TABLE 71. AUSTRALIA MURUMURU BUTTER MARKET, BY END USER, 2021-2031 ($MILLION)
TABLE 72. AUSTRALIA MURUMURU BUTTER MARKET, BY DISTRIBUTION CHANNEL, 2021-2031 ($MILLION)
TABLE 73. REST OF ASIA-PACIFIC MURUMURU BUTTER MARKET, BY NATURE, 2021-2031 ($MILLION)
TABLE 74. REST OF ASIA-PACIFIC MURUMURU BUTTER MARKET, BY END USER, 2021-2031 ($MILLION)
TABLE 75. REST OF ASIA-PACIFIC MURUMURU BUTTER MARKET, BY DISTRIBUTION CHANNEL, 2021-2031 ($MILLION)
TABLE 76. LAMEA MURUMURU BUTTER MARKET, BY NATURE, 2021-2031 ($MILLION)
TABLE 77. LAMEA MURUMURU BUTTER MARKET, BY END USER, 2021-2031 ($MILLION)
TABLE 78. LAMEA MURUMURU BUTTER MARKET, BY DISTRIBUTION CHANNEL, 2021-2031 ($MILLION)
TABLE 79. LAMEA MURUMURU BUTTER MARKET, BY COUNTRY, 2021-2031 ($MILLION)
TABLE 80. BRAZIL MURUMURU BUTTER MARKET, BY NATURE, 2021-2031 ($MILLION)
TABLE 81. BRAZIL MURUMURU BUTTER MARKET, BY END USER, 2021-2031 ($MILLION)
TABLE 82. BRAZIL MURUMURU BUTTER MARKET, BY DISTRIBUTION CHANNEL, 2021-2031 ($MILLION)
TABLE 83. ARGENTINA MURUMURU BUTTER MARKET, BY NATURE, 2021-2031 ($MILLION)
TABLE 84. ARGENTINA MURUMURU BUTTER MARKET, BY END USER, 2021-2031 ($MILLION)
TABLE 85. ARGENTINA MURUMURU BUTTER MARKET, BY DISTRIBUTION CHANNEL, 2021-2031 ($MILLION)
TABLE 86. UAE MURUMURU BUTTER MARKET, BY NATURE, 2021-2031 ($MILLION)
TABLE 87. UAE MURUMURU BUTTER MARKET, BY END USER, 2021-2031 ($MILLION)
TABLE 88. UAE MURUMURU BUTTER MARKET, BY DISTRIBUTION CHANNEL, 2021-2031 ($MILLION)
TABLE 89. REST OF LAMEA MURUMURU BUTTER MARKET, BY NATURE, 2021-2031 ($MILLION)
TABLE 90. REST OF LAMEA MURUMURU BUTTER MARKET, BY END USER, 2021-2031 ($MILLION)
TABLE 91. REST OF LAMEA MURUMURU BUTTER MARKET, BY DISTRIBUTION CHANNEL, 2021-2031 ($MILLION)
TABLE 92.CITRÓLEO GROUPS: COMPANY SNAPSHOT
TABLE 93.CITRÓLEO GROUPS: OPERATING SEGMENTS
TABLE 94.CITRÓLEO GROUPS: PRODUCT PORTFOLIO
TABLE 95.CITRÓLEO GROUPS: NET SALES,
TABLE 96.CITRÓLEO GROUPS: KEY STRATERGIES
TABLE 97.NATURAL PRODUCTS: COMPANY SNAPSHOT
TABLE 98.NATURAL PRODUCTS: OPERATING SEGMENTS
TABLE 99.NATURAL PRODUCTS: PRODUCT PORTFOLIO
TABLE 100.NATURAL PRODUCTS: NET SALES,
TABLE 101.NATURAL PRODUCTS: KEY STRATERGIES
TABLE 102.JARCHEM INDUSTRIES: COMPANY SNAPSHOT
TABLE 103.JARCHEM INDUSTRIES: OPERATING SEGMENTS
TABLE 104.JARCHEM INDUSTRIES: PRODUCT PORTFOLIO
TABLE 105.JARCHEM INDUSTRIES: NET SALES,
TABLE 106.JARCHEM INDUSTRIES: KEY STRATERGIES
TABLE 107.BERACA INGREDIENTES NATURAIS SA: COMPANY SNAPSHOT
TABLE 108.BERACA INGREDIENTES NATURAIS SA: OPERATING SEGMENTS
TABLE 109.BERACA INGREDIENTES NATURAIS SA: PRODUCT PORTFOLIO
TABLE 110.BERACA INGREDIENTES NATURAIS SA: NET SALES,
TABLE 111.BERACA INGREDIENTES NATURAIS SA: KEY STRATERGIES
TABLE 112.LUSH RETAIL: COMPANY SNAPSHOT
TABLE 113.LUSH RETAIL: OPERATING SEGMENTS
TABLE 114.LUSH RETAIL: PRODUCT PORTFOLIO
TABLE 115.LUSH RETAIL: NET SALES,
TABLE 116.LUSH RETAIL: KEY STRATERGIES
TABLE 117.NATURAL SOURCING: COMPANY SNAPSHOT
TABLE 118.NATURAL SOURCING: OPERATING SEGMENTS
TABLE 119.NATURAL SOURCING: PRODUCT PORTFOLIO
TABLE 120.NATURAL SOURCING: NET SALES,
TABLE 121.NATURAL SOURCING: KEY STRATERGIES
TABLE 122.CRAFTERS CHOICE BRANDS: COMPANY SNAPSHOT
TABLE 123.CRAFTERS CHOICE BRANDS: OPERATING SEGMENTS
TABLE 124.CRAFTERS CHOICE BRANDS: PRODUCT PORTFOLIO
TABLE 125.CRAFTERS CHOICE BRANDS: NET SALES,
TABLE 126.CRAFTERS CHOICE BRANDS: KEY STRATERGIES
TABLE 127.VIGON INTERNATIONAL: COMPANY SNAPSHOT
TABLE 128.VIGON INTERNATIONAL: OPERATING SEGMENTS
TABLE 129.VIGON INTERNATIONAL: PRODUCT PORTFOLIO
TABLE 130.VIGON INTERNATIONAL: NET SALES,
TABLE 131.VIGON INTERNATIONAL: KEY STRATERGIES
TABLE 132.O&3: COMPANY SNAPSHOT
TABLE 133.O&3: OPERATING SEGMENTS
TABLE 134.O&3: PRODUCT PORTFOLIO
TABLE 135.O&3: NET SALES,
TABLE 136.O&3: KEY STRATERGIES
TABLE 137.HALLSTAR: COMPANY SNAPSHOT
TABLE 138.HALLSTAR: OPERATING SEGMENTS
TABLE 139.HALLSTAR: PRODUCT PORTFOLIO
TABLE 140.HALLSTAR: NET SALES,
TABLE 141.HALLSTAR: KEY STRATERGIES
TABLE 142.HENRY LAMOTTE OILS GMBH: COMPANY SNAPSHOT
TABLE 143.HENRY LAMOTTE OILS GMBH: OPERATING SEGMENTS
TABLE 144.HENRY LAMOTTE OILS GMBH: PRODUCT PORTFOLIO
TABLE 145.HENRY LAMOTTE OILS GMBH: NET SALES,
TABLE 146.HENRY LAMOTTE OILS GMBH: KEY STRATERGIES
TABLE 147.GRACEFRUIT: COMPANY SNAPSHOT
TABLE 148.GRACEFRUIT: OPERATING SEGMENTS
TABLE 149.GRACEFRUIT: PRODUCT PORTFOLIO
TABLE 150.GRACEFRUIT: NET SALES,
TABLE 151.GRACEFRUIT: KEY STRATERGIES
TABLE 152.PARCHEM FINE & SPECIALITY CHEMICAL: COMPANY SNAPSHOT
TABLE 153.PARCHEM FINE & SPECIALITY CHEMICAL: OPERATING SEGMENTS
TABLE 154.PARCHEM FINE & SPECIALITY CHEMICAL: PRODUCT PORTFOLIO
TABLE 155.PARCHEM FINE & SPECIALITY CHEMICAL: NET SALES,
TABLE 156.PARCHEM FINE & SPECIALITY CHEMICAL: KEY STRATERGIES
TABLE 157.MYSTIC MOMENTS: COMPANY SNAPSHOT
TABLE 158.MYSTIC MOMENTS: OPERATING SEGMENTS
TABLE 159.MYSTIC MOMENTS: PRODUCT PORTFOLIO
TABLE 160.MYSTIC MOMENTS: NET SALES,
TABLE 161.MYSTIC MOMENTS: KEY STRATERGIES
TABLE 162.JADEWARD INTERNATIONAL: COMPANY SNAPSHOT
TABLE 163.JADEWARD INTERNATIONAL: OPERATING SEGMENTS
TABLE 164.JADEWARD INTERNATIONAL: PRODUCT PORTFOLIO
TABLE 165.JADEWARD INTERNATIONAL: NET SALES,
TABLE 166.JADEWARD INTERNATIONAL: KEY STRATERGIES
TABLE 167.PARIS FRAGNANCE USA: COMPANY SNAPSHOT
TABLE 168.PARIS FRAGNANCE USA: OPERATING SEGMENTS
TABLE 169.PARIS FRAGNANCE USA: PRODUCT PORTFOLIO
TABLE 170.PARIS FRAGNANCE USA: NET SALES,
TABLE 171.PARIS FRAGNANCE USA: KEY STRATERGIES LIST OF FIGURES
FIGURE 1.MURUMURU BUTTER MARKET SEGMENTATION
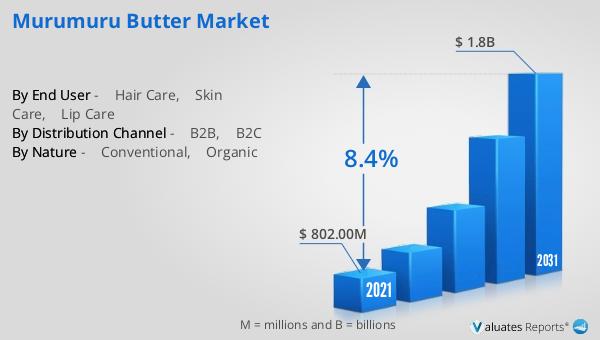
FIGURE 2.MURUMURU BUTTER MARKET,2021-2031
FIGURE 3.MURUMURU BUTTER MARKET,2021-2031
FIGURE 4. TOP INVESTMENT POCKETS, BY REGION
FIGURE 5.PORTER FIVE-1
FIGURE 6.PORTER FIVE-2
FIGURE 7.PORTER FIVE-3
FIGURE 8.PORTER FIVE-4
FIGURE 9.PORTER FIVE-5
FIGURE 10.TOP PLAYER POSITIONING
FIGURE 11.MURUMURU BUTTER MARKET:DRIVERS, RESTRAINTS AND OPPORTUNITIES
FIGURE 12.MURUMURU BUTTER MARKET,BY NATURE,2021(%)
FIGURE 13.COMPARATIVE SHARE ANALYSIS OF CONVENTIONAL MURUMURU BUTTER MARKET,2021-2031(%)
FIGURE 14.COMPARATIVE SHARE ANALYSIS OF ORGANIC MURUMURU BUTTER MARKET,2021-2031(%)
FIGURE 15.MURUMURU BUTTER MARKET,BY END USER,2021(%)
FIGURE 16.COMPARATIVE SHARE ANALYSIS OF HAIR CARE MURUMURU BUTTER MARKET,2021-2031(%)
FIGURE 17.COMPARATIVE SHARE ANALYSIS OF SKIN CARE MURUMURU BUTTER MARKET,2021-2031(%)
FIGURE 18.COMPARATIVE SHARE ANALYSIS OF LIP CARE MURUMURU BUTTER MARKET,2021-2031(%)
FIGURE 19.MURUMURU BUTTER MARKET,BY DISTRIBUTION CHANNEL,2021(%)
FIGURE 20.COMPARATIVE SHARE ANALYSIS OF B2B MURUMURU BUTTER MARKET,2021-2031(%)
FIGURE 21.COMPARATIVE SHARE ANALYSIS OF B2C MURUMURU BUTTER MARKET,2021-2031(%)
FIGURE 22.MURUMURU BUTTER MARKET BY REGION,2021
FIGURE 23.U.S. MURUMURU BUTTER MARKET,2021-2031($MILLION)
FIGURE 24.CANADA MURUMURU BUTTER MARKET,2021-2031($MILLION)
FIGURE 25.MEXICO MURUMURU BUTTER MARKET,2021-2031($MILLION)
FIGURE 26.U.K. MURUMURU BUTTER MARKET,2021-2031($MILLION)
FIGURE 27.ITALY MURUMURU BUTTER MARKET,2021-2031($MILLION)
FIGURE 28.SPAIN MURUMURU BUTTER MARKET,2021-2031($MILLION)
FIGURE 29.RUSSIA MURUMURU BUTTER MARKET,2021-2031($MILLION)
FIGURE 30.TURKEY MURUMURU BUTTER MARKET,2021-2031($MILLION)
FIGURE 31.REST OF EUROPE MURUMURU BUTTER MARKET,2021-2031($MILLION)
FIGURE 32.CHINA MURUMURU BUTTER MARKET,2021-2031($MILLION)
FIGURE 33.JAPAN MURUMURU BUTTER MARKET,2021-2031($MILLION)
FIGURE 34.INDIA MURUMURU BUTTER MARKET,2021-2031($MILLION)
FIGURE 35.THAILAND MURUMURU BUTTER MARKET,2021-2031($MILLION)
FIGURE 36.AUSTRALIA MURUMURU BUTTER MARKET,2021-2031($MILLION)
FIGURE 37.REST OF ASIA-PACIFIC MURUMURU BUTTER MARKET,2021-2031($MILLION)
FIGURE 38.BRAZIL MURUMURU BUTTER MARKET,2021-2031($MILLION)
FIGURE 39.ARGENTINA MURUMURU BUTTER MARKET,2021-2031($MILLION)
FIGURE 40.UAE MURUMURU BUTTER MARKET,2021-2031($MILLION)
FIGURE 41.REST OF LAMEA MURUMURU BUTTER MARKET,2021-2031($MILLION)
FIGURE 42. TOP WINNING STRATEGIES, BY YEAR
FIGURE 43. TOP WINNING STRATEGIES, BY DEVELOPMENT
FIGURE 44. TOP WINNING STRATEGIES, BY COMPANY
FIGURE 45.PRODUCT MAPPING OF TOP 10 PLAYERS
FIGURE 46.COMPETITIVE DASHBOARD
FIGURE 47.COMPETITIVE HEATMAP OF TOP 10 KEY PLAYERS
FIGURE 48.CITRÓLEO GROUPS.: NET SALES ,($MILLION)
FIGURE 49.NATURAL PRODUCTS.: NET SALES ,($MILLION)
FIGURE 50.JARCHEM INDUSTRIES.: NET SALES ,($MILLION)
FIGURE 51.BERACA INGREDIENTES NATURAIS SA.: NET SALES ,($MILLION)
FIGURE 52.LUSH RETAIL.: NET SALES ,($MILLION)
FIGURE 53.NATURAL SOURCING.: NET SALES ,($MILLION)
FIGURE 54.CRAFTERS CHOICE BRANDS.: NET SALES ,($MILLION)
FIGURE 55.VIGON INTERNATIONAL.: NET SALES ,($MILLION)
FIGURE 56.O&3.: NET SALES ,($MILLION)
FIGURE 57.HALLSTAR.: NET SALES ,($MILLION)
FIGURE 58.HENRY LAMOTTE OILS GMBH.: NET SALES ,($MILLION)
FIGURE 59.GRACEFRUIT.: NET SALES ,($MILLION)
FIGURE 60.PARCHEM FINE & SPECIALITY CHEMICAL.: NET SALES ,($MILLION)
FIGURE 61.MYSTIC MOMENTS.: NET SALES ,($MILLION)
FIGURE 62.JADEWARD INTERNATIONAL.: NET SALES ,($MILLION)
FIGURE 63.PARIS FRAGNANCE USA.: NET SALES ,($MILLION
SELECT A FORMAT
Added to Cart
Electronic (PDF)

$5730

This license allows only one user to access the PDF.
Electronic (PDF)

$6450

This license allows 1 - 5 user to access the PDF, license is suitable for small groups of 5 users working together
Electronic (PDF)

$9600

This license allows users/teams in a same Enterprise to use this report, various departments within an enterpise can use this report
Electronic (PDF)

$3840

This license just provides quantitative data in a excel sheet
Add to Cart
Buy Now (15% Discount)

OUR CUSTOMER

Nano String

SIMILAR REPORTS


RELATED REPORTS

Global Acne Skin Model Market Research Report 2025

120 Pages
Type: Report
Code: QYRE-Auto-12M20173
Mon Nov 24 00:00:00 UTC 2025

Add to Cart

Global Paraben Free Skin Care Market Research Report 2025

120 Pages
Type: Report
Code: QYRE-Auto-18B20087
Wed Nov 19 00:00:00 UTC 2025

Add to Cart

Global Skincare Supplement Market Research Report 2025

120 Pages
Type: Report
Code: QYRE-Auto-35W19908
Wed Nov 19 00:00:00 UTC 2025

Add to Cart

Global Electric Blackhead Removal Instrument Market Outlook, In‑Depth Analysis & Forecast to 2031

120 Pages
Type: Report
Code: QYRE-Auto-6B17316
Wed Nov 12 00:00:00 UTC 2025

Add to Cart