0
U.S. (TOLL FREE)
+1 (315) 215-3225
Automative

0
U.S. (TOLL FREE)
+1 (315) 215-3225
BNP And NTproBNP Market By Application (Myocardial Infarction, Congestive Heart Failure, Acute Coronary Syndrome (ACS), Others), By Location of Testing (Point of Care Testing, Laboratory Testing): Global Opportunity Analysis and Industry Forecast, 2021-2031
Published Date: 2023-02-01
|
Report Code: ALLI-Auto-0E792
Home | Market Reports | Health| Health Conditions| Heart & Hypertension
BNP And NTproBNP Market By Application Myocardial Infarction Congestive Heart Failure Acute Coronary Syndrome ACS Others By Location of Testing Point of Care Testing Laboratory Testing Global Opportunity Analysis and Industry Forecast 2021 2031
BUY CHAPTERS

BNP And NTproBNP Market By Application (Myocardial Infarction, Congestive Heart Failure, Acute Coronary Syndrome (ACS), Others), By Location of Testing (Point of Care Testing, Laboratory Testing): Global Opportunity Analysis and Industry Forecast, 2021-2031

Code: ALLI-Auto-0E792
Report
2023-02-01
Pages:213
Allied Market Research
Buy Now with 15% Discount
DESCRIPTION
TABLE OF CONTENT
TABLES & FIGURES

BNP And NTproBNP Market Size

According to a new report published by , titled, “Bnp And Ntprobnp Market," The bnp and ntprobnp market was valued at $1.1 billion in 2021, and is estimated to reach $3.4 billion by 2031, growing at a CAGR of 12.2% from 2022 to 2031. 

BNP And NTproBNP Market

BNP And NTproBNP Market

BNP and NTproBNP are peptide hormones and are commonly used as biomarkers in the diagnosis and management of heart failure. These hormones are produced by the heart in response to increased pressure and stretching of heart muscle cells. The elevated levels of BNP and NTproBNP in the blood indicate heart failure. Thus, BNP and NTproBNP tests are used to diagnose and manage various cardiovascular conditions such as heart failure, myocardial infarction, and others. The early diagnosis of cardiovascular diseases is crucial to improve patient outcomes and reducing the overall cost of care. Therefore, BNP (B-type natriuretic peptide) and NTproBNP (N-terminal pro-B-type natriuretic peptide) are widely used as the most promising biomarkers for the diagnosis of various cardiovascular diseases.
Key factors driving the growth of the BNP and NTproBNP market include an increase in the prevalence of heart failure as heart failure is a common and serious condition, which drives the demand for BNP and NTproBNP tests for diagnosis and management of diseases and advancements in diagnostic technologies such as high-sensitivity BNP and NTproBNP assays. For instance, Abbott’s ARCHITECT high Sensitive BNP assay is a chemiluminescent microparticle immunoassay (CMIA) for the quantitative determination of human B-type natriuretic peptide (BNP) in humans. It offers improved accuracy, sensitivity, and specificity, and is used for the early detection of heart failure and for evaluating the efficacy of treatment. In addition, Roche’s Elecsys proBNP II assay is indicated for the risk stratification of patients with acute coronary syndrome, and congestive heart failure (CHF), and it is also used for monitoring the treatment in patients with left ventricular dysfunction. Therefore, the rise in the prevalence of heart failure and improved accuracy of BNP and NTproBNP testing propels the growth of the market.
The market also offers growth opportunities to the key players in the market. Rise in awareness about biomarker diagnostic testing as the biomarker tests are non-invasive, provides quick results allow for prompt diagnosis and treatment, and biomarker testing is more cost-effective than traditional diagnostic methods and increase in point-of-care testing in developed and developing countries such as U.S. and India expected to create lucrative growth opportunities for market growth. Moreover, the rise in disposable income in India and China also contributes toward the market growth during the forecast period. In addition, the wide availability of BNP and NTproBNP point-of-care testing which allows for rapid testing at outpatient settings increases the adoption of BNP and NTproBNP testing.
Moreover, continued advancements in BNP and NTproBNP testing technology, including the development of high-sensitivity assays and machine learning algorithms, are expected to drive market growth by improving the accuracy and efficiency of testing.
Furthermore, an increase in demand for personalized medicine and growing awareness of the importance of early disease diagnosis are the key factors that drive market growth. For instance, BNP and NTproBNP tests provide valuable information to guide treatment decisions for heart failure patients, making them an important tool of personalized medicine. Additionally, the demand for BNP and NTproBNP testing is not only limited to developed countries but is also being witnessed in developing countries, such as China, and India, which fuels the growth of the market. Factors such as a rise in the incidence of heart failure, an increase in the number of the geriatric population more susceptible to cardiovascular diseases, an increase in R&D investments in the discovery & development of novel biomarker-based testing, and rise in awareness regarding early detection of diseases, further drive the growth of the market. 
The BNP and NTproBNP market is segmented on the basis of application, location of testing, and region. On the basis of application, the market is classified into myocardial infarction, congestive heart failure (CHF), acute coronary syndrome (ACS), and others. On the basis of the location of testing, the market is segmented into point-of-care testing and laboratory testing. On the basis of region, the market is analyzed across North America (the U.S., Canada, and Mexico), Europe (Germany, France, UK, Italy, Spain, and the Rest of Europe), Asia-Pacific (Japan, China, Australia, India, South Korea, and Rest of Asia-Pacific), and LAMEA (Brazil, South Africa, Saudi Arabia, and rest of LAMEA).
The key players profiled in the study include Abbott Laboratories, BioMerieux SA, Bio-Rad Laboratories, Inc., Danaher Corporation, F. Hoffman La Roche Ltd., Gentian Diagnostics ASA, PerkinElmer Inc., Quidel Corporation, Scripps Laboratories, Siemens AG.
Key Market Insights
By application, the myocardial infarction segment was the highest revenue contributor to the market in 2021 and is estimated to reach $1.2 billion by 2031.
By location of testing, the point-of-care testing segment dominated the global market in 2021.
Based on region, Asia-Pacific garnered the largest revenue share in 2021 and is anticipated to grow at the highest CAGR of 13.5% during the forecast period.

Overview

The global bnp and ntprobnp market was valued at $1.1 billion in 2021 and is projected to reach $3.4 billion by 2031, growing at a CAGR of 12.2% from 2022 to 2031. BNP (B-type natriuretic peptide) and NTproBNP (N-terminal pro-B-type natriuretic peptide) are the peptide hormones secreted by cardiomyocytes in the heart. BNP and NT-proBNP levels in the blood are increased due to ventricle stretching caused by increased ventricular blood volume. Therefore, BNP and NT-proBNP levels in the blood can be used as markers for heart failure. The elevated levels of these peptides are indicative of heart failure and can help in the diagnosis and management of the condition.  In addition, they can also be used to monitor the progression of heart failure and predict the risk of hospitalization. These reagents are used to detect the risk of myocardial infarction, acute coronary syndrome (ACS), congestive heart failure, and other cardiac diseases. 
The BNP and NTproBNP market growth is driven by an increase in the number of patients who suffer from various cardiovascular diseases, an increase in the use of BNP and NTproBNP as diagnostic biomarkers, and an increase in awareness about the use of BNP and NTproBNP biomarkers in the diagnosis and management of heart failure. There is a rapid decrease in the prevalence of cardiovascular diseases such as myocardial infarction, and congestive heart failure (CHF), therefore, the diagnosis of these cardiac diseases is notably important in clinical and forensic medication which is expected to drive the demand for BNP and NTproBNP biomarkers. For instance, according to the data published by American Heart Association (AHA), in January 2021, an estimated 805,000 Americans may experience acute coronary syndrome (ACS) events annually out of which 605,000 cases will be new attacks and 200,000 are recurrent attacks. In addition, as per the same source, Americans are projected to suffer from acute coronary syndrome events nearly every 40 seconds. Thus, the rise in the prevalence of cardiovascular diseases has resulted in increased demand for BNP and NTproBNP which, in turn, contribute to market growth.
Furthermore, a rise in the development of new assay methods and reagents is the key factor that boosts market growth. For instance, in December 2022, granted a patent in the U.S. for NT-proBNP. The Gentian NT-proBNP immunoassay is used in the diagnosis and assessment of severe congestive heart failure (CHF), in suspected individuals. The pre-launch of NT-proBNP immunoassay will help the company to gain a strong foothold in BNP and NTproBNP market, as it is cost-effective and provide an accurate diagnosis of cardiac disease.
However, the factor that restrains market growth includes limited specificity and strict regulatory policies for product approval limiting the adoption of BNP and NTproBNP. 
On the other hand, an increase in awareness about early disease diagnosis has increased the demand for BNP and NTproBNP for the diagnosis of cardiovascular diseases in developed countries such as the U.S., and Canada, and is expected to create immense opportunities for the growth of the BNP and NTproBNP market during the forecast period. 
The BNP and NTproBNP market is segmented on the basis of application, location of testing, and region. On the basis of application, the market is classified into myocardial infarction, congestive heart failure (CHF), acute coronary syndrome (ACS), and others. On the basis of the location of testing, the market is segmented into point-of-care testing and laboratory testing. On the basis of region, the market is analyzed across North America (the U.S., Canada, and Mexico), Europe (Germany, France, UK, Italy, Spain, and the Rest of Europe), Asia-Pacific (Japan, China, Australia, India, South Korea, and Rest of Asia-Pacific), and LAMEA (Brazil, South Africa, Saudi Arabia, and rest of LAMEA).
Major key players that operate in the global BNP and NTproBNP Market are Abbott Laboratories, BioMerieux SA, Bio-Rad Laboratories, Inc., Danaher Corporation, F. Hoffman La Roche Ltd., Gentian Diagnostics ASA, PerkinElmer Inc., Quidel Corporation, Scripps Laboratories, and Siemens AG.

Key Benefits For Stakeholders

This report provides a quantitative analysis of the market segments, current trends, estimations, and dynamics of the bnp and ntprobnp market analysis from 2021 to 2031 to identify the prevailing bnp and ntprobnp market opportunities.
Market research is offered along with information related to key drivers, restraints, and opportunities.
Porter's five forces analysis highlights the potency of buyers and suppliers to enable stakeholders to make profit-oriented business decisions and strengthen their supplier-buyer network.
An in-depth analysis of the bnp and ntprobnp market segmentation assists to determine the prevailing market opportunities.
Major countries in each region are mapped according to their revenue contribution to the global market.
Market player positioning facilitates benchmarking and provides a clear understanding of the present position of the market players.
The report includes analysis of the regional as well as global bnp and ntprobnp market trends, key players, market segments, application areas, and market growth strategies.
Key Market Segments
○ F Hoffman La Roche Ltd

Scope of BNP And NTproBNP Market Report

Report Metric Details
Report Name BNP And NTproBNP Market
Accounted market size in 2021 $ 1.1 billion
Forecasted market size in 2031 $ 3.4 billion
CAGR 12.2%
Base Year 2021
Forecasted years 2024 - 2031
By Application ● Myocardial Infarction
● Congestive Heart Failure
● Acute Coronary Syndrome (ACS)
● Others
By Location of Testing ● Point of Care Testing
● Laboratory Testing
By Region
  • North America (United States, Canada)
  • Europe (Germany, France, UK, Italy, Russia) Rest of Europe
  • Nordic Countries
  • Asia-Pacific (China, Japan, South Korea)
  • Southeast Asia (India, Australia)
  • Rest of Asia
  • Latin America (Mexico, Brazil)
  • Rest of Latin America
  • Middle East & Africa (Turkey, Saudi Arabia, UAE, Rest of MEA)
Forecast units USD million in value
Report coverage Revenue and volume forecast, company share, competitive landscape, growth factors and trends

FAQ for this report

How fast is BNP And NTproBNP Market growing?

Ans: The BNP And NTproBNP Market witnessing a CAGR of 12.2% during the forecast period 2024-2031.

What is the BNP And NTproBNP Market size in 2031?

Ans: The BNP And NTproBNP Market size in 2031 will be $ 3.4 billion.

What are the Application segmentation covered in the BNP And NTproBNP Market report?

Ans: The Applications covered in the BNP And NTproBNP Market report are ● Myocardial Infarction, ● Congestive Heart Failure, ● Acute Coronary Syndrome (ACS), ● Others

CHAPTER 1: INTRODUCTION
1.1. Report description
1.2. Key market segments
1.3. Key benefits to the stakeholders
1.4. Research Methodology
1.4.1. Primary research
1.4.2. Secondary research
1.4.3. Analyst tools and models
CHAPTER 2: EXECUTIVE SUMMARY
2.1. CXO Perspective
CHAPTER 3: MARKET OVERVIEW
3.1. Market definition and scope
3.2. Key findings
3.2.1. Top impacting factors
3.2.2. Top investment pockets
3.3. Porter’s five forces analysis
3.3.1. Bargaining power of suppliers
3.3.2. Bargaining power of buyers
3.3.3. Threat of substitutes
3.3.4. Threat of new entrants
3.3.5. Intensity of rivalry
3.4. Market dynamics
3.4.1. Drivers
3.4.1.1. Increase in prevalence of heart failures
3.4.1.2. Growing adoption of Point of care testing
3.4.2. Restraints
3.4.2.1. Stringent government regulations
3.4.3. Opportunities
3.4.3.1. Growing awareness of early diagnosis for heart failure
3.5. COVID-19 Impact Analysis on the market
CHAPTER 4: BNP AND NTPROBNP MARKET, BY APPLICATION
4.1. Overview
4.1.1. Market size and forecast
4.2. Myocardial Infarction
4.2.1. Key market trends, growth factors and opportunities
4.2.2. Market size and forecast, by region
4.2.3. Market share analysis by country
4.3. Congestive Heart Failure
4.3.1. Key market trends, growth factors and opportunities
4.3.2. Market size and forecast, by region
4.3.3. Market share analysis by country
4.4. Acute Coronary Syndrome (ACS)
4.4.1. Key market trends, growth factors and opportunities
4.4.2. Market size and forecast, by region
4.4.3. Market share analysis by country
4.5. Others
4.5.1. Key market trends, growth factors and opportunities
4.5.2. Market size and forecast, by region
4.5.3. Market share analysis by country
CHAPTER 5: BNP AND NTPROBNP MARKET, BY LOCATION OF TESTING
5.1. Overview
5.1.1. Market size and forecast
5.2. Point of Care Testing
5.2.1. Key market trends, growth factors and opportunities
5.2.2. Market size and forecast, by region
5.2.3. Market share analysis by country
5.3. Laboratory Testing
5.3.1. Key market trends, growth factors and opportunities
5.3.2. Market size and forecast, by region
5.3.3. Market share analysis by country
CHAPTER 6: BNP AND NTPROBNP MARKET, BY REGION
6.1. Overview
6.1.1. Market size and forecast By Region
6.2. North America
6.2.1. Key trends and opportunities
6.2.2. Market size and forecast, by Application
6.2.3. Market size and forecast, by Location of Testing
6.2.4. Market size and forecast, by country
6.2.4.1. U.S.
6.2.4.1.1. Key market trends, growth factors and opportunities
6.2.4.1.2. Market size and forecast, by Application
6.2.4.1.3. Market size and forecast, by Location of Testing
6.2.4.2. Canada
6.2.4.2.1. Key market trends, growth factors and opportunities
6.2.4.2.2. Market size and forecast, by Application
6.2.4.2.3. Market size and forecast, by Location of Testing
6.2.4.3. Mexico
6.2.4.3.1. Key market trends, growth factors and opportunities
6.2.4.3.2. Market size and forecast, by Application
6.2.4.3.3. Market size and forecast, by Location of Testing
6.3. Europe
6.3.1. Key trends and opportunities
6.3.2. Market size and forecast, by Application
6.3.3. Market size and forecast, by Location of Testing
6.3.4. Market size and forecast, by country
6.3.4.1. UK
6.3.4.1.1. Key market trends, growth factors and opportunities
6.3.4.1.2. Market size and forecast, by Application
6.3.4.1.3. Market size and forecast, by Location of Testing
6.3.4.2. France
6.3.4.2.1. Key market trends, growth factors and opportunities
6.3.4.2.2. Market size and forecast, by Application
6.3.4.2.3. Market size and forecast, by Location of Testing
6.3.4.3. Germany
6.3.4.3.1. Key market trends, growth factors and opportunities
6.3.4.3.2. Market size and forecast, by Application
6.3.4.3.3. Market size and forecast, by Location of Testing
6.3.4.4. Italy
6.3.4.4.1. Key market trends, growth factors and opportunities
6.3.4.4.2. Market size and forecast, by Application
6.3.4.4.3. Market size and forecast, by Location of Testing
6.3.4.5. Spain
6.3.4.5.1. Key market trends, growth factors and opportunities
6.3.4.5.2. Market size and forecast, by Application
6.3.4.5.3. Market size and forecast, by Location of Testing
6.3.4.6. Rest of Europe
6.3.4.6.1. Key market trends, growth factors and opportunities
6.3.4.6.2. Market size and forecast, by Application
6.3.4.6.3. Market size and forecast, by Location of Testing
6.4. Asia-Pacific
6.4.1. Key trends and opportunities
6.4.2. Market size and forecast, by Application
6.4.3. Market size and forecast, by Location of Testing
6.4.4. Market size and forecast, by country
6.4.4.1. China
6.4.4.1.1. Key market trends, growth factors and opportunities
6.4.4.1.2. Market size and forecast, by Application
6.4.4.1.3. Market size and forecast, by Location of Testing
6.4.4.2. India
6.4.4.2.1. Key market trends, growth factors and opportunities
6.4.4.2.2. Market size and forecast, by Application
6.4.4.2.3. Market size and forecast, by Location of Testing
6.4.4.3. Australia
6.4.4.3.1. Key market trends, growth factors and opportunities
6.4.4.3.2. Market size and forecast, by Application
6.4.4.3.3. Market size and forecast, by Location of Testing
6.4.4.4. Japan
6.4.4.4.1. Key market trends, growth factors and opportunities
6.4.4.4.2. Market size and forecast, by Application
6.4.4.4.3. Market size and forecast, by Location of Testing
6.4.4.5. Rest of Asia-Pacific
6.4.4.5.1. Key market trends, growth factors and opportunities
6.4.4.5.2. Market size and forecast, by Application
6.4.4.5.3. Market size and forecast, by Location of Testing
6.5. LAMEA
6.5.1. Key trends and opportunities
6.5.2. Market size and forecast, by Application
6.5.3. Market size and forecast, by Location of Testing
6.5.4. Market size and forecast, by country
6.5.4.1. Brazil
6.5.4.1.1. Key market trends, growth factors and opportunities
6.5.4.1.2. Market size and forecast, by Application
6.5.4.1.3. Market size and forecast, by Location of Testing
6.5.4.2. Saudi Arabia
6.5.4.2.1. Key market trends, growth factors and opportunities
6.5.4.2.2. Market size and forecast, by Application
6.5.4.2.3. Market size and forecast, by Location of Testing
6.5.4.3. South Africa
6.5.4.3.1. Key market trends, growth factors and opportunities
6.5.4.3.2. Market size and forecast, by Application
6.5.4.3.3. Market size and forecast, by Location of Testing
6.5.4.4. Rest of LAMEA
6.5.4.4.1. Key market trends, growth factors and opportunities
6.5.4.4.2. Market size and forecast, by Application
6.5.4.4.3. Market size and forecast, by Location of Testing
CHAPTER 7: COMPETITIVE LANDSCAPE
7.1. Introduction
7.2. Top winning strategies
7.3. Product Mapping of Top 10 Player
7.4. Competitive Dashboard
7.5. Competitive Heatmap
7.6. Top player positioning, 2021
CHAPTER 8: COMPANY PROFILES
8.1. Quidel Corporation
8.1.1. Company overview
8.1.2. Key Executives
8.1.3. Company snapshot
8.1.4. Operating business segments
8.1.5. Product portfolio
8.1.6. Business performance
8.2. Scripps Laboratories
8.2.1. Company overview
8.2.2. Key Executives
8.2.3. Company snapshot
8.2.4. Operating business segments
8.2.5. Product portfolio
8.3. Gentian Diagnostics ASA
8.3.1. Company overview
8.3.2. Key Executives
8.3.3. Company snapshot
8.3.4. Operating business segments
8.3.5. Product portfolio
8.3.6. Business performance
8.3.7. Key strategic moves and developments
8.4. Siemens AG
8.4.1. Company overview
8.4.2. Key Executives
8.4.3. Company snapshot
8.4.4. Operating business segments
8.4.5. Product portfolio
8.4.6. Business performance
8.5. Danaher Corporation
8.5.1. Company overview
8.5.2. Key Executives
8.5.3. Company snapshot
8.5.4. Operating business segments
8.5.5. Product portfolio
8.5.6. Business performance
8.6. Biomerieux SA
8.6.1. Company overview
8.6.2. Key Executives
8.6.3. Company snapshot
8.6.4. Operating business segments
8.6.5. Product portfolio
8.6.6. Business performance
8.7. PerkinElmer Inc.
8.7.1. Company overview
8.7.2. Key Executives
8.7.3. Company snapshot
8.7.4. Operating business segments
8.7.5. Product portfolio
8.7.6. Business performance
8.8. F Hoffman La Roche Ltd.
8.8.1. Company overview
8.8.2. Key Executives
8.8.3. Company snapshot
8.8.4. Operating business segments
8.8.5. Product portfolio
8.8.6. Business performance
8.9. Bio-Rad Laboratories, Inc.
8.9.1. Company overview
8.9.2. Key Executives
8.9.3. Company snapshot
8.9.4. Operating business segments
8.9.5. Product portfolio
8.9.6. Business performance
8.10. Abbott Laboratories
8.10.1. Company overview
8.10.2. Key Executives
8.10.3. Company snapshot
8.10.4. Operating business segments
8.10.5. Product portfolio
8.10.6. Business performanc
LIST OF TABLES
TABLE 01. GLOBAL BNP AND NTPROBNP MARKET, BY APPLICATION, 2021-2031 ($MILLION)
TABLE 02. BNP AND NTPROBNP MARKET FOR MYOCARDIAL INFARCTION, BY REGION, 2021-2031 ($MILLION)
TABLE 03. BNP AND NTPROBNP MARKET FOR CONGESTIVE HEART FAILURE, BY REGION, 2021-2031 ($MILLION)
TABLE 04. BNP AND NTPROBNP MARKET FOR ACUTE CORONARY SYNDROME (ACS), BY REGION, 2021-2031 ($MILLION)
TABLE 05. BNP AND NTPROBNP MARKET FOR OTHERS, BY REGION, 2021-2031 ($MILLION)
TABLE 06. GLOBAL BNP AND NTPROBNP MARKET, BY LOCATION OF TESTING, 2021-2031 ($MILLION)
TABLE 07. BNP AND NTPROBNP MARKET FOR POINT OF CARE TESTING, BY REGION, 2021-2031 ($MILLION)
TABLE 08. BNP AND NTPROBNP MARKET FOR LABORATORY TESTING, BY REGION, 2021-2031 ($MILLION)
TABLE 09. BNP AND NTPROBNP MARKET, BY REGION, 2021-2031 ($MILLION)
TABLE 10. NORTH AMERICA BNP AND NTPROBNP MARKET, BY APPLICATION, 2021-2031 ($MILLION)
TABLE 11. NORTH AMERICA BNP AND NTPROBNP MARKET, BY LOCATION OF TESTING, 2021-2031 ($MILLION)
TABLE 12. NORTH AMERICA BNP AND NTPROBNP MARKET, BY COUNTRY, 2021-2031 ($MILLION)
TABLE 13. U.S. BNP AND NTPROBNP MARKET, BY APPLICATION, 2021-2031 ($MILLION)
TABLE 14. U.S. BNP AND NTPROBNP MARKET, BY LOCATION OF TESTING, 2021-2031 ($MILLION)
TABLE 15. CANADA BNP AND NTPROBNP MARKET, BY APPLICATION, 2021-2031 ($MILLION)
TABLE 16. CANADA BNP AND NTPROBNP MARKET, BY LOCATION OF TESTING, 2021-2031 ($MILLION)
TABLE 17. MEXICO BNP AND NTPROBNP MARKET, BY APPLICATION, 2021-2031 ($MILLION)
TABLE 18. MEXICO BNP AND NTPROBNP MARKET, BY LOCATION OF TESTING, 2021-2031 ($MILLION)
TABLE 19. EUROPE BNP AND NTPROBNP MARKET, BY APPLICATION, 2021-2031 ($MILLION)
TABLE 20. EUROPE BNP AND NTPROBNP MARKET, BY LOCATION OF TESTING, 2021-2031 ($MILLION)
TABLE 21. EUROPE BNP AND NTPROBNP MARKET, BY COUNTRY, 2021-2031 ($MILLION)
TABLE 22. UK BNP AND NTPROBNP MARKET, BY APPLICATION, 2021-2031 ($MILLION)
TABLE 23. UK BNP AND NTPROBNP MARKET, BY LOCATION OF TESTING, 2021-2031 ($MILLION)
TABLE 24. FRANCE BNP AND NTPROBNP MARKET, BY APPLICATION, 2021-2031 ($MILLION)
TABLE 25. FRANCE BNP AND NTPROBNP MARKET, BY LOCATION OF TESTING, 2021-2031 ($MILLION)
TABLE 26. GERMANY BNP AND NTPROBNP MARKET, BY APPLICATION, 2021-2031 ($MILLION)
TABLE 27. GERMANY BNP AND NTPROBNP MARKET, BY LOCATION OF TESTING, 2021-2031 ($MILLION)
TABLE 28. ITALY BNP AND NTPROBNP MARKET, BY APPLICATION, 2021-2031 ($MILLION)
TABLE 29. ITALY BNP AND NTPROBNP MARKET, BY LOCATION OF TESTING, 2021-2031 ($MILLION)
TABLE 30. SPAIN BNP AND NTPROBNP MARKET, BY APPLICATION, 2021-2031 ($MILLION)
TABLE 31. SPAIN BNP AND NTPROBNP MARKET, BY LOCATION OF TESTING, 2021-2031 ($MILLION)
TABLE 32. REST OF EUROPE BNP AND NTPROBNP MARKET, BY APPLICATION, 2021-2031 ($MILLION)
TABLE 33. REST OF EUROPE BNP AND NTPROBNP MARKET, BY LOCATION OF TESTING, 2021-2031 ($MILLION)
TABLE 34. ASIA-PACIFIC BNP AND NTPROBNP MARKET, BY APPLICATION, 2021-2031 ($MILLION)
TABLE 35. ASIA-PACIFIC BNP AND NTPROBNP MARKET, BY LOCATION OF TESTING, 2021-2031 ($MILLION)
TABLE 36. ASIA-PACIFIC BNP AND NTPROBNP MARKET, BY COUNTRY, 2021-2031 ($MILLION)
TABLE 37. CHINA BNP AND NTPROBNP MARKET, BY APPLICATION, 2021-2031 ($MILLION)
TABLE 38. CHINA BNP AND NTPROBNP MARKET, BY LOCATION OF TESTING, 2021-2031 ($MILLION)
TABLE 39. INDIA BNP AND NTPROBNP MARKET, BY APPLICATION, 2021-2031 ($MILLION)
TABLE 40. INDIA BNP AND NTPROBNP MARKET, BY LOCATION OF TESTING, 2021-2031 ($MILLION)
TABLE 41. AUSTRALIA BNP AND NTPROBNP MARKET, BY APPLICATION, 2021-2031 ($MILLION)
TABLE 42. AUSTRALIA BNP AND NTPROBNP MARKET, BY LOCATION OF TESTING, 2021-2031 ($MILLION)
TABLE 43. JAPAN BNP AND NTPROBNP MARKET, BY APPLICATION, 2021-2031 ($MILLION)
TABLE 44. JAPAN BNP AND NTPROBNP MARKET, BY LOCATION OF TESTING, 2021-2031 ($MILLION)
TABLE 45. REST OF ASIA-PACIFIC BNP AND NTPROBNP MARKET, BY APPLICATION, 2021-2031 ($MILLION)
TABLE 46. REST OF ASIA-PACIFIC BNP AND NTPROBNP MARKET, BY LOCATION OF TESTING, 2021-2031 ($MILLION)
TABLE 47. LAMEA BNP AND NTPROBNP MARKET, BY APPLICATION, 2021-2031 ($MILLION)
TABLE 48. LAMEA BNP AND NTPROBNP MARKET, BY LOCATION OF TESTING, 2021-2031 ($MILLION)
TABLE 49. LAMEA BNP AND NTPROBNP MARKET, BY COUNTRY, 2021-2031 ($MILLION)
TABLE 50. BRAZIL BNP AND NTPROBNP MARKET, BY APPLICATION, 2021-2031 ($MILLION)
TABLE 51. BRAZIL BNP AND NTPROBNP MARKET, BY LOCATION OF TESTING, 2021-2031 ($MILLION)
TABLE 52. SAUDI ARABIA BNP AND NTPROBNP MARKET, BY APPLICATION, 2021-2031 ($MILLION)
TABLE 53. SAUDI ARABIA BNP AND NTPROBNP MARKET, BY LOCATION OF TESTING, 2021-2031 ($MILLION)
TABLE 54. SOUTH AFRICA BNP AND NTPROBNP MARKET, BY APPLICATION, 2021-2031 ($MILLION)
TABLE 55. SOUTH AFRICA BNP AND NTPROBNP MARKET, BY LOCATION OF TESTING, 2021-2031 ($MILLION)
TABLE 56. REST OF LAMEA BNP AND NTPROBNP MARKET, BY APPLICATION, 2021-2031 ($MILLION)
TABLE 57. REST OF LAMEA BNP AND NTPROBNP MARKET, BY LOCATION OF TESTING, 2021-2031 ($MILLION)
TABLE 58. QUIDEL CORPORATION: KEY EXECUTIVES
TABLE 59. QUIDEL CORPORATION: COMPANY SNAPSHOT
TABLE 60. QUIDEL CORPORATION: PRODUCT SEGMENTS
TABLE 61. QUIDEL CORPORATION: PRODUCT PORTFOLIO
TABLE 62. SCRIPPS LABORATORIES: KEY EXECUTIVES
TABLE 63. SCRIPPS LABORATORIES: COMPANY SNAPSHOT
TABLE 64. SCRIPPS LABORATORIES: PRODUCT SEGMENTS
TABLE 65. SCRIPPS LABORATORIES: PRODUCT PORTFOLIO
TABLE 66. GENTIAN DIAGNOSTICS ASA: KEY EXECUTIVES
TABLE 67. GENTIAN DIAGNOSTICS ASA: COMPANY SNAPSHOT
TABLE 68. GENTIAN DIAGNOSTICS ASA: PRODUCT SEGMENTS
TABLE 69. GENTIAN DIAGNOSTICS ASA: PRODUCT PORTFOLIO
TABLE 70. GENTIAN DIAGNOSTICS ASA: KEY STRATERGIES
TABLE 71. SIEMENS AG: KEY EXECUTIVES
TABLE 72. SIEMENS AG: COMPANY SNAPSHOT
TABLE 73. SIEMENS AG: PRODUCT SEGMENTS
TABLE 74. SIEMENS AG: PRODUCT PORTFOLIO
TABLE 75. DANAHER CORPORATION: KEY EXECUTIVES
TABLE 76. DANAHER CORPORATION: COMPANY SNAPSHOT
TABLE 77. DANAHER CORPORATION: PRODUCT SEGMENTS
TABLE 78. DANAHER CORPORATION: PRODUCT PORTFOLIO
TABLE 79. BIOMERIEUX SA: KEY EXECUTIVES
TABLE 80. BIOMERIEUX SA: COMPANY SNAPSHOT
TABLE 81. BIOMERIEUX SA: PRODUCT SEGMENTS
TABLE 82. BIOMERIEUX SA: PRODUCT PORTFOLIO
TABLE 83. PERKINELMER INC.: KEY EXECUTIVES
TABLE 84. PERKINELMER INC.: COMPANY SNAPSHOT
TABLE 85. PERKINELMER INC.: PRODUCT SEGMENTS
TABLE 86. PERKINELMER INC.: PRODUCT PORTFOLIO
TABLE 87. F HOFFMAN LA ROCHE LTD.: KEY EXECUTIVES
TABLE 88. F HOFFMAN LA ROCHE LTD.: COMPANY SNAPSHOT
TABLE 89. F HOFFMAN LA ROCHE LTD.: PRODUCT SEGMENTS
TABLE 90. F HOFFMAN LA ROCHE LTD.: PRODUCT PORTFOLIO
TABLE 91. BIO-RAD LABORATORIES, INC.: KEY EXECUTIVES
TABLE 92. BIO-RAD LABORATORIES, INC.: COMPANY SNAPSHOT
TABLE 93. BIO-RAD LABORATORIES, INC.: PRODUCT SEGMENTS
TABLE 94. BIO-RAD LABORATORIES, INC.: PRODUCT PORTFOLIO
TABLE 95. ABBOTT LABORATORIES: KEY EXECUTIVES
TABLE 96. ABBOTT LABORATORIES: COMPANY SNAPSHOT
TABLE 97. ABBOTT LABORATORIES: PRODUCT SEGMENTS
TABLE 98. ABBOTT LABORATORIES: PRODUCT PORTFOLIO LIST OF FIGURES
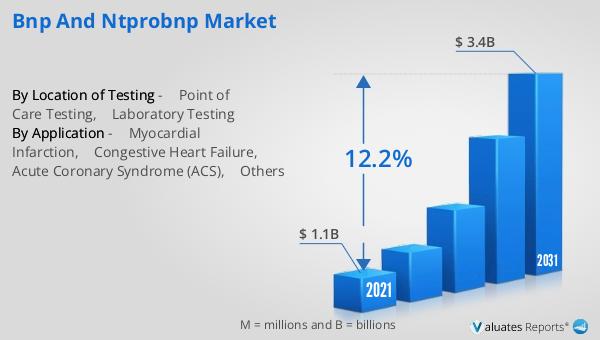
FIGURE 01. BNP AND NTPROBNP MARKET, 2021-2031
FIGURE 02. SEGMENTATION OF BNP AND NTPROBNP MARKET, 2021-2031
FIGURE 03. TOP INVESTMENT POCKETS IN BNP AND NTPROBNP MARKET (2022-2031)
FIGURE 04. LOW BARGAINING POWER OF SUPPLIERS
FIGURE 05. LOW BARGAINING POWER OF BUYERS
FIGURE 06. LOW THREAT OF SUBSTITUTES
FIGURE 07. LOW THREAT OF NEW ENTRANTS
FIGURE 08. LOW INTENSITY OF RIVALRY
FIGURE 09. DRIVERS, RESTRAINTS AND OPPORTUNITIES: GLOBALBNP AND NTPROBNP MARKET
FIGURE 10. BNP AND NTPROBNP MARKET, BY APPLICATION, 2021(%)
FIGURE 11. COMPARATIVE SHARE ANALYSIS OF BNP AND NTPROBNP MARKET FOR MYOCARDIAL INFARCTION, BY COUNTRY 2021-2031(%)
FIGURE 12. COMPARATIVE SHARE ANALYSIS OF BNP AND NTPROBNP MARKET FOR CONGESTIVE HEART FAILURE, BY COUNTRY 2021-2031(%)
FIGURE 13. COMPARATIVE SHARE ANALYSIS OF BNP AND NTPROBNP MARKET FOR ACUTE CORONARY SYNDROME (ACS), BY COUNTRY 2021-2031(%)
FIGURE 14. COMPARATIVE SHARE ANALYSIS OF BNP AND NTPROBNP MARKET FOR OTHERS, BY COUNTRY 2021-2031(%)
FIGURE 15. BNP AND NTPROBNP MARKET, BY LOCATION OF TESTING, 2021(%)
FIGURE 16. COMPARATIVE SHARE ANALYSIS OF BNP AND NTPROBNP MARKET FOR POINT OF CARE TESTING, BY COUNTRY 2021-2031(%)
FIGURE 17. COMPARATIVE SHARE ANALYSIS OF BNP AND NTPROBNP MARKET FOR LABORATORY TESTING, BY COUNTRY 2021-2031(%)
FIGURE 18. BNP AND NTPROBNP MARKET BY REGION, 2021
FIGURE 19. U.S. BNP AND NTPROBNP MARKET, 2021-2031 ($MILLION)
FIGURE 20. CANADA BNP AND NTPROBNP MARKET, 2021-2031 ($MILLION)
FIGURE 21. MEXICO BNP AND NTPROBNP MARKET, 2021-2031 ($MILLION)
FIGURE 22. UK BNP AND NTPROBNP MARKET, 2021-2031 ($MILLION)
FIGURE 23. FRANCE BNP AND NTPROBNP MARKET, 2021-2031 ($MILLION)
FIGURE 24. GERMANY BNP AND NTPROBNP MARKET, 2021-2031 ($MILLION)
FIGURE 25. ITALY BNP AND NTPROBNP MARKET, 2021-2031 ($MILLION)
FIGURE 26. SPAIN BNP AND NTPROBNP MARKET, 2021-2031 ($MILLION)
FIGURE 27. REST OF EUROPE BNP AND NTPROBNP MARKET, 2021-2031 ($MILLION)
FIGURE 28. CHINA BNP AND NTPROBNP MARKET, 2021-2031 ($MILLION)
FIGURE 29. INDIA BNP AND NTPROBNP MARKET, 2021-2031 ($MILLION)
FIGURE 30. AUSTRALIA BNP AND NTPROBNP MARKET, 2021-2031 ($MILLION)
FIGURE 31. JAPAN BNP AND NTPROBNP MARKET, 2021-2031 ($MILLION)
FIGURE 32. REST OF ASIA-PACIFIC BNP AND NTPROBNP MARKET, 2021-2031 ($MILLION)
FIGURE 33. BRAZIL BNP AND NTPROBNP MARKET, 2021-2031 ($MILLION)
FIGURE 34. SAUDI ARABIA BNP AND NTPROBNP MARKET, 2021-2031 ($MILLION)
FIGURE 35. SOUTH AFRICA BNP AND NTPROBNP MARKET, 2021-2031 ($MILLION)
FIGURE 36. REST OF LAMEA BNP AND NTPROBNP MARKET, 2021-2031 ($MILLION)
FIGURE 37. TOP WINNING STRATEGIES, BY YEAR
FIGURE 38. TOP WINNING STRATEGIES, BY DEVELOPMENT
FIGURE 39. TOP WINNING STRATEGIES, BY COMPANY
FIGURE 40. PRODUCT MAPPING OF TOP 10 PLAYERS
FIGURE 41. COMPETITIVE DASHBOARD
FIGURE 42. COMPETITIVE HEATMAP: BNP AND NTPROBNP MARKET
FIGURE 43. TOP PLAYER POSITIONING, 2021
FIGURE 44. QUIDEL CORPORATION: NET REVENUE, 2019-2021 ($MILLION)
FIGURE 45. QUIDEL CORPORATION: REVENUE SHARE BY SEGMENT, 2021 (%)
FIGURE 46. QUIDEL CORPORATION: REVENUE SHARE BY REGION, 2021 (%)
FIGURE 47. GENTIAN DIAGNOSTICS ASA: NET REVENUE, 2019-2021 ($MILLION)
FIGURE 48. GENTIAN DIAGNOSTICS ASA: REVENUE SHARE BY REGION, 2021 (%)
FIGURE 49. SIEMENS AG: NET REVENUE, 2020-2022 ($MILLION)
FIGURE 50. SIEMENS AG: REVENUE SHARE BY SEGMENT, 2022 (%)
FIGURE 51. SIEMENS AG: REVENUE SHARE BY REGION, 2022 (%)
FIGURE 52. DANAHER CORPORATION: NET SALES, 2019-2021 ($MILLION)
FIGURE 53. DANAHER CORPORATION: REVENUE SHARE BY SEGMENT, 2021 (%)
FIGURE 54. DANAHER CORPORATION: REVENUE SHARE BY REGION, 2021 (%)
FIGURE 55. BIOMERIEUX SA: NET SALES, 2019-2021 ($MILLION)
FIGURE 56. BIOMERIEUX SA: REVENUE SHARE BY SEGMENT, 2021 (%)
FIGURE 57. BIOMERIEUX SA: REVENUE SHARE BY REGION, 2021 (%)
FIGURE 58. PERKINELMER INC.: NET REVENUE, 2019-2021 ($MILLION)
FIGURE 59. PERKINELMER INC.: REVENUE SHARE BY SEGMENT, 2021 (%)
FIGURE 60. PERKINELMER INC.: REVENUE SHARE BY REGION, 2019 (%)
FIGURE 61. F. HOFFMANN-LA ROCHE LTD.: NET REVENUE, 2020-2022 ($MILLION)
FIGURE 62. F. HOFFMANN-LA ROCHE LTD.: REVENUE SHARE BY SEGMENT, 2022 (%)
FIGURE 63. F. HOFFMANN-LA ROCHE LTD.: REVENUE SHARE BY REGION, 2022 (%)
FIGURE 64. BIO-RAD LABORATORIES, INC.: NET REVENUE, 2019-2021 ($MILLION)
FIGURE 65. BIO-RAD LABORATORIES, INC.: REVENUE SHARE BY SEGMENT, 2021 (%)
FIGURE 66. BIO-RAD LABORATORIES, INC.: REVENUE SHARE BY REGION, 2021 (%)
FIGURE 67. ABBOTT LABORATORIES: NET SALES, 2019-2021 ($MILLION)
FIGURE 68. ABBOTT LABORATORIES: REVENUE SHARE BY SEGMENT, 2021 (%)
FIGURE 69. ABBOTT LABORATORIES: REVENUE SHARE BY REGION, 2021 (%
SELECT A FORMAT
Added to Cart
Electronic

$5730

Single User License
Electronic

$6450

Multi User License
Electronic

$9600

Enterprise License
Electronic

$3840

Data Pack License
Add to Cart
Buy Now (15% Discount)

OUR CUSTOMER

Novocure

SIMILAR REPORTS