IoT in Agriculture Market
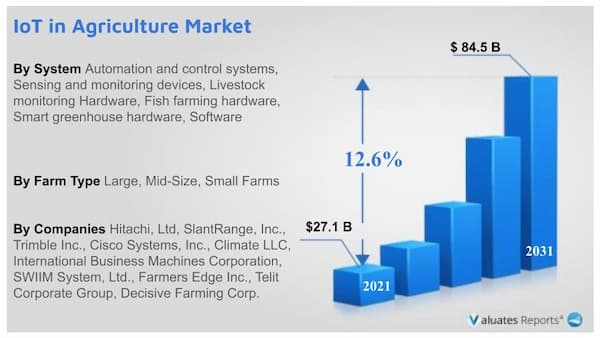
The global IOT in agriculture market Size was valued at $27.1 billion in 2021 and is projected to reach $84.5 billion by 2031, growing at a CAGR of 12.6% from 2022 to 2031.
The IoT in agricutlure market is a quickly expanding sector that entails connecting real-world items and gadgets to the internet so they can exchange and gather data. Then, by utilizing this data, it is possible to increase productivity, automate procedures, and develop new software and services.
Internet of things (IoT) technology in agriculture is anticipated to play a significant role in increasing the current agricultural productivity to cater to the growing demand for food. IoT in the agriculture industry incorporates IoT-based advanced technological tools, systems, equipment, and solutions to enhance operational efficiency, maximize yield, and minimize wastage of energy through real-time field data collection, data storage, data analysis, and the development of a control platform. Diverse IoT-based applications such as precision farming, livestock monitoring, smart greenhouse, and fish farm monitoring, are expected to be instrumental in increasing the speed of the agriculture processes. IoT technology can address agriculture-based issues and optimize the quantity and quality of agriculture production, by connecting farms through a single platform and making them more intelligent by sharing, storing, and analyzing the information.
IoT in Agriculture Market Trends
The IOT in agriculture market is being driven by a number of factors, including the expanding demand for real-time data analytics, the rising use of cloud-based services, and the rising demand for automation and control systems in a variety of sectors, including manufacturing, healthcare, and transportation. The demand for a variety of devices, including sensors, gateways, and networking devices, is increasing in the IoT industry. Also, by enabling faster and more dependable connectivity for IoT devices, the spread of 5G technology is anticipated to fuel the expansion of the IOT in agriculture market. As more devices are connected to the internet and new use cases and applications arise, the IoT industry is anticipated to grow and change quickly over the next several years.
To satisfy growing food demand, IoT technology is essential for boosting present agricultural output. Using real-time field data collecting, storage, analysis, and the creation of control platforms, IoT in agriculture integrates IoT-based complicated technical tools, systems, equipment, and solutions to improve operational efficiency, optimize output, and reduce energy waste. Among the IoT-based applications that speed up agricultural processes are precision farming, animal monitoring, smart greenhouses, and fish farm monitoring. Additionally, by linking farms through a single platform and enhancing their intelligence by sharing, storing, and analyzing data, IoT technology can manage issues related to agriculture and maximize both the quantity and quality of agricultural production.
Agriculture and climate change are interrelated, thus climate change on global scale significantly impacts the agricultural production. The climate change that effects agriculture includes change in average temperature, atmosphere, rainfall, and extreme weather such as heat wave, change in ozone concentration, and change in nutritional quality of food. For instance, the agriculture zone that is said to be affected by such climate issues is Brazil, is expected to witness a decline of 10% in maize production by 2055. Similarly, Eastern Australia and Midwestern U.S. are projected to experience decline in agriculture production owing to extreme heat. Whereas, in Central and Eastern Europe, forest productivity of the region is expected to decrease owing to scarcity of water. These severe climatic conditions play an important role in the deployment of IoT-based technology in agriculture to optimize the production and efficiency of the farm.
Factors such as the rise in global population and increase in demand for food across the globe have fueled the adoption of new technology to optimize agriculture production, and are expected to boost the IOT in agriculture market Growth. In addition, climate change plays a significant role in impacting global agriculture production. Thus, severe weather condition supports the deployment of IoT-based technology to optimize agriculture production. However, the agriculture industry comprises of numerous small players that provide solutions for various stages of the agriculture value chain. As a few of the agricultural processes achieve economic feasibility, the growth of the market is expected to be hampered during the IOT in agriculture Market Forecast period.
The agriculture industry consists of various small players that offer solution for various stages of agriculture value chain. Moreover, the industry does not have a major player that provides solution for the complete agriculture value chain. Thus, farmers find it difficult to achieve economic scalability by deployment of solution and services that are offered by smaller players. For instance, solution on reduction of cost for storage or transportation do not help farmers to achieve economic feasibility or maximize return on investment (ROI). Thus, fragmented agriculture market restrains the growth of the IoT in agriculture market.
Nevertheless, an increase in smartphone users and internet penetration among farmers boost their awareness about the latest developments in the agriculture market, which is anticipated to drive IOT in agriculture market growth.
A surge has been witnessed in the adoption smartphones and other mobile devices among the farmers, as these provide the farmers with latest development in the field of agriculture. Moreover, farmers depend on broadband and other wireless technologies to catch the latest news in their field of interest and participate in practical knowledge sharing initiatives in the agriculture industry. Owing to rising in internet penetration, agriculture resources are available in a wide range of local languages, which help farmers to create awareness on agriculture industry skills.
The web-based agriculture institutes, such as Agricultural Learning Repositories Task Force that introduces software and analytic tool skills to farmers have gained huge popularity among the farmers. Thus, adoption of smartphone and internet among farmers have created a new avenue for the development of IoT in agriculture.
The global IoT in the agriculture market is segmented based on system, application, and region. Based on the system, it is classified into automation and control systems, sensing and monitoring devices, livestock monitoring hardware, fish farming hardware, smart greenhouse hardware, and software. Based on application, it is divided into precision farming, livestock monitoring, smart greenhouse, and fish farm monitoring. Based on region, the market is analyzed across North America (U.S., Canada, and Mexico), Europe (Sweden, Finland, Germany, The Netherlands, and the rest of Europe), Asia-Pacific (China, Japan, India, Australia, South Korea, and rest of Asia-Pacific), and LAMEA (Brazil, KSA, South Africa, and rest of LAMEA).
IoT in Agriculture Market Share
Based on the system, the market is categorized into automation and control systems, sensing and monitoring devices, livestock monitoring hardware, fish farming hardware, smart greenhouse hardware, and software. In 2021, software was the leading segment in the global market, as it consists of numerous tools to control hardware such as yield monitors, soil sensors, water sensors, and climate sensors that are used in a wide range of precision farming, smart greenhouse farming, and fish farming applications.
The number of connected devices in IoT for agriculture application is expected to increase rapidly during the forecast period. These devices provide information to the software for human analyses, thus providing growth opportunity for the software market. Software development, innovation, and adoption will remain the prime area of focus. This drives the growth of the software market. The development of enhanced tools and reduction in cost of software further escalate the market growth.
The precision farming segment dominates IoT in the agriculture market in 2021. Precision farming enables IoT, information technology, and communication to revolutionize the global agriculture sector, by optimizing its production and efficiency. Livestock monitoring and integration of IoT system technology for the detection of livestock location and health are expected to grow significantly during the forecast period.
In 2021, the precision farming segment used IoT for field application as well as in farm equipment to collect data that can be analyzed and used to optimize production and save energy is projected to lead the IOT in agriculture market during the forecast period. The livestock monitoring segment, which includes global positioning systems (GPS), and sensors are anticipated to be the fastest-growing segment. IoT in livestock helps growers to monitor livestock health by detecting illness and taking preventive measures is anticipated to drive the market growth during the forecast period.
On the basis of farms, the large farm segment dominated the global market in the year 2021 and is likely to remain dominant during the forecast period.
By region, Asia-Pacific was the largest IOT in agriculture market Share in 2021 owing to the rise in population coupled with increased IOT in agriculture market Demand for food in the region. In addition, a government initiative to use remote sensing technology to collect ground data information and satellite image to detect agriculture conditions in various regions is expected to further boost the market growth.
The growth in population coupled with increase in food demand is expected to boost the IoT in agriculture market in the region. Government initiative to use remote sensing technology to collect ground data information and satellite image to detect agriculture condition in various region is expected to further escalate the IOT in Agriculture Industry growth.
The top IOT in agriculture market players include Cisco Systems, Inc., International Business Management Corporation (IBM), Telit, Hitachi, Ltd, Decisive Farming, Trimble Inc., OnFarm Systems Inc., Farmers Edge Inc., SlantRange, Inc., and The Climate Corporation.
Key Benefits For Stakeholders
This report provides a quantitative analysis of the market segments, current IOT in agriculture market Trends, estimations, and dynamics of the IOT in agriculture Market analysis from 2021 to 2031 to identify the prevailing iot in agriculture market opportunities.
The market research is offered along with information related to key drivers, restraints, and opportunities.
Porter's five forces analysis highlights the potency of buyers and suppliers to enable stakeholders make profit-oriented business decisions and strengthen their supplier-buyer network.
In-depth analysis of the IOT in agriculture market segmentation assists to determine the prevailing market opportunities.
Major countries in each region are mapped according to their revenue contribution to the global market.
Market player positioning facilitates benchmarking and provides a clear understanding of the present position of the IOT in Agriculture Industry players.
The report includes the analysis of the regional as well as global IoT in agriculture market trends, key players, market segments, application areas, and market growth strategies.
Scope of the IoT in Agriculture Market Report
| Report Metric |
Details |
| Report Name |
IoT in Agriculture Market |
| The market size in 2021 |
USD 27.1 Billion |
| The revenue forecast in 2031 |
USD 84.5 Billion |
| Growth Rate |
Compound Annual Growth Rate (CAGR) of 12.6% from 2023 to 2029 |
Segment by System
|
- Automation and control systems
- Sensing and monitoring devices
- Livestock monitoring Hardware
- Fish farming hardware
- Smart greenhouse hardware
- Software
|
By Farm Type
|
- Large
- Mid Size
- Small Farms
|
Segment by Application
|
- Precision farming
- Livestock monitoring
- Smart greenhouse
- Fish farm monitoring
|
Key Companies
|
Hitachi, Ltd, SlantRange, Inc., Trimble Inc., Cisco Systems, Inc., Climate LLC, International Business Machines Corporation, SWIIM System, Ltd., Farmers Edge Inc., Telit Corporate Group, Decisive Farming Corp. |
| Geographic regions covered |
North America, Europe, Asia Pacific, Latin America, Middle East & Africa |
Chapter 1 : INTRODUCTION
1.1. Report description
1.2. Key market segments
1.3. Key benefits to the stakeholders
1.4. Research Methodology
1.4.1. Primary research
1.4.2. Secondary research
1.4.3. Analyst tools and models
Chapter 2 : EXECUTIVE SUMMARY
2.1. CXO Perspective
Chapter 3 : MARKET OVERVIEW
3.1. Market definition and scope
3.2. Key findings
3.2.1. Top impacting factors
3.2.2. Top investment pockets
3.3. Porter’s five forces analysis
3.3.1. Bargaining power of suppliers
3.3.2. Bargaining power of buyers
3.3.3. Threat of substitutes
3.3.4. Threat of new entrants
3.3.5. Intensity of rivalry
3.4. Market dynamics
3.4.1. Drivers
3.4.1.1. Climate change
3.4.1.2. Emphasis on Increase in Efficiency
3.4.1.3. Adoption of Drones in Agriculture Applications
3.4.2. Restraints
3.4.2.1. Fragmented Agricultural Market
3.4.2.2. High Capital Investment Requirement
3.4.3. Opportunities
3.4.3.1. Introduction of Smartphone and Internet Penetration
3.4.3.2. Increase in Public–Private Partnership
3.5. COVID-19 Impact Analysis on the market
Chapter 4 : IOT IN AGRICULTURE MARKET, BY APPLICATION
4.1. Overview
4.1.1. Market size and forecast
4.2. Precision farming
4.2.1. Key market trends, growth factors and opportunities
4.2.2. Market size and forecast, by region
4.2.3. Market share analysis by country
4.3. Livestock monitoring
4.3.1. Key market trends, growth factors and opportunities
4.3.2. Market size and forecast, by region
4.3.3. Market share analysis by country
4.4. Smart greenhouse
4.4.1. Key market trends, growth factors and opportunities
4.4.2. Market size and forecast, by region
4.4.3. Market share analysis by country
4.5. Fish farm monitoring
4.5.1. Key market trends, growth factors and opportunities
4.5.2. Market size and forecast, by region
4.5.3. Market share analysis by country
Chapter 5 : IOT IN AGRICULTURE MARKET, BY SYSTEM
5.1. Overview
5.1.1. Market size and forecast
5.2. Automation and control systems
5.2.1. Key market trends, growth factors and opportunities
5.2.2. Market size and forecast, by region
5.2.3. Market share analysis by country
5.3. Sensing and monitoring devices
5.3.1. Key market trends, growth factors and opportunities
5.3.2. Market size and forecast, by region
5.3.3. Market share analysis by country
5.4. Livestock monitoring Hardware
5.4.1. Key market trends, growth factors and opportunities
5.4.2. Market size and forecast, by region
5.4.3. Market share analysis by country
5.5. Fish farming hardware
5.5.1. Key market trends, growth factors and opportunities
5.5.2. Market size and forecast, by region
5.5.3. Market share analysis by country
5.6. Smart greenhouse hardware
5.6.1. Key market trends, growth factors and opportunities
5.6.2. Market size and forecast, by region
5.6.3. Market share analysis by country
5.7. Software
5.7.1. Key market trends, growth factors and opportunities
5.7.2. Market size and forecast, by region
5.7.3. Market share analysis by country
Chapter 6 : IOT IN AGRICULTURE MARKET, BY FARM TYPE
6.1. Overview
6.1.1. Market size and forecast
6.2. Large
6.2.1. Key market trends, growth factors and opportunities
6.2.2. Market size and forecast, by region
6.2.3. Market share analysis by country
6.3. Mid Size
6.3.1. Key market trends, growth factors and opportunities
6.3.2. Market size and forecast, by region
6.3.3. Market share analysis by country
6.4. Small Farms
6.4.1. Key market trends, growth factors and opportunities
6.4.2. Market size and forecast, by region
6.4.3. Market share analysis by country
Chapter 7 : IOT IN AGRICULTURE MARKET, BY REGION
7.1. Overview
7.1.1. Market size and forecast By Region
7.2. North America
7.2.1. Key trends and opportunities
7.2.2. Market size and forecast, by Application
7.2.3. Market size and forecast, by System
7.2.4. Market size and forecast, by Farm Type
7.2.5. Market size and forecast, by country
7.2.5.1. U.S.
7.2.5.1.1. Key market trends, growth factors and opportunities
7.2.5.1.2. Market size and forecast, by Application
7.2.5.1.3. Market size and forecast, by System
7.2.5.1.4. Market size and forecast, by Farm Type
7.2.5.2. Canada
7.2.5.2.1. Key market trends, growth factors and opportunities
7.2.5.2.2. Market size and forecast, by Application
7.2.5.2.3. Market size and forecast, by System
7.2.5.2.4. Market size and forecast, by Farm Type
7.2.5.3. Mexico
7.2.5.3.1. Key market trends, growth factors and opportunities
7.2.5.3.2. Market size and forecast, by Application
7.2.5.3.3. Market size and forecast, by System
7.2.5.3.4. Market size and forecast, by Farm Type
7.3. Europe
7.3.1. Key trends and opportunities
7.3.2. Market size and forecast, by Application
7.3.3. Market size and forecast, by System
7.3.4. Market size and forecast, by Farm Type
7.3.5. Market size and forecast, by country
7.3.5.1. UK
7.3.5.1.1. Key market trends, growth factors and opportunities
7.3.5.1.2. Market size and forecast, by Application
7.3.5.1.3. Market size and forecast, by System
7.3.5.1.4. Market size and forecast, by Farm Type
7.3.5.2. Germany
7.3.5.2.1. Key market trends, growth factors and opportunities
7.3.5.2.2. Market size and forecast, by Application
7.3.5.2.3. Market size and forecast, by System
7.3.5.2.4. Market size and forecast, by Farm Type
7.3.5.3. France
7.3.5.3.1. Key market trends, growth factors and opportunities
7.3.5.3.2. Market size and forecast, by Application
7.3.5.3.3. Market size and forecast, by System
7.3.5.3.4. Market size and forecast, by Farm Type
7.3.5.4. Italy
7.3.5.4.1. Key market trends, growth factors and opportunities
7.3.5.4.2. Market size and forecast, by Application
7.3.5.4.3. Market size and forecast, by System
7.3.5.4.4. Market size and forecast, by Farm Type
7.3.5.5. Spain
7.3.5.5.1. Key market trends, growth factors and opportunities
7.3.5.5.2. Market size and forecast, by Application
7.3.5.5.3. Market size and forecast, by System
7.3.5.5.4. Market size and forecast, by Farm Type
7.3.5.6. Russia
7.3.5.6.1. Key market trends, growth factors and opportunities
7.3.5.6.2. Market size and forecast, by Application
7.3.5.6.3. Market size and forecast, by System
7.3.5.6.4. Market size and forecast, by Farm Type
7.3.5.7. Austria
7.3.5.7.1. Key market trends, growth factors and opportunities
7.3.5.7.2. Market size and forecast, by Application
7.3.5.7.3. Market size and forecast, by System
7.3.5.7.4. Market size and forecast, by Farm Type
7.3.5.8. Netherlands
7.3.5.8.1. Key market trends, growth factors and opportunities
7.3.5.8.2. Market size and forecast, by Application
7.3.5.8.3. Market size and forecast, by System
7.3.5.8.4. Market size and forecast, by Farm Type
7.3.5.9. Denmark
7.3.5.9.1. Key market trends, growth factors and opportunities
7.3.5.9.2. Market size and forecast, by Application
7.3.5.9.3. Market size and forecast, by System
7.3.5.9.4. Market size and forecast, by Farm Type
7.3.5.10. Rest of Europe
7.3.5.10.1. Key market trends, growth factors and opportunities
7.3.5.10.2. Market size and forecast, by Application
7.3.5.10.3. Market size and forecast, by System
7.3.5.10.4. Market size and forecast, by Farm Type
7.4. Asia-Pacific
7.4.1. Key trends and opportunities
7.4.2. Market size and forecast, by Application
7.4.3. Market size and forecast, by System
7.4.4. Market size and forecast, by Farm Type
7.4.5. Market size and forecast, by country
7.4.5.1. China
7.4.5.1.1. Key market trends, growth factors and opportunities
7.4.5.1.2. Market size and forecast, by Application
7.4.5.1.3. Market size and forecast, by System
7.4.5.1.4. Market size and forecast, by Farm Type
7.4.5.2. India
7.4.5.2.1. Key market trends, growth factors and opportunities
7.4.5.2.2. Market size and forecast, by Application
7.4.5.2.3. Market size and forecast, by System
7.4.5.2.4. Market size and forecast, by Farm Type
7.4.5.3. Japan
7.4.5.3.1. Key market trends, growth factors and opportunities
7.4.5.3.2. Market size and forecast, by Application
7.4.5.3.3. Market size and forecast, by System
7.4.5.3.4. Market size and forecast, by Farm Type
7.4.5.4. Australia
7.4.5.4.1. Key market trends, growth factors and opportunities
7.4.5.4.2. Market size and forecast, by Application
7.4.5.4.3. Market size and forecast, by System
7.4.5.4.4. Market size and forecast, by Farm Type
7.4.5.5. South Korea
7.4.5.5.1. Key market trends, growth factors and opportunities
7.4.5.5.2. Market size and forecast, by Application
7.4.5.5.3. Market size and forecast, by System
7.4.5.5.4. Market size and forecast, by Farm Type
7.4.5.6. Thailand
7.4.5.6.1. Key market trends, growth factors and opportunities
7.4.5.6.2. Market size and forecast, by Application
7.4.5.6.3. Market size and forecast, by System
7.4.5.6.4. Market size and forecast, by Farm Type
7.4.5.7. Malaysia
7.4.5.7.1. Key market trends, growth factors and opportunities
7.4.5.7.2. Market size and forecast, by Application
7.4.5.7.3. Market size and forecast, by System
7.4.5.7.4. Market size and forecast, by Farm Type
7.4.5.8. Singapore
7.4.5.8.1. Key market trends, growth factors and opportunities
7.4.5.8.2. Market size and forecast, by Application
7.4.5.8.3. Market size and forecast, by System
7.4.5.8.4. Market size and forecast, by Farm Type
7.4.5.9. Indonesia
7.4.5.9.1. Key market trends, growth factors and opportunities
7.4.5.9.2. Market size and forecast, by Application
7.4.5.9.3. Market size and forecast, by System
7.4.5.9.4. Market size and forecast, by Farm Type
7.4.5.10. New Zealand
7.4.5.10.1. Key market trends, growth factors and opportunities
7.4.5.10.2. Market size and forecast, by Application
7.4.5.10.3. Market size and forecast, by System
7.4.5.10.4. Market size and forecast, by Farm Type
7.4.5.11. Rest of Asia-Pacific
7.4.5.11.1. Key market trends, growth factors and opportunities
7.4.5.11.2. Market size and forecast, by Application
7.4.5.11.3. Market size and forecast, by System
7.4.5.11.4. Market size and forecast, by Farm Type
7.5. LAMEA
7.5.1. Key trends and opportunities
7.5.2. Market size and forecast, by Application
7.5.3. Market size and forecast, by System
7.5.4. Market size and forecast, by Farm Type
7.5.5. Market size and forecast, by country
7.5.5.1. Brazil
7.5.5.1.1. Key market trends, growth factors and opportunities
7.5.5.1.2. Market size and forecast, by Application
7.5.5.1.3. Market size and forecast, by System
7.5.5.1.4. Market size and forecast, by Farm Type
7.5.5.2. Argentina
7.5.5.2.1. Key market trends, growth factors and opportunities
7.5.5.2.2. Market size and forecast, by Application
7.5.5.2.3. Market size and forecast, by System
7.5.5.2.4. Market size and forecast, by Farm Type
7.5.5.3. South Africa
7.5.5.3.1. Key market trends, growth factors and opportunities
7.5.5.3.2. Market size and forecast, by Application
7.5.5.3.3. Market size and forecast, by System
7.5.5.3.4. Market size and forecast, by Farm Type
7.5.5.4. Middle East
7.5.5.4.1. Key market trends, growth factors and opportunities
7.5.5.4.2. Market size and forecast, by Application
7.5.5.4.3. Market size and forecast, by System
7.5.5.4.4. Market size and forecast, by Farm Type
7.5.5.5. Saudi Arabia
7.5.5.5.1. Key market trends, growth factors and opportunities
7.5.5.5.2. Market size and forecast, by Application
7.5.5.5.3. Market size and forecast, by System
7.5.5.5.4. Market size and forecast, by Farm Type
7.5.5.6. Egypt
7.5.5.6.1. Key market trends, growth factors and opportunities
7.5.5.6.2. Market size and forecast, by Application
7.5.5.6.3. Market size and forecast, by System
7.5.5.6.4. Market size and forecast, by Farm Type
7.5.5.7. Nigeria
7.5.5.7.1. Key market trends, growth factors and opportunities
7.5.5.7.2. Market size and forecast, by Application
7.5.5.7.3. Market size and forecast, by System
7.5.5.7.4. Market size and forecast, by Farm Type
7.5.5.8. Rest of LAMEA
7.5.5.8.1. Key market trends, growth factors and opportunities
7.5.5.8.2. Market size and forecast, by Application
7.5.5.8.3. Market size and forecast, by System
7.5.5.8.4. Market size and forecast, by Farm Type
Chapter 8 : COMPETITIVE LANDSCAPE
8.1. Introduction
8.2. Top winning strategies
8.3. Product Mapping of Top 10 Player
8.4. Competitive Dashboard
8.5. Competitive Heatmap
8.6. Top player positioning, 2021
Chapter 9 : COMPANY PROFILES
9.1. Cisco Systems, Inc.
9.1.1. Company overview
9.1.2. Key Executives
9.1.3. Company snapshot
9.1.4. Operating business segments
9.1.5. Product portfolio
9.1.6. Business performance
9.2. Decisive Farming Corp.
9.2.1. Company overview
9.2.2. Key Executives
9.2.3. Company snapshot
9.2.4. Operating business segments
9.2.5. Product portfolio
9.3. Farmers Edge Inc.
9.3.1. Company overview
9.3.2. Key Executives
9.3.3. Company snapshot
9.3.4. Operating business segments
9.3.5. Product portfolio
9.3.6. Business performance
9.3.7. Key strategic moves and developments
9.4. International Business Machines Corporation
9.4.1. Company overview
9.4.2. Key Executives
9.4.3. Company snapshot
9.4.4. Operating business segments
9.4.5. Product portfolio
9.5. SWIIM System, Ltd.
9.5.1. Company overview
9.5.2. Key Executives
9.5.3. Company snapshot
9.5.4. Operating business segments
9.5.5. Product portfolio
9.5.6. Key strategic moves and developments
9.6. SlantRange, Inc.
9.6.1. Company overview
9.6.2. Key Executives
9.6.3. Company snapshot
9.6.4. Operating business segments
9.6.5. Product portfolio
9.7. Telit Corporate Group
9.7.1. Company overview
9.7.2. Key Executives
9.7.3. Company snapshot
9.7.4. Operating business segments
9.7.5. Product portfolio
9.7.6. Key strategic moves and developments
9.8. Climate LLC
9.8.1. Company overview
9.8.2. Key Executives
9.8.3. Company snapshot
9.8.4. Operating business segments
9.8.5. Product portfolio
9.9. Trimble Inc.
9.9.1. Company overview
9.9.2. Key Executives
9.9.3. Company snapshot
9.9.4. Operating business segments
9.9.5. Product portfolio
9.9.6. Business performance
9.9.7. Key strategic moves and developments
9.10. Hitachi, Ltd
9.10.1. Company overview
9.10.2. Key Executives
9.10.3. Company snapshot
9.10.4. Operating business segments
9.10.5. Product portfolio
9.10.6. Business performance
LIST OF TABLES
TABLE 01. GLOBAL IOT IN AGRICULTURE MARKET, BY APPLICATION, 2021-2031 ($MILLION)
TABLE 02. IOT IN AGRICULTURE MARKET FOR PRECISION FARMING, BY REGION, 2021-2031 ($MILLION)
TABLE 03. IOT IN AGRICULTURE MARKET FOR LIVESTOCK MONITORING, BY REGION, 2021-2031 ($MILLION)
TABLE 04. IOT IN AGRICULTURE MARKET FOR SMART GREENHOUSE, BY REGION, 2021-2031 ($MILLION)
TABLE 05. IOT IN AGRICULTURE MARKET FOR FISH FARM MONITORING, BY REGION, 2021-2031 ($MILLION)
TABLE 06. GLOBAL IOT IN AGRICULTURE MARKET, BY SYSTEM, 2021-2031 ($MILLION)
TABLE 07. IOT IN AGRICULTURE MARKET FOR AUTOMATION AND CONTROL SYSTEMS, BY REGION, 2021-2031 ($MILLION)
TABLE 08. IOT IN AGRICULTURE MARKET FOR SENSING AND MONITORING DEVICES, BY REGION, 2021-2031 ($MILLION)
TABLE 09. IOT IN AGRICULTURE MARKET FOR LIVESTOCK MONITORING HARDWARE, BY REGION, 2021-2031 ($MILLION)
TABLE 10. IOT IN AGRICULTURE MARKET FOR FISH FARMING HARDWARE, BY REGION, 2021-2031 ($MILLION)
TABLE 11. IOT IN AGRICULTURE MARKET FOR SMART GREENHOUSE HARDWARE, BY REGION, 2021-2031 ($MILLION)
TABLE 12. IOT IN AGRICULTURE MARKET FOR SOFTWARE, BY REGION, 2021-2031 ($MILLION)
TABLE 13. GLOBAL IOT IN AGRICULTURE MARKET, BY FARM TYPE, 2021-2031 ($MILLION)
TABLE 14. IOT IN AGRICULTURE MARKET FOR LARGE, BY REGION, 2021-2031 ($MILLION)
TABLE 15. IOT IN AGRICULTURE MARKET FOR MID SIZE, BY REGION, 2021-2031 ($MILLION)
TABLE 16. IOT IN AGRICULTURE MARKET FOR SMALL FARMS, BY REGION, 2021-2031 ($MILLION)
TABLE 17. IOT IN AGRICULTURE MARKET, BY REGION, 2021-2031 ($MILLION)
TABLE 18. NORTH AMERICA IOT IN AGRICULTURE MARKET, BY APPLICATION, 2021-2031 ($MILLION)
TABLE 19. NORTH AMERICA IOT IN AGRICULTURE MARKET, BY SYSTEM, 2021-2031 ($MILLION)
TABLE 20. NORTH AMERICA IOT IN AGRICULTURE MARKET, BY FARM TYPE, 2021-2031 ($MILLION)
TABLE 21. NORTH AMERICA IOT IN AGRICULTURE MARKET, BY COUNTRY, 2021-2031 ($MILLION)
TABLE 22. U.S. IOT IN AGRICULTURE MARKET, BY APPLICATION, 2021-2031 ($MILLION)
TABLE 23. U.S. IOT IN AGRICULTURE MARKET, BY SYSTEM, 2021-2031 ($MILLION)
TABLE 24. U.S. IOT IN AGRICULTURE MARKET, BY FARM TYPE, 2021-2031 ($MILLION)
TABLE 25. CANADA IOT IN AGRICULTURE MARKET, BY APPLICATION, 2021-2031 ($MILLION)
TABLE 26. CANADA IOT IN AGRICULTURE MARKET, BY SYSTEM, 2021-2031 ($MILLION)
TABLE 27. CANADA IOT IN AGRICULTURE MARKET, BY FARM TYPE, 2021-2031 ($MILLION)
TABLE 28. MEXICO IOT IN AGRICULTURE MARKET, BY APPLICATION, 2021-2031 ($MILLION)
TABLE 29. MEXICO IOT IN AGRICULTURE MARKET, BY SYSTEM, 2021-2031 ($MILLION)
TABLE 30. MEXICO IOT IN AGRICULTURE MARKET, BY FARM TYPE, 2021-2031 ($MILLION)
TABLE 31. EUROPE IOT IN AGRICULTURE MARKET, BY APPLICATION, 2021-2031 ($MILLION)
TABLE 32. EUROPE IOT IN AGRICULTURE MARKET, BY SYSTEM, 2021-2031 ($MILLION)
TABLE 33. EUROPE IOT IN AGRICULTURE MARKET, BY FARM TYPE, 2021-2031 ($MILLION)
TABLE 34. EUROPE IOT IN AGRICULTURE MARKET, BY COUNTRY, 2021-2031 ($MILLION)
TABLE 35. UK IOT IN AGRICULTURE MARKET, BY APPLICATION, 2021-2031 ($MILLION)
TABLE 36. UK IOT IN AGRICULTURE MARKET, BY SYSTEM, 2021-2031 ($MILLION)
TABLE 37. UK IOT IN AGRICULTURE MARKET, BY FARM TYPE, 2021-2031 ($MILLION)
TABLE 38. GERMANY IOT IN AGRICULTURE MARKET, BY APPLICATION, 2021-2031 ($MILLION)
TABLE 39. GERMANY IOT IN AGRICULTURE MARKET, BY SYSTEM, 2021-2031 ($MILLION)
TABLE 40. GERMANY IOT IN AGRICULTURE MARKET, BY FARM TYPE, 2021-2031 ($MILLION)
TABLE 41. FRANCE IOT IN AGRICULTURE MARKET, BY APPLICATION, 2021-2031 ($MILLION)
TABLE 42. FRANCE IOT IN AGRICULTURE MARKET, BY SYSTEM, 2021-2031 ($MILLION)
TABLE 43. FRANCE IOT IN AGRICULTURE MARKET, BY FARM TYPE, 2021-2031 ($MILLION)
TABLE 44. ITALY IOT IN AGRICULTURE MARKET, BY APPLICATION, 2021-2031 ($MILLION)
TABLE 45. ITALY IOT IN AGRICULTURE MARKET, BY SYSTEM, 2021-2031 ($MILLION)
TABLE 46. ITALY IOT IN AGRICULTURE MARKET, BY FARM TYPE, 2021-2031 ($MILLION)
TABLE 47. SPAIN IOT IN AGRICULTURE MARKET, BY APPLICATION, 2021-2031 ($MILLION)
TABLE 48. SPAIN IOT IN AGRICULTURE MARKET, BY SYSTEM, 2021-2031 ($MILLION)
TABLE 49. SPAIN IOT IN AGRICULTURE MARKET, BY FARM TYPE, 2021-2031 ($MILLION)
TABLE 50. RUSSIA IOT IN AGRICULTURE MARKET, BY APPLICATION, 2021-2031 ($MILLION)
TABLE 51. RUSSIA IOT IN AGRICULTURE MARKET, BY SYSTEM, 2021-2031 ($MILLION)
TABLE 52. RUSSIA IOT IN AGRICULTURE MARKET, BY FARM TYPE, 2021-2031 ($MILLION)
TABLE 53. AUSTRIA IOT IN AGRICULTURE MARKET, BY APPLICATION, 2021-2031 ($MILLION)
TABLE 54. AUSTRIA IOT IN AGRICULTURE MARKET, BY SYSTEM, 2021-2031 ($MILLION)
TABLE 55. AUSTRIA IOT IN AGRICULTURE MARKET, BY FARM TYPE, 2021-2031 ($MILLION)
TABLE 56. NETHERLANDS IOT IN AGRICULTURE MARKET, BY APPLICATION, 2021-2031 ($MILLION)
TABLE 57. NETHERLANDS IOT IN AGRICULTURE MARKET, BY SYSTEM, 2021-2031 ($MILLION)
TABLE 58. NETHERLANDS IOT IN AGRICULTURE MARKET, BY FARM TYPE, 2021-2031 ($MILLION)
TABLE 59. DENMARK IOT IN AGRICULTURE MARKET, BY APPLICATION, 2021-2031 ($MILLION)
TABLE 60. DENMARK IOT IN AGRICULTURE MARKET, BY SYSTEM, 2021-2031 ($MILLION)
TABLE 61. DENMARK IOT IN AGRICULTURE MARKET, BY FARM TYPE, 2021-2031 ($MILLION)
TABLE 62. REST OF EUROPE IOT IN AGRICULTURE MARKET, BY APPLICATION, 2021-2031 ($MILLION)
TABLE 63. REST OF EUROPE IOT IN AGRICULTURE MARKET, BY SYSTEM, 2021-2031 ($MILLION)
TABLE 64. REST OF EUROPE IOT IN AGRICULTURE MARKET, BY FARM TYPE, 2021-2031 ($MILLION)
TABLE 65. ASIA-PACIFIC IOT IN AGRICULTURE MARKET, BY APPLICATION, 2021-2031 ($MILLION)
TABLE 66. ASIA-PACIFIC IOT IN AGRICULTURE MARKET, BY SYSTEM, 2021-2031 ($MILLION)
TABLE 67. ASIA-PACIFIC IOT IN AGRICULTURE MARKET, BY FARM TYPE, 2021-2031 ($MILLION)
TABLE 68. ASIA-PACIFIC IOT IN AGRICULTURE MARKET, BY COUNTRY, 2021-2031 ($MILLION)
TABLE 69. CHINA IOT IN AGRICULTURE MARKET, BY APPLICATION, 2021-2031 ($MILLION)
TABLE 70. CHINA IOT IN AGRICULTURE MARKET, BY SYSTEM, 2021-2031 ($MILLION)
TABLE 71. CHINA IOT IN AGRICULTURE MARKET, BY FARM TYPE, 2021-2031 ($MILLION)
TABLE 72. INDIA IOT IN AGRICULTURE MARKET, BY APPLICATION, 2021-2031 ($MILLION)
TABLE 73. INDIA IOT IN AGRICULTURE MARKET, BY SYSTEM, 2021-2031 ($MILLION)
TABLE 74. INDIA IOT IN AGRICULTURE MARKET, BY FARM TYPE, 2021-2031 ($MILLION)
TABLE 75. JAPAN IOT IN AGRICULTURE MARKET, BY APPLICATION, 2021-2031 ($MILLION)
TABLE 76. JAPAN IOT IN AGRICULTURE MARKET, BY SYSTEM, 2021-2031 ($MILLION)
TABLE 77. JAPAN IOT IN AGRICULTURE MARKET, BY FARM TYPE, 2021-2031 ($MILLION)
TABLE 78. AUSTRALIA IOT IN AGRICULTURE MARKET, BY APPLICATION, 2021-2031 ($MILLION)
TABLE 79. AUSTRALIA IOT IN AGRICULTURE MARKET, BY SYSTEM, 2021-2031 ($MILLION)
TABLE 80. AUSTRALIA IOT IN AGRICULTURE MARKET, BY FARM TYPE, 2021-2031 ($MILLION)
TABLE 81. SOUTH KOREA IOT IN AGRICULTURE MARKET, BY APPLICATION, 2021-2031 ($MILLION)
TABLE 82. SOUTH KOREA IOT IN AGRICULTURE MARKET, BY SYSTEM, 2021-2031 ($MILLION)
TABLE 83. SOUTH KOREA IOT IN AGRICULTURE MARKET, BY FARM TYPE, 2021-2031 ($MILLION)
TABLE 84. THAILAND IOT IN AGRICULTURE MARKET, BY APPLICATION, 2021-2031 ($MILLION)
TABLE 85. THAILAND IOT IN AGRICULTURE MARKET, BY SYSTEM, 2021-2031 ($MILLION)
TABLE 86. THAILAND IOT IN AGRICULTURE MARKET, BY FARM TYPE, 2021-2031 ($MILLION)
TABLE 87. MALAYSIA IOT IN AGRICULTURE MARKET, BY APPLICATION, 2021-2031 ($MILLION)
TABLE 88. MALAYSIA IOT IN AGRICULTURE MARKET, BY SYSTEM, 2021-2031 ($MILLION)
TABLE 89. MALAYSIA IOT IN AGRICULTURE MARKET, BY FARM TYPE, 2021-2031 ($MILLION)
TABLE 90. SINGAPORE IOT IN AGRICULTURE MARKET, BY APPLICATION, 2021-2031 ($MILLION)
TABLE 91. SINGAPORE IOT IN AGRICULTURE MARKET, BY SYSTEM, 2021-2031 ($MILLION)
TABLE 92. SINGAPORE IOT IN AGRICULTURE MARKET, BY FARM TYPE, 2021-2031 ($MILLION)
TABLE 93. INDONESIA IOT IN AGRICULTURE MARKET, BY APPLICATION, 2021-2031 ($MILLION)
TABLE 94. INDONESIA IOT IN AGRICULTURE MARKET, BY SYSTEM, 2021-2031 ($MILLION)
TABLE 95. INDONESIA IOT IN AGRICULTURE MARKET, BY FARM TYPE, 2021-2031 ($MILLION)
TABLE 96. NEW ZEALAND IOT IN AGRICULTURE MARKET, BY APPLICATION, 2021-2031 ($MILLION)
TABLE 97. NEW ZEALAND IOT IN AGRICULTURE MARKET, BY SYSTEM, 2021-2031 ($MILLION)
TABLE 98. NEW ZEALAND IOT IN AGRICULTURE MARKET, BY FARM TYPE, 2021-2031 ($MILLION)
TABLE 99. REST OF ASIA-PACIFIC IOT IN AGRICULTURE MARKET, BY APPLICATION, 2021-2031 ($MILLION)
TABLE 100. REST OF ASIA-PACIFIC IOT IN AGRICULTURE MARKET, BY SYSTEM, 2021-2031 ($MILLION)
TABLE 101. REST OF ASIA-PACIFIC IOT IN AGRICULTURE MARKET, BY FARM TYPE, 2021-2031 ($MILLION)
TABLE 102. LAMEA IOT IN AGRICULTURE MARKET, BY APPLICATION, 2021-2031 ($MILLION)
TABLE 103. LAMEA IOT IN AGRICULTURE MARKET, BY SYSTEM, 2021-2031 ($MILLION)
TABLE 104. LAMEA IOT IN AGRICULTURE MARKET, BY FARM TYPE, 2021-2031 ($MILLION)
TABLE 105. LAMEA IOT IN AGRICULTURE MARKET, BY COUNTRY, 2021-2031 ($MILLION)
TABLE 106. BRAZIL IOT IN AGRICULTURE MARKET, BY APPLICATION, 2021-2031 ($MILLION)
TABLE 107. BRAZIL IOT IN AGRICULTURE MARKET, BY SYSTEM, 2021-2031 ($MILLION)
TABLE 108. BRAZIL IOT IN AGRICULTURE MARKET, BY FARM TYPE, 2021-2031 ($MILLION)
TABLE 109. ARGENTINA IOT IN AGRICULTURE MARKET, BY APPLICATION, 2021-2031 ($MILLION)
TABLE 110. ARGENTINA IOT IN AGRICULTURE MARKET, BY SYSTEM, 2021-2031 ($MILLION)
TABLE 111. ARGENTINA IOT IN AGRICULTURE MARKET, BY FARM TYPE, 2021-2031 ($MILLION)
TABLE 112. SOUTH AFRICA IOT IN AGRICULTURE MARKET, BY APPLICATION, 2021-2031 ($MILLION)
TABLE 113. SOUTH AFRICA IOT IN AGRICULTURE MARKET, BY SYSTEM, 2021-2031 ($MILLION)
TABLE 114. SOUTH AFRICA IOT IN AGRICULTURE MARKET, BY FARM TYPE, 2021-2031 ($MILLION)
TABLE 115. MIDDLE EAST IOT IN AGRICULTURE MARKET, BY APPLICATION, 2021-2031 ($MILLION)
TABLE 116. MIDDLE EAST IOT IN AGRICULTURE MARKET, BY SYSTEM, 2021-2031 ($MILLION)
TABLE 117. MIDDLE EAST IOT IN AGRICULTURE MARKET, BY FARM TYPE, 2021-2031 ($MILLION)
TABLE 118. SAUDI ARABIA IOT IN AGRICULTURE MARKET, BY APPLICATION, 2021-2031 ($MILLION)
TABLE 119. SAUDI ARABIA IOT IN AGRICULTURE MARKET, BY SYSTEM, 2021-2031 ($MILLION)
TABLE 120. SAUDI ARABIA IOT IN AGRICULTURE MARKET, BY FARM TYPE, 2021-2031 ($MILLION)
TABLE 121. EGYPT IOT IN AGRICULTURE MARKET, BY APPLICATION, 2021-2031 ($MILLION)
TABLE 122. EGYPT IOT IN AGRICULTURE MARKET, BY SYSTEM, 2021-2031 ($MILLION)
TABLE 123. EGYPT IOT IN AGRICULTURE MARKET, BY FARM TYPE, 2021-2031 ($MILLION)
TABLE 124. NIGERIA IOT IN AGRICULTURE MARKET, BY APPLICATION, 2021-2031 ($MILLION)
TABLE 125. NIGERIA IOT IN AGRICULTURE MARKET, BY SYSTEM, 2021-2031 ($MILLION)
TABLE 126. NIGERIA IOT IN AGRICULTURE MARKET, BY FARM TYPE, 2021-2031 ($MILLION)
TABLE 127. REST OF LAMEA IOT IN AGRICULTURE MARKET, BY APPLICATION, 2021-2031 ($MILLION)
TABLE 128. REST OF LAMEA IOT IN AGRICULTURE MARKET, BY SYSTEM, 2021-2031 ($MILLION)
TABLE 129. REST OF LAMEA IOT IN AGRICULTURE MARKET, BY FARM TYPE, 2021-2031 ($MILLION)
TABLE 130. CISCO SYSTEMS, INC.: KEY EXECUTIVES
TABLE 131. CISCO SYSTEMS, INC.: COMPANY SNAPSHOT
TABLE 132. CISCO SYSTEMS, INC.: PRODUCT SEGMENTS
TABLE 133. CISCO SYSTEMS, INC.: PRODUCT PORTFOLIO
TABLE 134. DECISIVE FARMING CORP.: KEY EXECUTIVES
TABLE 135. DECISIVE FARMING CORP.: COMPANY SNAPSHOT
TABLE 136. DECISIVE FARMING CORP.: PRODUCT SEGMENTS
TABLE 137. DECISIVE FARMING CORP.: PRODUCT PORTFOLIO
TABLE 138. FARMERS EDGE INC.: KEY EXECUTIVES
TABLE 139. FARMERS EDGE INC.: COMPANY SNAPSHOT
TABLE 140. FARMERS EDGE INC.: PRODUCT SEGMENTS
TABLE 141. FARMERS EDGE INC.: PRODUCT PORTFOLIO
TABLE 142. FARMERS EDGE INC.: KEY STRATEGIES
TABLE 143. INTERNATIONAL BUSINESS MACHINES CORPORATION: KEY EXECUTIVES
TABLE 144. INTERNATIONAL BUSINESS MACHINES CORPORATION: COMPANY SNAPSHOT
TABLE 145. INTERNATIONAL BUSINESS MACHINES CORPORATION: PRODUCT SEGMENTS
TABLE 146. INTERNATIONAL BUSINESS MACHINES CORPORATION: PRODUCT PORTFOLIO
TABLE 147. SWIIM SYSTEM, LTD.: KEY EXECUTIVES
TABLE 148. SWIIM SYSTEM, LTD.: COMPANY SNAPSHOT
TABLE 149. SWIIM SYSTEM, LTD.: PRODUCT SEGMENTS
TABLE 150. SWIIM SYSTEM, LTD.: PRODUCT PORTFOLIO
TABLE 151. SWIIM SYSTEM, LTD.: KEY STRATEGIES
TABLE 152. SLANTRANGE, INC.: KEY EXECUTIVES
TABLE 153. SLANTRANGE, INC.: COMPANY SNAPSHOT
TABLE 154. SLANTRANGE, INC.: PRODUCT SEGMENTS
TABLE 155. SLANTRANGE, INC.: PRODUCT PORTFOLIO
TABLE 156. TELIT CORPORATE GROUP: KEY EXECUTIVES
TABLE 157. TELIT CORPORATE GROUP: COMPANY SNAPSHOT
TABLE 158. TELIT CORPORATE GROUP: PRODUCT SEGMENTS
TABLE 159. TELIT CORPORATE GROUP: SERVICE SEGMENTS
TABLE 160. TELIT CORPORATE GROUP: PRODUCT PORTFOLIO
TABLE 161. TELIT CORPORATE GROUP: KEY STRATEGIES
TABLE 162. CLIMATE LLC: KEY EXECUTIVES
TABLE 163. CLIMATE LLC: COMPANY SNAPSHOT
TABLE 164. CLIMATE LLC: PRODUCT SEGMENTS
TABLE 165. CLIMATE LLC: PRODUCT PORTFOLIO
TABLE 166. TRIMBLE INC.: KEY EXECUTIVES
TABLE 167. TRIMBLE INC.: COMPANY SNAPSHOT
TABLE 168. TRIMBLE INC.: SERVICE SEGMENTS
TABLE 169. TRIMBLE INC.: PRODUCT PORTFOLIO
TABLE 170. TRIMBLE INC.: KEY STRATEGIES
TABLE 171. HITACHI, LTD: KEY EXECUTIVES
TABLE 172. HITACHI, LTD: COMPANY SNAPSHOT
TABLE 173. HITACHI, LTD: SERVICE SEGMENTS
TABLE 174. HITACHI, LTD: PRODUCT PORTFOLIO
LIST OF FIGURES
FIGURE 01. IOT IN AGRICULTURE MARKET, 2021-2031
FIGURE 02. SEGMENTATION OF IOT IN AGRICULTURE MARKET, 2021-2031
FIGURE 03. TOP INVESTMENT POCKETS IN IOT IN AGRICULTURE MARKET (2022-2031)
FIGURE 04. PORTER FIVE-1
FIGURE 05. PORTER FIVE-2
FIGURE 06. PORTER FIVE-3
FIGURE 07. PORTER FIVE-4
FIGURE 08. PORTER FIVE-5
FIGURE 09. DRIVERS, RESTRAINTS AND OPPORTUNITIES: GLOBALIOT IN AGRICULTURE MARKET
FIGURE 10. IOT IN AGRICULTURE MARKET, BY APPLICATION, 2021(%)
FIGURE 11. COMPARATIVE SHARE ANALYSIS OF IOT IN AGRICULTURE MARKET FOR PRECISION FARMING, BY COUNTRY 2021-2031(%)
FIGURE 12. COMPARATIVE SHARE ANALYSIS OF IOT IN AGRICULTURE MARKET FOR LIVESTOCK MONITORING, BY COUNTRY 2021-2031(%)
FIGURE 13. COMPARATIVE SHARE ANALYSIS OF IOT IN AGRICULTURE MARKET FOR SMART GREENHOUSE, BY COUNTRY 2021-2031(%)
FIGURE 14. COMPARATIVE SHARE ANALYSIS OF IOT IN AGRICULTURE MARKET FOR FISH FARM MONITORING, BY COUNTRY 2021-2031(%)
FIGURE 15. IOT IN AGRICULTURE MARKET, BY SYSTEM, 2021(%)
FIGURE 16. COMPARATIVE SHARE ANALYSIS OF IOT IN AGRICULTURE MARKET FOR AUTOMATION AND CONTROL SYSTEMS, BY COUNTRY 2021-2031(%)
FIGURE 17. COMPARATIVE SHARE ANALYSIS OF IOT IN AGRICULTURE MARKET FOR SENSING AND MONITORING DEVICES, BY COUNTRY 2021-2031(%)
FIGURE 18. COMPARATIVE SHARE ANALYSIS OF IOT IN AGRICULTURE MARKET FOR LIVESTOCK MONITORING HARDWARE, BY COUNTRY 2021-2031(%)
FIGURE 19. COMPARATIVE SHARE ANALYSIS OF IOT IN AGRICULTURE MARKET FOR FISH FARMING HARDWARE, BY COUNTRY 2021-2031(%)
FIGURE 20. COMPARATIVE SHARE ANALYSIS OF IOT IN AGRICULTURE MARKET FOR SMART GREENHOUSE HARDWARE, BY COUNTRY 2021-2031(%)
FIGURE 21. COMPARATIVE SHARE ANALYSIS OF IOT IN AGRICULTURE MARKET FOR SOFTWARE, BY COUNTRY 2021-2031(%)
FIGURE 22. IOT IN AGRICULTURE MARKET, BY FARM TYPE, 2021(%)
FIGURE 23. COMPARATIVE SHARE ANALYSIS OF IOT IN AGRICULTURE MARKET FOR LARGE, BY COUNTRY 2021-2031(%)
FIGURE 24. COMPARATIVE SHARE ANALYSIS OF IOT IN AGRICULTURE MARKET FOR MID SIZE, BY COUNTRY 2021-2031(%)
FIGURE 25. COMPARATIVE SHARE ANALYSIS OF IOT IN AGRICULTURE MARKET FOR SMALL FARMS, BY COUNTRY 2021-2031(%)
FIGURE 26. IOT IN AGRICULTURE MARKET BY REGION, 2021
FIGURE 27. U.S. IOT IN AGRICULTURE MARKET, 2021-2031 ($MILLION)
FIGURE 28. CANADA IOT IN AGRICULTURE MARKET, 2021-2031 ($MILLION)
FIGURE 29. MEXICO IOT IN AGRICULTURE MARKET, 2021-2031 ($MILLION)
FIGURE 30. UK IOT IN AGRICULTURE MARKET, 2021-2031 ($MILLION)
FIGURE 31. GERMANY IOT IN AGRICULTURE MARKET, 2021-2031 ($MILLION)
FIGURE 32. FRANCE IOT IN AGRICULTURE MARKET, 2021-2031 ($MILLION)
FIGURE 33. ITALY IOT IN AGRICULTURE MARKET, 2021-2031 ($MILLION)
FIGURE 34. SPAIN IOT IN AGRICULTURE MARKET, 2021-2031 ($MILLION)
FIGURE 35. RUSSIA IOT IN AGRICULTURE MARKET, 2021-2031 ($MILLION)
FIGURE 36. AUSTRIA IOT IN AGRICULTURE MARKET, 2021-2031 ($MILLION)
FIGURE 37. NETHERLANDS IOT IN AGRICULTURE MARKET, 2021-2031 ($MILLION)
FIGURE 38. DENMARK IOT IN AGRICULTURE MARKET, 2021-2031 ($MILLION)
FIGURE 39. REST OF EUROPE IOT IN AGRICULTURE MARKET, 2021-2031 ($MILLION)
FIGURE 40. CHINA IOT IN AGRICULTURE MARKET, 2021-2031 ($MILLION)
FIGURE 41. INDIA IOT IN AGRICULTURE MARKET, 2021-2031 ($MILLION)
FIGURE 42. JAPAN IOT IN AGRICULTURE MARKET, 2021-2031 ($MILLION)
FIGURE 43. AUSTRALIA IOT IN AGRICULTURE MARKET, 2021-2031 ($MILLION)
FIGURE 44. SOUTH KOREA IOT IN AGRICULTURE MARKET, 2021-2031 ($MILLION)
FIGURE 45. THAILAND IOT IN AGRICULTURE MARKET, 2021-2031 ($MILLION)
FIGURE 46. MALAYSIA IOT IN AGRICULTURE MARKET, 2021-2031 ($MILLION)
FIGURE 47. SINGAPORE IOT IN AGRICULTURE MARKET, 2021-2031 ($MILLION)
FIGURE 48. INDONESIA IOT IN AGRICULTURE MARKET, 2021-2031 ($MILLION)
FIGURE 49. NEW ZEALAND IOT IN AGRICULTURE MARKET, 2021-2031 ($MILLION)
FIGURE 50. REST OF ASIA-PACIFIC IOT IN AGRICULTURE MARKET, 2021-2031 ($MILLION)
FIGURE 51. BRAZIL IOT IN AGRICULTURE MARKET, 2021-2031 ($MILLION)
FIGURE 52. ARGENTINA IOT IN AGRICULTURE MARKET, 2021-2031 ($MILLION)
FIGURE 53. SOUTH AFRICA IOT IN AGRICULTURE MARKET, 2021-2031 ($MILLION)
FIGURE 54. MIDDLE EAST IOT IN AGRICULTURE MARKET, 2021-2031 ($MILLION)
FIGURE 55. SAUDI ARABIA IOT IN AGRICULTURE MARKET, 2021-2031 ($MILLION)
FIGURE 56. EGYPT IOT IN AGRICULTURE MARKET, 2021-2031 ($MILLION)
FIGURE 57. NIGERIA IOT IN AGRICULTURE MARKET, 2021-2031 ($MILLION)
FIGURE 58. REST OF LAMEA IOT IN AGRICULTURE MARKET, 2021-2031 ($MILLION)
FIGURE 59. TOP WINNING STRATEGIES, BY YEAR
FIGURE 60. TOP WINNING STRATEGIES, BY DEVELOPMENT
FIGURE 61. TOP WINNING STRATEGIES, BY COMPANY
FIGURE 62. PRODUCT MAPPING OF TOP 10 PLAYERS
FIGURE 63. COMPETITIVE DASHBOARD
FIGURE 64. COMPETITIVE HEATMAP: IOT IN AGRICULTURE MARKET
FIGURE 65. TOP PLAYER POSITIONING, 2021
FIGURE 66. CISCO SYSTEMS, INC.: NET REVENUE, 2020-2022 ($MILLION)
FIGURE 67. CISCO SYSTEMS, INC.: RESEARCH & DEVELOPMENT EXPENDITURE, 2020-2022 ($MILLION)
FIGURE 68. CISCO SYSTEMS, INC.: REVENUE SHARE BY SEGMENT, 2022 (%)
FIGURE 69. FARMERS EDGE INC.: NET REVENUE, 2019-2021 ($MILLION)
FIGURE 70. FARMERS EDGE INC.: REVENUE SHARE BY REGION, 2021 (%)
FIGURE 71. TRIMBLE INC.: NET REVENUE, 2019-2021 ($MILLION)
FIGURE 72. TRIMBLE INC.: REVENUE SHARE BY SEGMENT, 2021 (%)
FIGURE 73. HITACHI, LTD: NET REVENUE, 2019-2021 ($MILLION)
FIGURE 74. HITACHI, LTD: REVENUE SHARE BY SEGMENT, 2020 (%)
FIGURE 75. HITACHI, LTD: REVENUE SHARE BY REGION, 2020 (%)

