0
U.S. (TOLL FREE)
+1 (315) 215-3225
Automative

0
U.S. (TOLL FREE)
+1 (315) 215-3225
Milking Robots Market By System (Single-Stall Milking System, Multi-stall Milking System, Rotary Milking System), By Offering (Software, Hardware, Services), By Herd Size (Less than 100, Between 100 to 1,000, More than 1,000): Global Opportunity Analysis and Industry Forecast, 2022-2031
Published Date: March 2023
|
Report Code: ALLI-Auto-0L744
Home | Market Reports | Business & Industrial| Agriculture & Forestry| Livestock
Milking Robots Market By System Single Stall Milking System Multi stall Milking System Rotary Milking System By Offering Software Hardware Services By Herd Size Less than 100 Between 100 to 1 000 More than 1 000 Global Opportunity Analysis and Industry Forecast 2022 2031
BUY CHAPTERS

Milking Robots Market By System (Single-Stall Milking System, Multi-stall Milking System, Rotary Milking System), By Offering (Software, Hardware, Services), By Herd Size (Less than 100, Between 100 to 1,000, More than 1,000): Global Opportunity Analysis and Industry Forecast, 2022-2031

Code: ALLI-Auto-0L744
Report
March 2023
Pages:280
Allied Market Research
Buy Now with 15% Discount
DESCRIPTION
TABLE OF CONTENT
TABLES & FIGURES

Milking Robots Market Size

According to a new report published by , titled, “Milking Robots Market," The milking robots market was valued at $1.7 billion in 2021, and is estimated to reach $7 billion by 2031, growing at a CAGR of 15.3% from 2022 to 2031.

Milking Robots Market

Milking Robots Market

Milking robots are automated milking systems that milk without the direct involvement of an operator. The cows are milked all day, including the 1 or 2 hours required for cleaning the machinery. The usual number of milkings performed per day is 2.5-3. As a consequence, output is increased by 10-15%. Cows may visit a milking robot on their own or be guided to do so via automatic gates. Cows are typically housed indoors all year in barns equipped with a milking robot. Robots milking occurs when an automatic milking system (AMS) substitutes a person to perform all of the tasks associated with milking a herd of cows. The system is designed to guide cows to the milking shed, identify each cow separately, milk the cows, check the milk, and record statistics on individual cows.
The demand for milking robot systems in the dairy farming business is being driven by a significant increase in herd sizes and the introduction of cutting-edge automation technologies. The use of technology makes it possible to automate a variety of dairy operations, including herd management, milking processes, and dairy farm administration. Due to the process' improved efficiency and frequency, automated milking rotaries have several advantages, including reduced labor costs due to less reliance on manual work and higher milk yields from more frequent milking. It also makes milk production easier. Robots technology is being used to cut down on labor requirements and help keep product quality. As a result of rising dairy product demand and the expansion of dairy farms around the world, higher labor and operating expenses are predicted. By significantly increasing milk production, milking automation technology, like milking robots, can significantly reduce labor expenses on dairy farms. Milking robots increase the number of times a single cow can be milked, which increases output in addition to decreasing manual labor.
The market also offers growth opportunities to the key players in the market. The market growth is primarily being driven by the significant expansion of the dairy industry and the growing demand for efficient AMS solutions over traditional milking methods to optimize milk output at lower labor costs. This is also affected by the increase in demand for dairy products like milk, curd, and butter due to their many health advantages and nutritional value. Another factor promoting growth is the development of robot framework monitors and the incorporation of self-contained controller (SCC) sensors to proactively analyze milk flow and identify mastitis early. Such technologies also aid in maximizing milk ability and keeping an eye on cleaning needs and individual spaces. Furthermore, manufacturers with a variety of functions, such as herd and farm administration, are continually developing a number of advanced automation technologies, which is driving market expansion. In addition, growing herd health concerns and widespread adoption of cutting-edge robots with improved technical support are favorably accelerating market development.
The milking robots market is segmented into system, offering, herd size, and region. On the basis of system, the market is categorized into single-stall milking system, multi-stall milking system and rotary milking system. On the basis of offering, it is categorized into software, hardware, and services. On the basis of herd size, it is fragmented into less than 100, between 100 to 1,000 and more than 1,000 Region wise, it is analyzed across North America (the U.S., Canada, and Mexico), Europe (the UK, Germany, Italy, France, Spain, and rest of Europe), Asia-Pacific (China, India, Japan, Australia, South Korea, and rest of Asia-Pacific), and LAMEA (Brazil, Saudi Arabia, United Arab Emirates, South Africa, and rest of LAMEA).
The key players profiled in the study include Afimilk Ltd., BouMatic Robotics, Dairymaster, DeLaval (Tetra Laval), Fullwood Ltd., GEA Group AG, Lely Industries N.V., Read Industrial Ltd., System Happel, and Waikato Milking Systems NZ LP. The players in the market have been actively engaged in the adoption various strategies such as acquisition, product launch and expansion to remain competitive and gain advantage over the competitors in the market. For instance, on December 8, 2022, A "robust co-development and commercial collaboration" has been reached between Lely, a provider of robots and management systems for dairy farming, and Connecterra, a Dutch startup that uses artificial intelligence to provide insights to farmers.
Key Market Insights
By system, the multi-stall milking system segment was the highest revenue contributor to the market in 2021. and rotary milking system sub-segment is anticipated to be the fastest growing sub-segment during the forecast period.
By offering, the hardware segment dominated the global market in 2021 and is estimated to be the fastest growing during the forecast years.
Based on herd size, the Less than 100 segment was the highest revenue contributor to the market in 2021 and between 100 to 1,000 sub-segment is anticipated to be the fastest growing sub-segment during the forecast period.
Based on region, Europe was the highest revenue contributor to the market in 2021.


Overview

The global milking robots market is envisioned to garner $7.0 billion by 2031, growing from $1.7 billion in 2021 at a CAGR of 15.3% from 2022 to 2031.
The use of milking robots' systems was primarily a reaction to increasing labor costs on farms in many dairy-producing nations. They were intended to take the place of the manual labor requirements incurred during the set milking times, freeing up the farmer's time for other activities. Robots milking systems can free up labor, do not require management, improve life quality due to the decreased labor demands, offer greater time flexibility, and eliminate four to five hours of labor per day. The robot milkers can do more than just milk the cows; they can also gather important statistics and information, such as the amount of milk produced by each cow.
The dairy farmers' ability to handle minor repairs, the cost of replacing some components after their warranties have expired, including the hydraulic arms that move in and out from under cows and the lasers that find the cows' teats, are a few market restraints. Cleaning and inspecting the teats and attaching the milking equipment (milking cups) to the teats were the manual labor tasks required during the milking process. Because these tasks are complex and require accurate detection, they have been successfully automated in the voluntary milking system (VMS) or the automatic milking system (AMS).
The significant expansion of the dairy industry, as well as the growing demand for effective AMS solutions over traditional milking techniques to optimize milk production at lower labor costs, are primarily driving market growth. This is further influenced by the increasing demand for dairy products such as milk, curd, and butter due to their numerous health benefits and nutritional compositions. The market is growing as a result of the increasing demand from the food and beverage industries as well as the growing number of dairy businesses. The use of robots for operational reasons is being encouraged by this, along with rising demand for high-quality and quantity milk and the high cost of labor, which is in turn stimulating market growth.
The rate at which robots and automation are used in agricultural contexts has accelerated due to the COVID-19 pandemic. Production of components was drastically reduced during the coronavirus disaster to stop the infection from spreading. However, due to a number of issues, including supply chain disruptions and labor shortages, farm owners are recognizing that automation may be the solution to some of the problems that may develop in the event of future disruptions. Although it is expected that the COVID-19 restriction will lead to a 70% decrease in migrant seasonal workers, the level of uncertainty is growing.
The key players profiled in this report include Afimilk Ltd., BouMatic Robotics, Dairymaster, DeLaval (Tetra Laval), Fullwood Ltd., GEA Group AG, Lely Industries N.V., Read Industrial Ltd., System Happel, and Waikato Milking Systems NZ LP.

Key Benefits For Stakeholders

●This report provides a quantitative analysis of the market segments, current trends, estimations, and dynamics of the milking robots market analysis from 2021 to 2031 to identify the prevailing milking robots market opportunities.
●The market research is offered along with information related to key drivers, restraints, and opportunities.
●Porter's five forces analysis highlights the potency of buyers and suppliers to enable stakeholders make profit-oriented business decisions and strengthen their supplier-buyer network.
●In-depth analysis of the milking robots market segmentation assists to determine the prevailing market opportunities.
●Major countries in each region are mapped according to their revenue contribution to the global market.
●Market player positioning facilitates benchmarking and provides a clear understanding of the present position of the market players.
●The report includes the analysis of the regional as well as global milking robots market trends, key players, market segments, application areas, and market growth strategies.
Key Market Segments
○ DAIRYMASTE

Scope of Milking Robots Market Report

Report Metric Details
Report Name Milking Robots Market
Accounted market size in 2021 $ 1.7 billion
Forecasted market size in 2031 $ 7 billion
CAGR 15.3%
Base Year 2021
Forecasted years 2024 - 2031
By Herd Size ● Less than 100
● Between 100 to 1,000
● More than 1,000
By System ● Multi-stall Milking System
● Rotary Milking System
● Single-Stall Milking System
By Offering ● Software
● Hardware
● Services
By Region
  • North America (United States, Canada)
  • Europe (Germany, France, UK, Italy, Russia) Rest of Europe
  • Nordic Countries
  • Asia-Pacific (China, Japan, South Korea)
  • Southeast Asia (India, Australia)
  • Rest of Asia
  • Latin America (Mexico, Brazil)
  • Rest of Latin America
  • Middle East & Africa (Turkey, Saudi Arabia, UAE, Rest of MEA)
Forecast units USD million in value
Report coverage Revenue and volume forecast, company share, competitive landscape, growth factors and trends

FAQ for this report

How fast is Milking Robots Market growing?

Ans: The Milking Robots Market witnessing a CAGR of 15.3% during the forecast period 2024-2031.

What is the Milking Robots Market size in 2031?

Ans: The Milking Robots Market size in 2031 will be $ 7 billion.

CHAPTER 1: INTRODUCTION
1.1. Report description
1.2. Key market segments
1.3. Key benefits to the stakeholders
1.4. Research Methodology
1.4.1. Primary research
1.4.2. Secondary research
1.4.3. Analyst tools and models
CHAPTER 2: EXECUTIVE SUMMARY
2.1. CXO Perspective
CHAPTER 3: MARKET OVERVIEW
3.1. Market definition and scope
3.2. Key findings
3.2.1. Top impacting factors
3.2.2. Top investment pockets
3.3. Porter’s five forces analysis
3.4. Market dynamics
3.4.1. Drivers
3.4.2. Restraints
3.4.3. Opportunities
3.5. COVID-19 Impact Analysis on the market
3.6. Average Selling Price
3.7. Brand Share Analysis
3.8. Key Regulation Analysis
3.9. Market Share Analysis
3.10. Patent Landscape
3.11. Regulatory Guidelines
3.12. Value Chain Analysis
CHAPTER 4: MILKING ROBOTS MARKET, BY SYSTEM
4.1. Overview
4.1.1. Market size and forecast
4.2. Single-Stall Milking System
4.2.1. Key market trends, growth factors and opportunities
4.2.2. Market size and forecast, by region
4.2.3. Market share analysis by country
4.3. Multi-stall Milking System
4.3.1. Key market trends, growth factors and opportunities
4.3.2. Market size and forecast, by region
4.3.3. Market share analysis by country
4.4. Rotary Milking System
4.4.1. Key market trends, growth factors and opportunities
4.4.2. Market size and forecast, by region
4.4.3. Market share analysis by country
CHAPTER 5: MILKING ROBOTS MARKET, BY OFFERING
5.1. Overview
5.1.1. Market size and forecast
5.2. Software
5.2.1. Key market trends, growth factors and opportunities
5.2.2. Market size and forecast, by region
5.2.3. Market share analysis by country
5.3. Hardware
5.3.1. Key market trends, growth factors and opportunities
5.3.2. Market size and forecast, by region
5.3.3. Market share analysis by country
5.4. Services
5.4.1. Key market trends, growth factors and opportunities
5.4.2. Market size and forecast, by region
5.4.3. Market share analysis by country
CHAPTER 6: MILKING ROBOTS MARKET, BY HERD SIZE
6.1. Overview
6.1.1. Market size and forecast
6.2. Less than 100
6.2.1. Key market trends, growth factors and opportunities
6.2.2. Market size and forecast, by region
6.2.3. Market share analysis by country
6.3. Between 100 to 1,000
6.3.1. Key market trends, growth factors and opportunities
6.3.2. Market size and forecast, by region
6.3.3. Market share analysis by country
6.4. More than 1,000
6.4.1. Key market trends, growth factors and opportunities
6.4.2. Market size and forecast, by region
6.4.3. Market share analysis by country
CHAPTER 7: MILKING ROBOTS MARKET, BY REGION
7.1. Overview
7.1.1. Market size and forecast By Region
7.2. North America
7.2.1. Key trends and opportunities
7.2.2. Market size and forecast, by System
7.2.3. Market size and forecast, by Offering
7.2.4. Market size and forecast, by Herd Size
7.2.5. Market size and forecast, by country
7.2.5.1. U.S.
7.2.5.1.1. Key market trends, growth factors and opportunities
7.2.5.1.2. Market size and forecast, by System
7.2.5.1.3. Market size and forecast, by Offering
7.2.5.1.4. Market size and forecast, by Herd Size
7.2.5.2. Canada
7.2.5.2.1. Key market trends, growth factors and opportunities
7.2.5.2.2. Market size and forecast, by System
7.2.5.2.3. Market size and forecast, by Offering
7.2.5.2.4. Market size and forecast, by Herd Size
7.2.5.3. Mexico
7.2.5.3.1. Key market trends, growth factors and opportunities
7.2.5.3.2. Market size and forecast, by System
7.2.5.3.3. Market size and forecast, by Offering
7.2.5.3.4. Market size and forecast, by Herd Size
7.3. Europe
7.3.1. Key trends and opportunities
7.3.2. Market size and forecast, by System
7.3.3. Market size and forecast, by Offering
7.3.4. Market size and forecast, by Herd Size
7.3.5. Market size and forecast, by country
7.3.5.1. Germany
7.3.5.1.1. Key market trends, growth factors and opportunities
7.3.5.1.2. Market size and forecast, by System
7.3.5.1.3. Market size and forecast, by Offering
7.3.5.1.4. Market size and forecast, by Herd Size
7.3.5.2. UK
7.3.5.2.1. Key market trends, growth factors and opportunities
7.3.5.2.2. Market size and forecast, by System
7.3.5.2.3. Market size and forecast, by Offering
7.3.5.2.4. Market size and forecast, by Herd Size
7.3.5.3. France
7.3.5.3.1. Key market trends, growth factors and opportunities
7.3.5.3.2. Market size and forecast, by System
7.3.5.3.3. Market size and forecast, by Offering
7.3.5.3.4. Market size and forecast, by Herd Size
7.3.5.4. Netherlands
7.3.5.4.1. Key market trends, growth factors and opportunities
7.3.5.4.2. Market size and forecast, by System
7.3.5.4.3. Market size and forecast, by Offering
7.3.5.4.4. Market size and forecast, by Herd Size
7.3.5.5. Italy
7.3.5.5.1. Key market trends, growth factors and opportunities
7.3.5.5.2. Market size and forecast, by System
7.3.5.5.3. Market size and forecast, by Offering
7.3.5.5.4. Market size and forecast, by Herd Size
7.3.5.6. Rest of Europe
7.3.5.6.1. Key market trends, growth factors and opportunities
7.3.5.6.2. Market size and forecast, by System
7.3.5.6.3. Market size and forecast, by Offering
7.3.5.6.4. Market size and forecast, by Herd Size
7.4. Asia-Pacific
7.4.1. Key trends and opportunities
7.4.2. Market size and forecast, by System
7.4.3. Market size and forecast, by Offering
7.4.4. Market size and forecast, by Herd Size
7.4.5. Market size and forecast, by country
7.4.5.1. China
7.4.5.1.1. Key market trends, growth factors and opportunities
7.4.5.1.2. Market size and forecast, by System
7.4.5.1.3. Market size and forecast, by Offering
7.4.5.1.4. Market size and forecast, by Herd Size
7.4.5.2. Japan
7.4.5.2.1. Key market trends, growth factors and opportunities
7.4.5.2.2. Market size and forecast, by System
7.4.5.2.3. Market size and forecast, by Offering
7.4.5.2.4. Market size and forecast, by Herd Size
7.4.5.3. India
7.4.5.3.1. Key market trends, growth factors and opportunities
7.4.5.3.2. Market size and forecast, by System
7.4.5.3.3. Market size and forecast, by Offering
7.4.5.3.4. Market size and forecast, by Herd Size
7.4.5.4. South Korea
7.4.5.4.1. Key market trends, growth factors and opportunities
7.4.5.4.2. Market size and forecast, by System
7.4.5.4.3. Market size and forecast, by Offering
7.4.5.4.4. Market size and forecast, by Herd Size
7.4.5.5. Australia
7.4.5.5.1. Key market trends, growth factors and opportunities
7.4.5.5.2. Market size and forecast, by System
7.4.5.5.3. Market size and forecast, by Offering
7.4.5.5.4. Market size and forecast, by Herd Size
7.4.5.6. Rest of Asia-Pacific
7.4.5.6.1. Key market trends, growth factors and opportunities
7.4.5.6.2. Market size and forecast, by System
7.4.5.6.3. Market size and forecast, by Offering
7.4.5.6.4. Market size and forecast, by Herd Size
7.5. LAMEA
7.5.1. Key trends and opportunities
7.5.2. Market size and forecast, by System
7.5.3. Market size and forecast, by Offering
7.5.4. Market size and forecast, by Herd Size
7.5.5. Market size and forecast, by country
7.5.5.1. Brazil
7.5.5.1.1. Key market trends, growth factors and opportunities
7.5.5.1.2. Market size and forecast, by System
7.5.5.1.3. Market size and forecast, by Offering
7.5.5.1.4. Market size and forecast, by Herd Size
7.5.5.2. UAE
7.5.5.2.1. Key market trends, growth factors and opportunities
7.5.5.2.2. Market size and forecast, by System
7.5.5.2.3. Market size and forecast, by Offering
7.5.5.2.4. Market size and forecast, by Herd Size
7.5.5.3. Saudi Arabia
7.5.5.3.1. Key market trends, growth factors and opportunities
7.5.5.3.2. Market size and forecast, by System
7.5.5.3.3. Market size and forecast, by Offering
7.5.5.3.4. Market size and forecast, by Herd Size
7.5.5.4. South Africa
7.5.5.4.1. Key market trends, growth factors and opportunities
7.5.5.4.2. Market size and forecast, by System
7.5.5.4.3. Market size and forecast, by Offering
7.5.5.4.4. Market size and forecast, by Herd Size
7.5.5.5. Rest of LAMEA
7.5.5.5.1. Key market trends, growth factors and opportunities
7.5.5.5.2. Market size and forecast, by System
7.5.5.5.3. Market size and forecast, by Offering
7.5.5.5.4. Market size and forecast, by Herd Size
CHAPTER 8: COMPETITIVE LANDSCAPE
8.1. Introduction
8.2. Top winning strategies
8.3. Product Mapping of Top 10 Player
8.4. Competitive Dashboard
8.5. Competitive Heatmap
8.6. Top player positioning, 2021
CHAPTER 9: COMPANY PROFILES
9.1. Lely
9.1.1. Company overview
9.1.2. Key Executives
9.1.3. Company snapshot
9.2. DeLaval
9.2.1. Company overview
9.2.2. Key Executives
9.2.3. Company snapshot
9.3. GEA Group Aktiengesellschaft
9.3.1. Company overview
9.3.2. Key Executives
9.3.3. Company snapshot
9.4.  Hokofarm Group
9.4.1. Company overview
9.4.2. Key Executives
9.4.3. Company snapshot
9.5. Fullwood Packo
9.5.1. Company overview
9.5.2. Key Executives
9.5.3. Company snapshot
9.6. Milkomax Solutions laitières
9.6.1. Company overview
9.6.2. Key Executives
9.6.3. Company snapshot
9.7. BouMatic
9.7.1. Company overview
9.7.2. Key Executives
9.7.3. Company snapshot
9.8. AktivPuls GmbH
9.8.1. Company overview
9.8.2. Key Executives
9.8.3. Company snapshot
9.9.  Waikato Milking Systems NZ LP.
9.9.1. Company overview
9.9.2. Key Executives
9.9.3. Company snapshot
9.10. DAIRYMASTER
9.10.1. Company overview
9.10.2. Key Executives
9.10.3. Company snapsho
LIST OF TABLES
TABLE 01. GLOBAL MILKING ROBOTS MARKET, BY SYSTEM, 2021-2031 ($MILLION)
TABLE 02. MILKING ROBOTS MARKET FOR SINGLE-STALL MILKING SYSTEM, BY REGION, 2021-2031 ($MILLION)
TABLE 03. MILKING ROBOTS MARKET FOR MULTI-STALL MILKING SYSTEM, BY REGION, 2021-2031 ($MILLION)
TABLE 04. MILKING ROBOTS MARKET FOR ROTARY MILKING SYSTEM, BY REGION, 2021-2031 ($MILLION)
TABLE 05. GLOBAL MILKING ROBOTS MARKET, BY OFFERING, 2021-2031 ($MILLION)
TABLE 06. MILKING ROBOTS MARKET FOR SOFTWARE, BY REGION, 2021-2031 ($MILLION)
TABLE 07. MILKING ROBOTS MARKET FOR HARDWARE, BY REGION, 2021-2031 ($MILLION)
TABLE 08. MILKING ROBOTS MARKET FOR SERVICES, BY REGION, 2021-2031 ($MILLION)
TABLE 09. GLOBAL MILKING ROBOTS MARKET, BY HERD SIZE, 2021-2031 ($MILLION)
TABLE 10. MILKING ROBOTS MARKET FOR LESS THAN 100, BY REGION, 2021-2031 ($MILLION)
TABLE 11. MILKING ROBOTS MARKET FOR BETWEEN 100 TO 1,000, BY REGION, 2021-2031 ($MILLION)
TABLE 12. MILKING ROBOTS MARKET FOR MORE THAN 1,000, BY REGION, 2021-2031 ($MILLION)
TABLE 13. MILKING ROBOTS MARKET, BY REGION, 2021-2031 ($MILLION)
TABLE 14. NORTH AMERICA MILKING ROBOTS MARKET, BY SYSTEM, 2021-2031 ($MILLION)
TABLE 15. NORTH AMERICA MILKING ROBOTS MARKET, BY OFFERING, 2021-2031 ($MILLION)
TABLE 16. NORTH AMERICA MILKING ROBOTS MARKET, BY HERD SIZE, 2021-2031 ($MILLION)
TABLE 17. NORTH AMERICA MILKING ROBOTS MARKET, BY COUNTRY, 2021-2031 ($MILLION)
TABLE 18. U.S. MILKING ROBOTS MARKET, BY SYSTEM, 2021-2031 ($MILLION)
TABLE 19. U.S. MILKING ROBOTS MARKET, BY OFFERING, 2021-2031 ($MILLION)
TABLE 20. U.S. MILKING ROBOTS MARKET, BY HERD SIZE, 2021-2031 ($MILLION)
TABLE 21. CANADA MILKING ROBOTS MARKET, BY SYSTEM, 2021-2031 ($MILLION)
TABLE 22. CANADA MILKING ROBOTS MARKET, BY OFFERING, 2021-2031 ($MILLION)
TABLE 23. CANADA MILKING ROBOTS MARKET, BY HERD SIZE, 2021-2031 ($MILLION)
TABLE 24. MEXICO MILKING ROBOTS MARKET, BY SYSTEM, 2021-2031 ($MILLION)
TABLE 25. MEXICO MILKING ROBOTS MARKET, BY OFFERING, 2021-2031 ($MILLION)
TABLE 26. MEXICO MILKING ROBOTS MARKET, BY HERD SIZE, 2021-2031 ($MILLION)
TABLE 27. EUROPE MILKING ROBOTS MARKET, BY SYSTEM, 2021-2031 ($MILLION)
TABLE 28. EUROPE MILKING ROBOTS MARKET, BY OFFERING, 2021-2031 ($MILLION)
TABLE 29. EUROPE MILKING ROBOTS MARKET, BY HERD SIZE, 2021-2031 ($MILLION)
TABLE 30. EUROPE MILKING ROBOTS MARKET, BY COUNTRY, 2021-2031 ($MILLION)
TABLE 31. GERMANY MILKING ROBOTS MARKET, BY SYSTEM, 2021-2031 ($MILLION)
TABLE 32. GERMANY MILKING ROBOTS MARKET, BY OFFERING, 2021-2031 ($MILLION)
TABLE 33. GERMANY MILKING ROBOTS MARKET, BY HERD SIZE, 2021-2031 ($MILLION)
TABLE 34. UK MILKING ROBOTS MARKET, BY SYSTEM, 2021-2031 ($MILLION)
TABLE 35. UK MILKING ROBOTS MARKET, BY OFFERING, 2021-2031 ($MILLION)
TABLE 36. UK MILKING ROBOTS MARKET, BY HERD SIZE, 2021-2031 ($MILLION)
TABLE 37. FRANCE MILKING ROBOTS MARKET, BY SYSTEM, 2021-2031 ($MILLION)
TABLE 38. FRANCE MILKING ROBOTS MARKET, BY OFFERING, 2021-2031 ($MILLION)
TABLE 39. FRANCE MILKING ROBOTS MARKET, BY HERD SIZE, 2021-2031 ($MILLION)
TABLE 40. NETHERLANDS MILKING ROBOTS MARKET, BY SYSTEM, 2021-2031 ($MILLION)
TABLE 41. NETHERLANDS MILKING ROBOTS MARKET, BY OFFERING, 2021-2031 ($MILLION)
TABLE 42. NETHERLANDS MILKING ROBOTS MARKET, BY HERD SIZE, 2021-2031 ($MILLION)
TABLE 43. ITALY MILKING ROBOTS MARKET, BY SYSTEM, 2021-2031 ($MILLION)
TABLE 44. ITALY MILKING ROBOTS MARKET, BY OFFERING, 2021-2031 ($MILLION)
TABLE 45. ITALY MILKING ROBOTS MARKET, BY HERD SIZE, 2021-2031 ($MILLION)
TABLE 46. REST OF EUROPE MILKING ROBOTS MARKET, BY SYSTEM, 2021-2031 ($MILLION)
TABLE 47. REST OF EUROPE MILKING ROBOTS MARKET, BY OFFERING, 2021-2031 ($MILLION)
TABLE 48. REST OF EUROPE MILKING ROBOTS MARKET, BY HERD SIZE, 2021-2031 ($MILLION)
TABLE 49. ASIA-PACIFIC MILKING ROBOTS MARKET, BY SYSTEM, 2021-2031 ($MILLION)
TABLE 50. ASIA-PACIFIC MILKING ROBOTS MARKET, BY OFFERING, 2021-2031 ($MILLION)
TABLE 51. ASIA-PACIFIC MILKING ROBOTS MARKET, BY HERD SIZE, 2021-2031 ($MILLION)
TABLE 52. ASIA-PACIFIC MILKING ROBOTS MARKET, BY COUNTRY, 2021-2031 ($MILLION)
TABLE 53. CHINA MILKING ROBOTS MARKET, BY SYSTEM, 2021-2031 ($MILLION)
TABLE 54. CHINA MILKING ROBOTS MARKET, BY OFFERING, 2021-2031 ($MILLION)
TABLE 55. CHINA MILKING ROBOTS MARKET, BY HERD SIZE, 2021-2031 ($MILLION)
TABLE 56. JAPAN MILKING ROBOTS MARKET, BY SYSTEM, 2021-2031 ($MILLION)
TABLE 57. JAPAN MILKING ROBOTS MARKET, BY OFFERING, 2021-2031 ($MILLION)
TABLE 58. JAPAN MILKING ROBOTS MARKET, BY HERD SIZE, 2021-2031 ($MILLION)
TABLE 59. INDIA MILKING ROBOTS MARKET, BY SYSTEM, 2021-2031 ($MILLION)
TABLE 60. INDIA MILKING ROBOTS MARKET, BY OFFERING, 2021-2031 ($MILLION)
TABLE 61. INDIA MILKING ROBOTS MARKET, BY HERD SIZE, 2021-2031 ($MILLION)
TABLE 62. SOUTH KOREA MILKING ROBOTS MARKET, BY SYSTEM, 2021-2031 ($MILLION)
TABLE 63. SOUTH KOREA MILKING ROBOTS MARKET, BY OFFERING, 2021-2031 ($MILLION)
TABLE 64. SOUTH KOREA MILKING ROBOTS MARKET, BY HERD SIZE, 2021-2031 ($MILLION)
TABLE 65. AUSTRALIA MILKING ROBOTS MARKET, BY SYSTEM, 2021-2031 ($MILLION)
TABLE 66. AUSTRALIA MILKING ROBOTS MARKET, BY OFFERING, 2021-2031 ($MILLION)
TABLE 67. AUSTRALIA MILKING ROBOTS MARKET, BY HERD SIZE, 2021-2031 ($MILLION)
TABLE 68. REST OF ASIA-PACIFIC MILKING ROBOTS MARKET, BY SYSTEM, 2021-2031 ($MILLION)
TABLE 69. REST OF ASIA-PACIFIC MILKING ROBOTS MARKET, BY OFFERING, 2021-2031 ($MILLION)
TABLE 70. REST OF ASIA-PACIFIC MILKING ROBOTS MARKET, BY HERD SIZE, 2021-2031 ($MILLION)
TABLE 71. LAMEA MILKING ROBOTS MARKET, BY SYSTEM, 2021-2031 ($MILLION)
TABLE 72. LAMEA MILKING ROBOTS MARKET, BY OFFERING, 2021-2031 ($MILLION)
TABLE 73. LAMEA MILKING ROBOTS MARKET, BY HERD SIZE, 2021-2031 ($MILLION)
TABLE 74. LAMEA MILKING ROBOTS MARKET, BY COUNTRY, 2021-2031 ($MILLION)
TABLE 75. BRAZIL MILKING ROBOTS MARKET, BY SYSTEM, 2021-2031 ($MILLION)
TABLE 76. BRAZIL MILKING ROBOTS MARKET, BY OFFERING, 2021-2031 ($MILLION)
TABLE 77. BRAZIL MILKING ROBOTS MARKET, BY HERD SIZE, 2021-2031 ($MILLION)
TABLE 78. UAE MILKING ROBOTS MARKET, BY SYSTEM, 2021-2031 ($MILLION)
TABLE 79. UAE MILKING ROBOTS MARKET, BY OFFERING, 2021-2031 ($MILLION)
TABLE 80. UAE MILKING ROBOTS MARKET, BY HERD SIZE, 2021-2031 ($MILLION)
TABLE 81. SAUDI ARABIA MILKING ROBOTS MARKET, BY SYSTEM, 2021-2031 ($MILLION)
TABLE 82. SAUDI ARABIA MILKING ROBOTS MARKET, BY OFFERING, 2021-2031 ($MILLION)
TABLE 83. SAUDI ARABIA MILKING ROBOTS MARKET, BY HERD SIZE, 2021-2031 ($MILLION)
TABLE 84. SOUTH AFRICA MILKING ROBOTS MARKET, BY SYSTEM, 2021-2031 ($MILLION)
TABLE 85. SOUTH AFRICA MILKING ROBOTS MARKET, BY OFFERING, 2021-2031 ($MILLION)
TABLE 86. SOUTH AFRICA MILKING ROBOTS MARKET, BY HERD SIZE, 2021-2031 ($MILLION)
TABLE 87. REST OF LAMEA MILKING ROBOTS MARKET, BY SYSTEM, 2021-2031 ($MILLION)
TABLE 88. REST OF LAMEA MILKING ROBOTS MARKET, BY OFFERING, 2021-2031 ($MILLION)
TABLE 89. REST OF LAMEA MILKING ROBOTS MARKET, BY HERD SIZE, 2021-2031 ($MILLION)
TABLE 90. LELY: KEY EXECUTIVES
TABLE 91. LELY: COMPANY SNAPSHOT
TABLE 92. DELAVAL: KEY EXECUTIVES
TABLE 93. DELAVAL: COMPANY SNAPSHOT
TABLE 94. GEA GROUP AKTIENGESELLSCHAFT: KEY EXECUTIVES
TABLE 95. GEA GROUP AKTIENGESELLSCHAFT: COMPANY SNAPSHOT
TABLE 96.  HOKOFARM GROUP: KEY EXECUTIVES
TABLE 97.  HOKOFARM GROUP: COMPANY SNAPSHOT
TABLE 98. FULLWOOD PACKO: KEY EXECUTIVES
TABLE 99. FULLWOOD PACKO: COMPANY SNAPSHOT
TABLE 100. MILKOMAX SOLUTIONS LAITIÈRES: KEY EXECUTIVES
TABLE 101. MILKOMAX SOLUTIONS LAITIÈRES: COMPANY SNAPSHOT
TABLE 102. BOUMATIC: KEY EXECUTIVES
TABLE 103. BOUMATIC: COMPANY SNAPSHOT
TABLE 104. AKTIVPULS GMBH: KEY EXECUTIVES
TABLE 105. AKTIVPULS GMBH: COMPANY SNAPSHOT
TABLE 106.  WAIKATO MILKING SYSTEMS NZ LP.: KEY EXECUTIVES
TABLE 107.  WAIKATO MILKING SYSTEMS NZ LP.: COMPANY SNAPSHOT
TABLE 108. DAIRYMASTER: KEY EXECUTIVES
TABLE 109. DAIRYMASTER: COMPANY SNAPSHOT LIST OF FIGURES
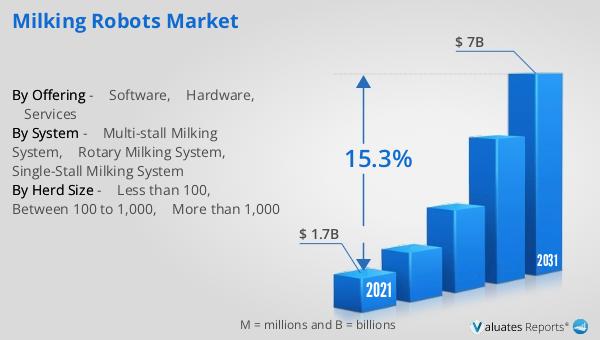
FIGURE 01. MILKING ROBOTS MARKET, 2021-2031
FIGURE 02. SEGMENTATION OF MILKING ROBOTS MARKET, 2021-2031
FIGURE 03. TOP INVESTMENT POCKETS IN MILKING ROBOTS MARKET (2022-2031)
FIGURE 04. PORTER FIVE-1
FIGURE 05. PORTER FIVE-2
FIGURE 06. PORTER FIVE-3
FIGURE 07. PORTER FIVE-4
FIGURE 08. PORTER FIVE-5
FIGURE 09. DRIVERS, RESTRAINTS AND OPPORTUNITIES: GLOBALMILKING ROBOTS MARKET
FIGURE 10. IMPACT OF KEY REGULATION: MILKING ROBOTS MARKET
FIGURE 11. MARKET SHARE ANALYSIS: MILKING ROBOTS MARKET
FIGURE 12. PATENT ANALYSIS BY COMPANY
FIGURE 13. PATENT ANALYSIS BY COUNTRY
FIGURE 14. REGULATORY GUIDELINES: MILKING ROBOTS MARKET
FIGURE 15. VALUE CHAIN ANALYSIS: MILKING ROBOTS MARKET
FIGURE 16. MILKING ROBOTS MARKET, BY SYSTEM, 2021(%)
FIGURE 17. COMPARATIVE SHARE ANALYSIS OF MILKING ROBOTS MARKET FOR SINGLE-STALL MILKING SYSTEM, BY COUNTRY 2021 AND 2031(%)
FIGURE 18. COMPARATIVE SHARE ANALYSIS OF MILKING ROBOTS MARKET FOR MULTI-STALL MILKING SYSTEM, BY COUNTRY 2021 AND 2031(%)
FIGURE 19. COMPARATIVE SHARE ANALYSIS OF MILKING ROBOTS MARKET FOR ROTARY MILKING SYSTEM, BY COUNTRY 2021 AND 2031(%)
FIGURE 20. MILKING ROBOTS MARKET, BY OFFERING, 2021(%)
FIGURE 21. COMPARATIVE SHARE ANALYSIS OF MILKING ROBOTS MARKET FOR SOFTWARE, BY COUNTRY 2021 AND 2031(%)
FIGURE 22. COMPARATIVE SHARE ANALYSIS OF MILKING ROBOTS MARKET FOR HARDWARE, BY COUNTRY 2021 AND 2031(%)
FIGURE 23. COMPARATIVE SHARE ANALYSIS OF MILKING ROBOTS MARKET FOR SERVICES, BY COUNTRY 2021 AND 2031(%)
FIGURE 24. MILKING ROBOTS MARKET, BY HERD SIZE, 2021(%)
FIGURE 25. COMPARATIVE SHARE ANALYSIS OF MILKING ROBOTS MARKET FOR LESS THAN 100, BY COUNTRY 2021 AND 2031(%)
FIGURE 26. COMPARATIVE SHARE ANALYSIS OF MILKING ROBOTS MARKET FOR BETWEEN 100 TO 1,000, BY COUNTRY 2021 AND 2031(%)
FIGURE 27. COMPARATIVE SHARE ANALYSIS OF MILKING ROBOTS MARKET FOR MORE THAN 1,000, BY COUNTRY 2021 AND 2031(%)
FIGURE 28. MILKING ROBOTS MARKET BY REGION, 2021
FIGURE 29. U.S. MILKING ROBOTS MARKET, 2021-2031 ($MILLION)
FIGURE 30. CANADA MILKING ROBOTS MARKET, 2021-2031 ($MILLION)
FIGURE 31. MEXICO MILKING ROBOTS MARKET, 2021-2031 ($MILLION)
FIGURE 32. GERMANY MILKING ROBOTS MARKET, 2021-2031 ($MILLION)
FIGURE 33. UK MILKING ROBOTS MARKET, 2021-2031 ($MILLION)
FIGURE 34. FRANCE MILKING ROBOTS MARKET, 2021-2031 ($MILLION)
FIGURE 35. NETHERLANDS MILKING ROBOTS MARKET, 2021-2031 ($MILLION)
FIGURE 36. ITALY MILKING ROBOTS MARKET, 2021-2031 ($MILLION)
FIGURE 37. REST OF EUROPE MILKING ROBOTS MARKET, 2021-2031 ($MILLION)
FIGURE 38. CHINA MILKING ROBOTS MARKET, 2021-2031 ($MILLION)
FIGURE 39. JAPAN MILKING ROBOTS MARKET, 2021-2031 ($MILLION)
FIGURE 40. INDIA MILKING ROBOTS MARKET, 2021-2031 ($MILLION)
FIGURE 41. SOUTH KOREA MILKING ROBOTS MARKET, 2021-2031 ($MILLION)
FIGURE 42. AUSTRALIA MILKING ROBOTS MARKET, 2021-2031 ($MILLION)
FIGURE 43. REST OF ASIA-PACIFIC MILKING ROBOTS MARKET, 2021-2031 ($MILLION)
FIGURE 44. BRAZIL MILKING ROBOTS MARKET, 2021-2031 ($MILLION)
FIGURE 45. UAE MILKING ROBOTS MARKET, 2021-2031 ($MILLION)
FIGURE 46. SAUDI ARABIA MILKING ROBOTS MARKET, 2021-2031 ($MILLION)
FIGURE 47. SOUTH AFRICA MILKING ROBOTS MARKET, 2021-2031 ($MILLION)
FIGURE 48. REST OF LAMEA MILKING ROBOTS MARKET, 2021-2031 ($MILLION)
FIGURE 49. TOP WINNING STRATEGIES, BY YEAR
FIGURE 50. TOP WINNING STRATEGIES, BY DEVELOPMENT
FIGURE 51. TOP WINNING STRATEGIES, BY COMPANY
FIGURE 52. PRODUCT MAPPING OF TOP 10 PLAYERS
FIGURE 53. COMPETITIVE DASHBOARD
FIGURE 54. COMPETITIVE HEATMAP: MILKING ROBOTS MARKET
FIGURE 55. TOP PLAYER POSITIONING, 202
SELECT A FORMAT
Added to Cart
Electronic (PDF)

$5730

This license allows only one user to access the PDF.
Electronic (PDF)

$6450

This license allows 1 - 5 user to access the PDF, license is suitable for small groups of 5 users working together
Electronic (PDF)

$9600

This license allows users/teams in a same Enterprise to use this report, various departments within an enterpise can use this report
Electronic (PDF)

$3840

This license just provides quantitative data in a excel sheet
Add to Cart
Buy Now (15% Discount)

OUR CUSTOMER

SecuX Technology Inc

SIMILAR REPORTS


RELATED REPORTS

Gray Duck Down - Global Market Share and Ranking, Overall Sales and Demand Forecast 2024-2030

120 Pages
Type: Report
Code: QYRE-Auto-0Q14916
Tue Apr 30 00:00:00 UTC 2024

Add to Cart

Global Smart Collar Tag for Cow Market Research Report 2024

120 Pages
Type: Report
Code: QYRE-Auto-0P9040
Sun Apr 28 00:00:00 UTC 2024

Add to Cart

Global Piglet Nests Market Research Report 2024

120 Pages
Type: Report
Code: QYRE-Auto-14R8448
Wed Apr 17 00:00:00 UTC 2024

Add to Cart

Global Chicken Rearing Cages Market Research Report 2024

120 Pages
Type: Report
Code: QYRE-Auto-18O8476
Wed Apr 17 00:00:00 UTC 2024

Add to Cart