
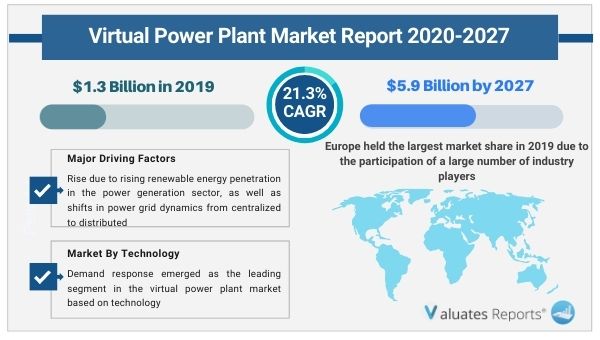
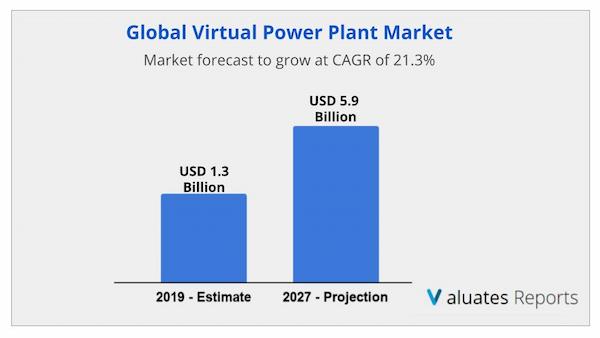
The global virtual power plant market was valued at USD 1.3 Billion in 2019 and is projected to reach USD 5.9 Billion by 2027, growing at a CAGR of 21.3% from 2020 to 2027. The virtual power plant market is expected to rise due to rising renewable energy penetration in the power generation sector, as well as shifts in power grid dynamics from centralized to distributed. The consumer demand will be boosted by further reductions in energy costs and the ease with which energy storage can be accessed.
A virtual power plant is a set of distributed generators with the aim of integrating various distributed energy sources such as biomass plants, biogas block heating plants, wind turbines, and hydroelectric plants. A virtual power plant is made up of various assets that are linked together by a central control system that processes a wide range of data, including current power exchange rates, price and weather forecasts, and grid information from system operators.
Preference for Renewable Energy
The drive for decarbonization and renewable energy generation is gaining momentum in the power sector. As the world transitions to a low carbon future decentralized power grid systems will dominate worldwide. Due to climate change and the arrival of electric vehicles, the demand for electricity is much higher than before. Virtual power plants can balance out renewable generation and consumption. They can trade power production using real-time historical data and weather forecasts. Secondly, meet the obligations of changing power prices and balance out demand for transmission grid operators during peak electricity requirements. This will ultimately drive the growth of the virtual power plant market in the coming years.
Advantages of VPPs ( Virtual Power Plants)
Due to extreme weather conditions and frequent power disruptions and fluctuations, there is a need for a complete infrastructural upgrade. VPPS( Virtual Power Plants) provide reliable connections during uncertain conditions and consumers can sell the unused power back to the company for monetary benefits. It is software that can be programmed for measuring weather forecasts using historical data. They can add extra resources to the main power grid in case of peak load. Hence these factors will provide largescale adoption thereby driving the growth of the virtual power plant market in the upcoming years.
Growing eco-friendly power generation systems
Due to strict government regulations regarding cutting back on CO2 emissions eco-friendly power generation, storage and consumption have become a necessity. VPPs help in this respect by combining all electrical load into a connected grid and reducing the need for reserve power storage thereby decreasing greenhouse gas emissions. This will further spur the growth of the virtual power plant market during the review period.
Detrimental health effects
Virtual power plants release high-frequency electromagnetic and radio waves which can be dangerous to infants and the older population. Moreover, if the high intensity is exposed to the skin then there are burns and body tissue damage. Such factors will hamper the virtual power plant market growth during the review period.
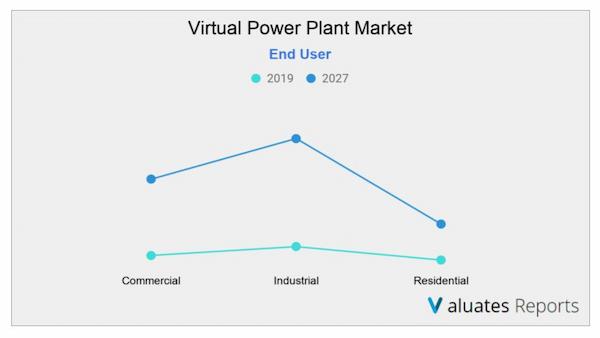
Due to the energy efficiency of the virtual power plant, the industrial segment accounted for 53 percent of the global market in 2019 and is projected to retain its dominance throughout the forecast period. However, due to increased demand for renewable energy, the residential consumer segment is projected to expand at the fastest pace.
Demand response emerged as the leading segment in the virtual power plant market based on technology. This can be due to grid modernization, which has resulted in an increase in demand response. Growing demand for smart devices to monitor customer-sited loads is driving the use of mixed assets.
Europe held the largest market share in 2019 due to the participation of a large number of industry players and new government policies across various European countries on a 100 percent renewable energy agenda. The Asia-Pacific virtual power plant market is growing at the fastest rate, owing to rising energy demand in countries like China and India as a result of rapid industrialization.
Based on technology, demand response is expected to provide lucrative opportunities for growth in the virtual power plant market share due to rising modernization in infrastructure leading to demand response. However, the mixed-asset segment will grow the fastest at a CAGR of 23.1% during the review period due to the rising use of smart devices for meeting customer demands.
Based on the end-user, the industrial segment will witness considerable growth in the virtual power plant market share with 53% due to the implementation of energy-efficient VPPs. On the other hand, the residential sector will grow the highest due to the demand for renewable energy.
Based on region, Europe will maintain the lead in the virtual power plant market share due to the presence of big industry players and favorable government support. While the Asia-Pacific will grow at a CAGR of 26.5% due to a huge rise in urbanization and industrial activities. China is the dominant country with 30.3%.
ABB Ltd.- ABB Ability™ solutions for utilities allow better prices for produced energy on the spot and derivatives markets, as well as optimized internal production. They also enable a lower cost of energy compensation and an improved fulfillment of the nominated load schedule. Balancing the infeed of renewables before balancing costs are generated is also made possible. The system architecture is scalable, from a few up to many thousands of units, and customers can implement their own business model.
Siemens AG - Siemens AG offers innovative technologies, extensive energy experience, and an ambitious strategy to decarbonize global energy systems and drivers of the energy transition. Siemens AG's top focus areas are in ESG, innovation, and transformation share how we're making the future of tomorrow different today for both our partners—and our people.
Schneider Electric SE - Schneider Electric SE is a European multinational company providing energy and digital automation solutions for efficiency and sustainability. It addresses homes, buildings, data centers, infrastructure, and industries, by combining energy technologies, real-time automation, software, and services.
The global Virtual Power Plant market analysis covers in-depth information of major industry participants.
Porter’s five forces analysis helps to analyze the potential of buyers & suppliers and the competitive scenario of the industry for strategy building.
Major countries have been mapped according to their individual revenue contribution to the regional market.
The report provides an in-depth analysis of the global Virtual Power Plant market forecast for the period 2020–2027.
The report outlines the current virtual power plant market trends and future estimations of the market from 2019 to 2027 to understand the prevailing opportunities and potential investment pockets.
The key drivers, restraints, and virtual power plant market opportunity and their detailed impact analysis is elucidated in the study.
North America
Europe
Asia-Pacific
Ans. The global virtual power plant market size to grow from USD 1.3 Billion in 2019 to USD 5.9 Billion by 2027, at a CAGR of 21.3% during the forecast period
Ans. The virtual power plant market is expected to rise due to rising renewable energy penetration in the power generation sector, as well as shifts in power grid dynamics from centralized to distributed.
Ans. Europe held the largest market share in the virtual power plant market in 2019
Ans. The key players profiled in the virtual power plant market report include ABB Ltd., AGL Energy, AutoGrid Systems, Inc., Enbala Power Networks, Enel X Inc., General Electric Company, Siemens AG, Schneider Electric SE
Ans. The demand response market holds the largest share of the virtual power plant market
Ans. The forecast period for the virtual power plant market is 2020 to 2027.
|
Report Metric |
Details |
|
Base Year: |
2019 |
|
Market Size in 2019: |
USD 1.3 Billion |
|
Forecast Period: |
2019 to 2027 |
|
Forecast Period 2019 to 2027 CAGR: |
21.3% |
|
2027 Value Projection: |
USD 5.9 Million |
|
No. of Pages: |
184 |
|
Tables & Figures |
34 |
|
Charts |
58 |
|
Segments covered: |
By Product, by Application, by End User, by Region |
TABLE 01.VIRTUAL POWER PLANT MARKET, BY TECHNOLOGY, 2019–2027 ($MILLION)
TABLE 02.VIRTUAL POWER PLANT DISTRIBUTION GENERATION MARKET, BY REGION, 2019–2027 ($MILLION)
TABLE 03.VIRTUAL POWER PLANT DEMAND RESPONSE MARKET, BY REGION, 2019–2027 ($MILLION)
TABLE 04.VIRTUAL POWER PLANT PLASTICS MARKET, BY REGION, 2019–2027 ($MILLION)
TABLE 05.VIRTUAL POWER PLANT MARKET, BY END USER, 2019–2027 (($MILLION)
TABLE 06.VIRTUAL POWER PLANT MARKET FOR INDUSTRIAL, BY REGION, 2019–2027 ($MILLION)
TABLE 07.VIRTUAL POWER PLANT MARKET FOR COMMERCIAL, BY REGION, 2019–2027 ($MILLION)
TABLE 08.VIRTUAL POWER PLANT MARKET FOR RESIDENTIAL, BY REGION, 2019–2027 ($MILLION)
TABLE 09.VIRTUAL POWER PLANT MARKET, BY REGION, 2019-2027 ($MILLION)68
TABLE 10.NORTH AMERICA VIRTUAL POWER PLANT MARKET, BY TECHNOLOGY, 2019–2027 ($MILLION)
TABLE 11.NORTH AMERICA VIRTUAL POWER PLANT MARKET, BY END USER, 2019–2027 ($MILLION)
TABLE 12.NORTH AMERICA VIRTUAL POWER PLANT MARKET, BY COUNTRY, 2019–2027 ($MILLION)
TABLE 13.U.S. VIRTUAL POWER PLANT MARKET, BY TECHNOLOGY, 2019–2027 ($MILLION)
TABLE 14.U.S. VIRTUAL POWER PLANT MARKET, BY END USER, 2019–2027 ($MILLION)
TABLE 15.CANADA VIRTUAL POWER PLANT MARKET, BY TECHNOLOGY, 2019–2027 ($MILLION)
TABLE 16.CANADA VIRTUAL POWER PLANT MARKET, BY END USER, 2019–2027 ($MILLION)
TABLE 17.MEXICO VIRTUAL POWER PLANT MARKET, BY TECHNOLOGY, 2019–2027 ($MILLION)
TABLE 18.MEXICO VIRTUAL POWER PLANT MARKET, BY END USER, 2019–2027 ($MILLION)
TABLE 19.EUROPE VIRTUAL POWER PLANT MARKET, BY TECHNOLOGY, 2019–2027 ($MILLION)
TABLE 20.EUROPE VIRTUAL POWER PLANT MARKET, BY END USER, 2019–2027 ($MILLION)
TABLE 21.EUROPE VIRTUAL POWER PLANT MARKET, BY COUNTRY, 2019–2027 ($MILLION)
TABLE 22.GERMANY VIRTUAL POWER PLANT MARKET, BY TECHNOLOGY, 2019–2027 ($MILLION)
TABLE 23.GERMANY VIRTUAL POWER PLANT MARKET, BY END USER, 2019–2027 ($MILLION)
TABLE 24.UK VIRTUAL POWER PLANT MARKET, BY TECHNOLOGY, 2019–2027 ($MILLION)
TABLE 25.UK VIRTUAL POWER PLANT MARKET, BY END USER, 2019–2027 ($MILLION)
TABLE 26.FRANCE VIRTUAL POWER PLANT MARKET, BY TECHNOLOGY, 2019–2027 ($MILLION)
TABLE 27.FRANCE VIRTUAL POWER PLANT MARKET, BY END USER, 2019–2027 ($MILLION)
TABLE 28.ITALY VIRTUAL POWER PLANT MARKET, BY TECHNOLOGY, 2019–2027 ($MILLION)
TABLE 29.ITALY VIRTUAL POWER PLANT MARKET, BY END USER, 2019–2027 ($MILLION)
TABLE 30.REST OF EUROPE VIRTUAL POWER PLANT MARKET, BY TECHNOLOGY, 2019–2027 ($MILLION)
TABLE 31.REST OF EUROPE VIRTUAL POWER PLANT MARKET, BY END USER, 2019–2027 ($MILLION)
TABLE 32.ASIA-PACIFIC VIRTUAL POWER PLANT MARKET, BY TECHNOLOGY, 2019–2027 ($MILLION)
TABLE 33.ASIA-PACIFIC VIRTUAL POWER PLANT MARKET, BY END USER, 2019–2027 ($MILLION)
TABLE 34.ASIA-PACIFIC VIRTUAL POWER PLANT MARKET, BY COUNTRY, 2019–2027 ($MILLION)
TABLE 35.CHINA VIRTUAL POWER PLANT MARKET, BY TECHNOLOGY, 2019–2027 ($MILLION)
TABLE 36.CHINA VIRTUAL POWER PLANT MARKET, BY END USER, 2019–2027 ($MILLION)
TABLE 37.JAPAN VIRTUAL POWER PLANT MARKET, BY TECHNOLOGY, 2019–2027 ($MILLION)
TABLE 38.JAPAN VIRTUAL POWER PLANT MARKET, BY END USER, 2019–2027 ($MILLION)
TABLE 39.INDIA VIRTUAL POWER PLANT MARKET, BY TECHNOLOGY, 2019–2027 ($MILLION)
TABLE 40.INDIA VIRTUAL POWER PLANT MARKET, BY END USER, 2019–2027 ($MILLION)
TABLE 41.AUSTRALIA VIRTUAL POWER PLANT MARKET, BY TECHNOLOGY, 2019–2027 ($MILLION)
TABLE 42.AUSTRALIA VIRTUAL POWER PLANT MARKET, BY END USER, 2019–2027 ($MILLION)
TABLE 43.REST OF ASIA-PACIFIC VIRTUAL POWER PLANT MARKET, BY TECHNOLOGY, 2019–2027 ($MILLION)
TABLE 44.REST OF ASIA-PACIFIC VIRTUAL POWER PLANT MARKET, BY END USER, 2019–2027 ($MILLION)
TABLE 45.LAMEA VIRTUAL POWER PLANT MARKET, BY TECHNOLOGY, 2019–2027 ($MILLION)
TABLE 46.LAMEA VIRTUAL POWER PLANT MARKET, BY END USER, 2019–2027 ($MILLION)
TABLE 47.LAMEA VIRTUAL POWER PLANT MARKET, BY COUNTRY, 2019–2027 ($MILLION)
TABLE 48.BRAZIL VIRTUAL POWER PLANT MARKET, BY TECHNOLOGY, 2019–2027 ($MILLION)
TABLE 49.BRAZIL VIRTUAL POWER PLANT MARKET, BY END USER, 2019–2027 ($MILLION)
TABLE 50.SAUDI ARABIA VIRTUAL POWER PLANT MARKET, BY TECHNOLOGY, 2019–2027 ($MILLION)
TABLE 51.SAUDI ARABIA VIRTUAL POWER PLANT MARKET, BY END USER, 2019–2027 ($MILLION)
TABLE 52.SOUTH AFRICA VIRTUAL POWER PLANT MARKET, BY TECHNOLOGY, 2019–2027 ($MILLION)
TABLE 53.SOUTH AFRICA VIRTUAL POWER PLANT MARKET, BY END USER, 2019–2027 ($MILLION)
TABLE 54.REST OF LAMEA VIRTUAL POWER PLANT MARKET, BY TECHNOLOGY, 2019–2027 ($MILLION)
TABLE 55.REST OF LAMEA VIRTUAL POWER PLANT MARKET, BY END USER, 2019–2027 ($MILLION)
TABLE 56.KEY BUSINESS EXPANSION
TABLE 57.KEY NEW PRODUCT
TABLE 58.KEY PARTNERSHIP
LIST OF FIGURES
FIGURE 01.KEY MARKET SEGMENTS
FIGURE 02.EXECUTIVE SUMMARY, BY SEGMENT
FIGURE 03.EXECUTIVE SUMMARY, BY COUNTRY
FIGURE 04.TOP INVESTMENT POCKETS
FIGURE 05.TOP WINNING STRATEGIES (2015-2019)
FIGURE 06.TOP WINNING STRATEGIES BY COMPANY (2015-2019)
FIGURE 07.MODERATE BARGAINING POWER OF SUPPLIERS
FIGURE 08.MODERATE THREAT OF NEW ENTRANTS
FIGURE 09.HIGH THREAT OF SUBSTITUTES
FIGURE 10.MODERATE INTENSITY OF RIVALRY
FIGURE 11.MODERATE BARGAINING POWER OF BUYERS
FIGURE 12.TOP PLAYER POSITIONING, 2018
FIGURE 13.VIRTUAL POWER PLANT MARKET DYNAMICS
FIGURE 14.VIRTUAL POWER PLANT MARKET, BY TECHNOLOGY, 2019–2027 ($MILILION)
FIGURE 15.VIRTUAL POWER PLANT MARKET, BY END USER, 2019–2027 ($MILILION)
FIGURE 16.U.S. VIRTUAL POWER PLANT MARKET REVENUE, 2019–2027 ($MILLION)
FIGURE 17.CANADA VIRTUAL POWER PLANT MARKET REVENUE, 2019–2027 ($MILLION)
FIGURE 18.MEXICO VIRTUAL POWER PLANT MARKET REVENUE, 2019–2027 ($MILLION)
FIGURE 19.GERMANY VIRTUAL POWER PLANT MARKET REVENUE, 2019–2027 ($MILLION)
FIGURE 20.UK VIRTUAL POWER PLANT MARKET REVENUE, 2019–2027 ($MILLION)
FIGURE 21.FRANCE VIRTUAL POWER PLANT MARKET REVENUE, 2019–2027 ($MILLION)
FIGURE 22.ITALY VIRTUAL POWER PLANT MARKET REVENUE, 2019–2027 ($MILLION)
FIGURE 23.REST OF EUROPE VIRTUAL POWER PLANT MARKET REVENUE, 2019–2027 ($MILLION)
FIGURE 24.CHINA VIRTUAL POWER PLANT MARKET REVENUE, 2019–2027 ($MILLION)
FIGURE 25.JAPAN VIRTUAL POWER PLANT MARKET REVENUE, 2019–2027 ($MILLION)
FIGURE 26.INDIA VIRTUAL POWER PLANT MARKET REVENUE, 2019–2027 ($MILLION)
FIGURE 27.AUSTRALIA VIRTUAL POWER PLANT MARKET REVENUE, 2019–2027 ($MILLION)
FIGURE 28.REST OF ASIA-PACIFIC VIRTUAL POWER PLANT MARKET REVENUE, 2019–2027 ($MILLION)
FIGURE 29.BRAZIL VIRTUAL POWER PLANT MARKET REVENUE, 2019–2027 ($MILLION)
FIGURE 30.SAUDI ARABIA VIRTUAL POWER PLANT MARKET REVENUE, 2019–2027 ($MILLION)
FIGURE 31.SOUTH AFRICA VIRTUAL POWER PLANT MARKET REVENUE, 2019–2027 ($MILLION)
FIGURE 32.REST OF LAMEA VIRTUAL POWER PLANT MARKET REVENUE, 2019–2027 ($MILLION)
FIGURE 33.PRODUCT MAPPING OF TOP 10 PLAYERS
FIGURE 34.COMPETITIVE HEATMAP
$5540
$6654
$9280
HAVE A QUERY?
OUR CUSTOMER
