
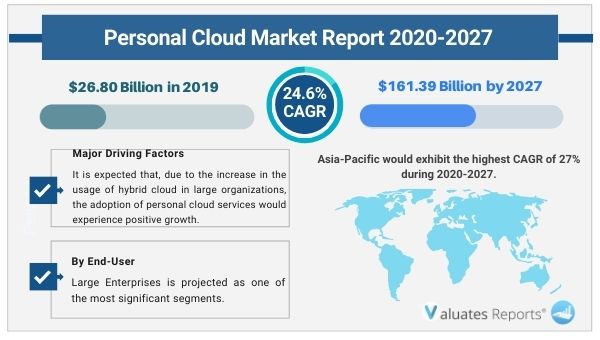
The personal cloud market size was valued at $26.80 billion in 2019 and is projected to reach $161.39 billion by 2027, growing at a CAGR of 24.6% from 2020 to 2027. Personal cloud services would facilitate file storage and share among the employees and enterprises who have adopted the BYOD trend. In this era of digitalization, there is an increasing need of storing and sharing personal or professional data. The rapidly increasing tech-savvy population has considerably led to the growing demand for cloud computing services in recent years. The increasing use of camera-equipped devices, such as smartphones and tablets, has created a huge demand for a secure platform to store digital content.
The key market players operating in the personal cloud market include Apple Inc., Google Inc., Microsoft Corporation, Amazon Web Services Inc., Dropbox Inc., Egnyte Inc., Copy (Barracuda Networks Inc.), SpiderOak, Box Inc., and Buffalo Inc.
Over the years, these market leaders have established themselves with continuous investment on product innovation, which has enabled them to improve the quality, capability, and performance. Further, these companies have expanded their market presence through strategic alliances and are working toward launching upgraded products in the market to gain maximum market share as well as to deliver better benefits to the stakeholders as an opportunistic factor in personal cloud market forecast.
Personal cloud is a cloud storage platform that enables the customers to access, synchronize, and share stored data across cloud and devices. Personal cloud services offer better storage, accessibility and sharing of user data along with enhanced security features. They have set up new standards for individuals to utilize the cloud computing services by offering better user experience and ease of use.
The increase in the number of social media sites and upsurge in smartphone and broadband connections have boosted the growth of personal cloud services which in turn drives the personal cloud market growth. The use of these services for storing photos, videos, contacts and other important files among individuals is the most dominant application as compared to other applications. The usage of multiple devices is expected to drive the rapid adoption of personal cloud solutions among individuals. In future, these services are expected to witness widespread demand among individual and business customers owing to the growing need for data storage platforms, leading to the increased adoption of personal cloud services and boosts the growth of personal cloud market.
Personal cloud services provide faster and convenient access to data, leading to its widespread popularity among the population. The growing concern of space limitation on gadgets to store digital content, photos, videos, images and documents among tech-savvy individuals has led to the increasing popularity of personal cloud services. Nevertheless, aggrandized generation of data is due to the increased use of smartphones, tablets and laptops. In addition, many businesses allow access and sharing of work-related data over their handheld devices to improve productivity. Thus, the need for faster and quick access to stored data is expected to trigger the demand for personal cloud services and propel the growth of the global personal cloud market.
Businesses across the world are facing concerns about their increasing IT expenditures. Bring-Your-Own-Device, a recent trend that is rapidly gaining acceptance in corporate sectors to minimize the expenditure incurred in setting up devices. In addition, personal cloud allowing companies to store the data at a centralized location and facilitates their employees to access it as per convenience. Several business organizations have adopted personal cloud services owing to the growing BYOD and mobile workforce trends.
The report focuses on the growth prospects, restraints, and market analysis. The study provides Porter’s five forces analysis of the personal cloud industry to understand the impact of various factors such as bargaining power of suppliers, competitive intensity of competitors, threat of new entrants, threat of substitutes, and bargaining power of buyers on the market.
The personal cloud market is segmented on the basis of revenue type, hosting type, end user, and region. By revenue type, it is categorized direct and indirect. By hosting type, it is categorized into service providers and consumers. Depending on end user, it is categorized into individuals and enterprises. Based on region, the market is analyzed across North America, Europe, Asia-Pacific, and LAMEA.
The use of these services for storing photos, videos, contacts and other important files among individuals is the most dominant application as compared to other applications. The usage of multiple devices is expected to drive the rapid adoption of personal cloud solutions among individuals which in turn is expected to boost the growth of the market. Further, the continuing efforts of personal cloud service providers to enhance the security of data is a personal cloud market opportunity. Especially, the small business groups would exhibit a rewarding growth rate owing to limited budgets.
Growing adoption of smartphones and tablets has boosted the usage of mobile devices at workplaces. The enterprises are also supporting the application of mobile devices in day-to-day work of their employees. The emerging trend of Bring-Your-Own-Device (BYOD) usage is getting acceptance among businesses across the world at a significant pace. In an effort to reduce the costs incurred in provision of these devices, organizations are now encouraging the adoption of the aforementioned trend which in turn is driving the growth of personal cloud market.
Personal cloud service value chain mainly consists of three entities viz. developers, cloud service providers and end consumers. The value chain for personal cloud market starts with application developers, developing applications for using the personal cloud services on computers, smartphones, tablets and other mobile handheld devices. Cloud service providers provide cloud-hosting services through their data centers to the customers known as provider hosting.
CHAPTER 1: INTRODUCTION
1.1. Report description
1.2. Key benefits for stakeholders
1.3. Key market segments
1.4. Key market players
1.5. Research methodology
1.5.1. Secondary research
1.5.2. Primary research
1.5.3. Analyst tools & models
CHAPTER 2: EXECUTIVE SUMMARY
2.1. Key findings
2.1.1. Top impacting factors
2.1.2. Top investment pockets
2.2. CXO perspective
CHAPTER 3: MARKET OVERVIEW
3.1. Market definition and scope
3.2. Key forces shaping the global personal cloud market
3.2.1. Moderate-to-high bargaining power of suppliers
3.2.2. Low-to-high bargaining power of buyer
3.2.3. Moderate-to-high threat of substitutes
3.2.4. Low-to-high threat of new entrants
3.2.5. Low-to-high competitive rivalry
3.3. Value chain analysis
3.4. Market dynamics
3.4.1. Drivers
3.4.1.1. Rise in demand for fast, and real time access to diversified data
3.4.1.2. Rise in need for disaster recovery
3.4.1.3. Growing BYOD and mobile workforce trends
3.4.2. Restraints
3.4.2.1. Data security and privacy issues
3.4.3. Opportunities
3.4.3.1. Bridging the connectivity and accessibility gap in developing economies
3.5. Impact of government regulations on the global personal cloud market
CHAPTER 4: PERSONAL CLOUD MARKET, BY REVENUE TYPE
4.1. Overview
4.2. Direct
4.2.1. Key market trends, growth factors, and opportunities
4.2.2. Market size and forecast, by region
4.2.3. Market analysis, by country
4.3. Indirect
4.3.1. Key market trends, growth factors, and opportunities
4.3.2. Market size and forecast, by region
4.3.3. Market analysis, by country
CHAPTER 5: PERSONAL CLOUD MARKET, BY HOSTINGTYPE
5.1. Overview
5.2. Service Provider
5.2.1. Key market trends, growth factors, and opportunities
5.2.2. Market size and forecast, by region
5.2.3. Market analysis, by country
5.3. Consumer
5.3.1. Key market trends, growth factors, and opportunities
5.3.2. Market size and forecast, by region
5.3.3. Market analysis, by country
CHAPTER 6: PERSONAL CLOUD MARKET, BY END USER
6.1. Overview
6.2. Individuals
6.2.1. Key market trends, growth factors, and opportunities
6.2.2. Market size and forecast, by region
6.2.3. Market analysis, by country
6.3. Enterprises
6.3.1. Key market trends, growth factors, and opportunities
6.3.2. Market size and forecast, by region
6.3.3. Market analysis, by country
CHAPTER 7: PERSONAL CLOUD MARKET, BY REGION
7.1. Overview
7.1.1. Market size and forecast, by region
7.2. North America
7.2.1. Key market trends, growth factors, and opportunities
7.2.2. Market size and forecast, by revenue type
7.2.3. Market size and forecast, by type of hosting
7.2.4. Market size and forecast, by end user
7.2.5. Market analysis, by country
7.2.5.1. U.S.
7.2.5.1.1. Market size and forecast, by revenue type
7.2.5.1.2. Market size and forecast, by type of hosting
7.2.5.1.3. Market size and forecast, by end user
7.2.5.2. CANADA
7.2.5.2.1. Market size and forecast, by revenue type
7.2.5.2.2. Market size and forecast, by type of hosting
7.2.5.2.3. Market size and forecast, by end user
7.3. Europe
7.3.1. Key market trends, growth factors, and opportunities
7.3.2. Market size and forecast, by revenue type
7.3.3. Market size and forecast, by type of hosting
7.3.4. Market size and forecast, by end user
7.3.5. Market analysis, by country
7.3.5.1. GERMANY
7.3.5.1.1. Market size and forecast, by revenue type
7.3.5.1.2. Market size and forecast, by type of hosting
7.3.5.1.3. Market size and forecast, by end user
7.3.5.2. FRANCE
7.3.5.2.1. Market size and forecast, by revenue type
7.3.5.2.2. Market size and forecast, by type of hosting
7.3.5.2.3. Market size and forecast, by end user
7.3.5.3. UK
7.3.5.3.1. Market size and forecast, by revenue type
7.3.5.3.2. Market size and forecast, by type of hosting
7.3.5.3.3. Market size and forecast, by end user
7.3.5.4. REST OF EUROPE
7.3.5.4.1. Market size and forecast, by revenue type
7.3.5.4.2. Market size and forecast, by type of hosting
7.3.5.4.3. Market size and forecast, by end user
7.4. Asia-Pacific
7.4.1. Key market trends, growth factors, and opportunities
7.4.2. Market size and forecast, by revenue type
7.4.3. Market size and forecast, by type of hosting
7.4.4. Market size and forecast, by end user
7.4.5. Market analysis, by country
7.4.5.1. JAPAN
7.4.5.1.1. Market size and forecast, by revenue type
7.4.5.1.2. Market size and forecast, by type of hosting
7.4.5.1.3. Market size and forecast, by end user
7.4.5.2. CHINA
7.4.5.2.1. Market size and forecast, by revenue type
7.4.5.2.2. Market size and forecast, by type of hosting
7.4.5.2.3. Market size and forecast, by end user
7.4.5.3. INDIA
7.4.5.3.1. Market size and forecast, by revenue type
7.4.5.3.2. Market size and forecast, by type of hosting
7.4.5.3.3. Market size and forecast, by end user
7.4.5.4. REST OF ASIA-PACIFIC
7.4.5.4.1. Market size and forecast, by revenue type
7.4.5.4.2. Market size and forecast, by type of hosting
7.4.5.4.3. Market size and forecast, by end user
7.5. LAMEA
7.5.1. Key market trends, growth factors, and opportunities
7.5.2. Market size and forecast, by revenue type
7.5.3. Market size and forecast, by type of hosting
7.5.4. Market size and forecast, by end user
7.5.5. Market analysis, by country
7.5.5.1. LATIN AMERICA
7.5.5.1.1. Market size and forecast, by revenue type
7.5.5.1.2. Market size and forecast, by type of hosting
7.5.5.1.3. Market size and forecast, by end user
7.5.5.2. MIDDLE EAST
7.5.5.2.1. Market size and forecast, by revenue type
7.5.5.2.2. Market size and forecast, by type of hosting
7.5.5.2.3. Market size and forecast, by end user
7.5.5.3. AFRICA
7.5.5.3.1. Market size and forecast, by revenue type
7.5.5.3.2. Market size and forecast, by type of hosting
7.5.5.3.3. Market size and forecast, by end user
CHAPTER 8: COMPETITIVE LANDSCAPE
8.1. Key players positioning analysis, 2019
8.2. Top winning strategies
8.3. Competitive dashboard
8.4. Key developments
8.4.1. Product launches
8.4.2. Partnership
8.4.3. Product development
8.4.4. Business expansion
8.4.5. Acquisition
8.4.6. Collaboration
8.5. Patent analysis
8.5.1. By region (2010-2019)
8.5.2. By applicant
8.6. Case studies
8.6.1. Kantara Initiative to provide CloudOS to the authorization party for its own personal cloud
8.6.2. Egnyte, Inc to provide personal cloud storage solutions for easy access to large files related to IKEA’s property and retail expansion unit
CHAPTER 9: COMPANY PROFILE
9.1. Amazon Web Services, Inc.
9.1.1. Company overview
9.1.2. Key Executives
9.1.3. Company snapshot
9.1.4. Operating business segments
9.1.5. Product portfolio
9.1.6. Business performance
9.1.7. Key strategic moves and developments
9.2. Apple Inc.
9.2.1. Company overview
9.2.2. Key Executives
9.2.3. Company snapshot
9.2.4. Product portfolio
9.2.5. R&D Expenditure
9.2.6. Business performance
9.2.7. Key strategic moves and developments
9.3. Box, Inc.
9.3.1. Company overview
9.3.2. Key Executives
9.3.3. Company snapshot
9.3.4. Product portfolio
9.3.5. R&D Expenditure
9.3.6. Business performance
9.4. Buffalo Inc.
9.4.1. Company overview
9.4.2. Key Executives
9.4.3. Company snapshot
9.4.4. Product portfolio
9.4.5. Key strategic moves and developments
9.5. Barracuda Networks, Inc.
9.5.1. Company overview
9.5.2. Key Executives
9.5.3. Company snapshot
9.5.4. Product portfolio
9.5.5. Key strategic moves and developments
9.6. Dropbox, Inc.
9.6.1. Company overview
9.6.2. Key Executives
9.6.3. Company snapshot
9.6.4. Product portfolio
9.6.5. R&D expenditure
9.6.6. Business performance
9.6.7. Key strategic moves and developments
9.7. Egnyte, Inc.
9.7.1. Company overview
9.7.2. Key Executives
9.7.3. Company snapshot
9.7.4. Product portfolio
9.7.5. Key strategic moves and developments
9.8. Google LLC
9.8.1. Company overview
9.8.2. Key Executives
9.8.3. Company snapshot
9.8.4. Product portfolio
9.8.5. R&D expenditure
9.8.6. Business performance
9.8.7. Key strategic moves and developments
9.9. Microsoft Corporation
9.9.1. Company overview
9.9.2. Key executives
9.9.3. Company snapshot
9.9.4. Operating business segments
9.9.5. Product portfolio
9.9.6. R&D expenditure
9.9.7. Business performance
9.9.8. Key strategic moves and developments
9.10. SpiderOak, Inc.
9.10.1. Company overview
9.10.2. Key executives
9.10.3. Company snapshot
9.10.4. Product portfolio
List Of Tables & Figures
Table 01. Global Personal Cloud Market, By Revenue Type, 2019–2027 ($Billion)
Table 02. Personal Cloud Market Revenue For Direct, By Region, 2019–2027 ($Billion)
Table 03. Personal Cloud Market Revenue For Indirect, By Region, 2019–2027 ($Billion)
Table 04. Global Personal Cloud Market, By Type Of Hosting, 2019–2027 ($Billion)
Table 05. Personal Cloud Market Revenue For Service Provider, By Region, 2019–2027 ($Billion)
Table 06. Personal Cloud Market Revenue For Consumer, By Region, 2019–2027 ($Billion)
Table 07. Global Personal Cloud Market Revenue, By End User, 2019–2027 ($Billion)
Table 08. Personal Cloud Market Revenue For Individuals, By Region 2019–2027 ($Billion)
Table 09. Personal Cloud Market Revenue For Enterprises, By Region, 2019–2027 ($Billion)
Table 10. Personal Cloud Market Revenue, By Region, 2019–2027 ($Billion)
Table 11. North America Personal Cloud Market Revenue, By Revenue Type 2019–2027 ($Billion)
Table 12. North America Personal Cloud Market Revenue, By Type Of Hosting 2019–2027 ($Billion)
Table 13. North America Personal Cloud Market Revenue, By End User, 2019–2027 ($Billion)
Table 14. North America Personal Cloud Market Revenue, By Country, 2019–2027 ($Billion)
Table 15. U.S. Personal Cloud Market Revenue, By Revenue Type 2019–2027 ($Billion)
Table 16. U.S. Personal Cloud Market Revenue, By Type Of Hosting 2019–2027 ($Billion)
Table 17. U.S. Personal Cloud Market Revenue, By End User, 2019–2027 ($Billion)
Table 18. Canada Personal Cloud Market Revenue, By Revenue Type 2019–2027 ($Billion)
Table 19. Canada Personal Cloud Market Revenue, By Type Of Hosting 2019–2027 ($Billion)
Table 20. Canada Personal Cloud Market Revenue, By End User, 2019–2027 ($Billion)
Table 21. Europe Personal Cloud Market Revenue, By Revenue Type 2019–2027 ($Billion)
Table 22. Europe Personal Cloud Market Revenue, By Type Of Hosting 2019–2027 ($Billion)
Table 23. Europe Personal Cloud Market Revenue, By End User, 2019–2027 ($Billion)
Table 24. Europe Personal Cloud Market Revenue, By Country, 2019–2027 ($Billion)
Table 25. Germany Personal Cloud Market Revenue, By Revenue Type 2019–2027 ($Billion)
Table 26. Germany Personal Cloud Market Revenue, By Type Of Hosting 2019–2027 ($Billion)
Table 27. Germany Personal Cloud Market Revenue, By End User, 2019–2027 ($Billion)
Table 28. France Personal Cloud Market Revenue, By Revenue Type 2019–2027 ($Billion)
Table 29. France Personal Cloud Market Revenue, By Type Of Hosting 2019–2027 ($Billion)
Table 30. France Personal Cloud Market Revenue, By End User, 2019–2027 ($Billion)
Table 31. Uk Personal Cloud Market Revenue, By Revenue Type 2019–2027 ($Billion)
Table 32. Uk Personal Cloud Market Revenue, By Type Of Hosting 2019–2027 ($Billion)
Table 33. Uk Personal Cloud Market Revenue, By End User, 2019–2027 ($Billion)
Table 34. Rest Of Europe Personal Cloud Market Revenue, By Revenue Type 2019–2027 ($Billion)
Table 35. Rest Of Europe Personal Cloud Market Revenue, By Type Of Hosting 2019–2027 ($Billion)
Table 36. Rest Of Europe Personal Cloud Market Revenue, By End User, 2019–2027 ($Billion)
Table 37. Asia-Pacific Personal Cloud Market Revenue, By Revenue Type 2019–2027 ($Billion)
Table 38. Asia-Pacific Personal Cloud Market Revenue, By Type Of Hosting 2019–2027 ($Billion)
Table 39. Asia-Pacific Personal Cloud Market Revenue, By End User, 2019–2027 ($Billion)
Table 40. Asia-Pacific Personal Cloud Market Revenue, By Country, 2019–2027 ($Billion)
Table 41. Japan Personal Cloud Market Revenue, By Revenue Type 2019–2027 ($Billion)
Table 42. Japan Personal Cloud Market Revenue, By Type Of Hosting 2019–2027 ($Billion)
Table 43. Japan Personal Cloud Market Revenue, By End User, 2019–2027 ($Billion)
Table 44. China Personal Cloud Market Revenue, By Revenue Type 2019–2027 ($Billion)
Table 45. China Personal Cloud Market Revenue, By Type Of Hosting 2019–2027 ($Billion)
Table 46. China Personal Cloud Market Revenue, By End User, 2019–2027 ($Billion)
Table 47. India Personal Cloud Market Revenue, By Revenue Type 2019–2027 ($Billion)
Table 48. India Personal Cloud Market Revenue, By Type Of Hosting 2019–2027 ($Billion)
Table 49. India Personal Cloud Market Revenue, By End User, 2019–2027 ($Billion)
Table 50. Rest Of Asia-Pacific Personal Cloud Market Revenue, By Revenue Type 2019–2027 ($Billion)
Table 51. Rest Of Asia-Pacific Personal Cloud Market Revenue, By Type Of Hosting 2019–2027 ($Billion)
Table 52. Rest Of Asia-Pacific Personal Cloud Market Revenue, By End User, 2019–2027 ($Billion)
Table 53. Lamea Personal Cloud Market Revenue, By Revenue Type 2019–2027 ($Billion)
Table 54. Lamea Personal Cloud Market Revenue, By Type Of Hosting 2019–2027 ($Billion)
Table 55. Lamea Personal Cloud Market Revenue, By End User, 2019–2027 ($Billion)
Table 56. Lamea Personal Cloud Market Revenue, By Country, 2019–2027 ($Billion)
Table 57. Latin America Personal Cloud Market Revenue, By Revenue Type 2019–2027 ($Billion)
Table 58. Latin America Personal Cloud Market Revenue, By Type Of Hosting 2019–2027 ($Billion)
Table 59. Latin America Personal Cloud Market Revenue, By End User, 2019–2027 ($Billion)
Table 60. Middle East Personal Cloud Market Revenue, By Revenue Type 2019–2027 ($Billion)
Table 61. Middle East Personal Cloud Market Revenue, By Type Of Hosting 2019–2027 ($Billion)
Table 62. Middle East Personal Cloud Market Revenue, By End User, 2019–2027 ($Billion)
Table 63. Africa Personal Cloud Market Revenue, By Revenue Type 2019–2027 ($Billion)
Table 64. Africa Personal Cloud Market Revenue, By Type Of Hosting 2019–2027 ($Billion)
Table 65. Africa Personal Cloud Market Revenue, By End User, 2019–2027 ($Billion)
Table 66. Key New Product Launches (2018-2020)
Table 67. Partnership (2018-2020)
Table 68. Product Development (2018-2020)
Table 69. Key Expansion (2018-2020)
Table 70. Key Acquisition (2018-2020)
Table 71. Key Collaboration (2018-2020)
Table 72. Amazon Web Services, Inc.: Key Executives
Table 73. Amazon Web Services, Inc.: Company Snapshot
Table 74. Amazon Web Services, Inc.: Operating Segments
Table 75. Amazon Web Services, Inc.: Product Portfolio
Table 76. Apple Inc.: Key Executives
Table 77. Apple Inc.: Company Snapshot
Table 78. Apple Inc.: Product Portfolio
Table 79. Box Inc.: Key Executives
Table 80. Box Inc.: Company Snapshot
Table 81. Box Inc.: Product Portfolio
Table 82. Buffalo Inc.: Key Executives
Table 83. Buffalo Inc.: Company Snapshot
Table 84. Buffalo Inc.: Product Portfolio
Table 85. Barracuda Networks, Inc.: Company Snapshot
Table 86. Barracuda Networks, Inc.: Product Portfolio
Table 87. Dropbox, Inc.: Key Executives
Table 88. Dropbox, Inc..: Company Snapshot
Table 89. Dropbox, Inc.: Product Portfolio
Table 90. Egnyte, Inc.: Key Executives
Table 91. Egnyte, Inc.: Company Snapshot
Table 92. Egnyte, Inc.: Product Portfolio
Table 93. Google Llc: Key Executives
Table 94. Google Inc.: Company Snapshot
Table 95. Google Llc: Product Portfolio
Table 96. Microsoft Corporation: Key Executives
Table 97. Microsoft Corporation: Company Snapshot
Table 98. Microsoft Corporation: Operating Segments
Table 99. Microsoft Corporation: Product Portfolio
Table 100. Spideroak, Inc.: Key Executives
Table 101. Spideroak, Inc.: Company Snapshot
Table 102. Spideroak, Inc.: Product Portfolio
List Of Figures
Figure 01. Key Market Segments
Figure 02. Global Personal Cloud Market, 2018–2026
Figure 03. Global Personal Cloud Market, By Region, 2018–2026
Figure 04. Top Impacting Factors
Figure 05. Top Investment Pockets
Figure 06. Top Players Of The Global Personal Cloud Market
Figure 07. Moderate-To-High Bargaining Power Of Suppliers
Figure 08. Low-To-High Bargaining Power Of Buyer
Figure 09. Moderate-To-High Threat Of Substitutes
Figure 10. Low-To-High Threat Of New Entrants
Figure 11. Low-To-High Competitive Rivalry
Figure 12. Value Chain Analysis Of Personal Cloud Market
Figure 13. Market Dynamics: Global Personal Cloud Market
Figure 14. Impact Of Government Regulations On The Global Personal Cloud Market
Figure 15. Global Personal Cloud Market Revenue, By Revenue Type, 2019–2027 ($Billion)
Figure 16. Comparative Share Analysis Of Global Personal Cloud Market For Direct, By Country, 2019 & 2027 (%)
Figure 17. Comparative Share Analysis Of Global Personal Cloud Market For Indirect, By Country, 2019 & 2027 (%)
Figure 18. Global Personal Cloud Market Revenue, By Type Of Hosting, 2019–2027 ($Billion)
Figure 19. Comparative Share Analysis Of Global Personal Cloud Market For Service Provider, By Country, 2019 & 2027 (%)
Figure 20. Comparative Share Analysis Of Global Personal Cloud Market For Consumer, By Country, 2019 & 2027 (%)
Figure 21. Global Personal Cloud Market, By End User, 2018–2026
Figure 22. Comparative Share Analysis Global Personal Cloud Market For Individuals, By Country, 2019 & 2027(%)
Figure 23. Comparative Share Analysis Of Global Personal Cloud Market For Enterprises, By Country, 2019 & 2027 (%)
Figure 24. Personal Cloud Market Revenue, By Region, 2019–2027 ($Billion)
Figure 25. U.S. Personal Cloud Market Revenue, 2019–2027 ($Billion)
Figure 26. Canada Personal Cloud Market Revenue, 2019–2027 ($Billion)
Figure 27. Germany Personal Cloud Market Revenue, 2019–2027 ($Billion)
Figure 28. France Personal Cloud Market Revenue, 2019–2027 ($Billion)
Figure 29. Uk Personal Cloud Market Revenue, 2019–2027 ($Billion)
Figure 30. Rest Of Europe Personal Cloud Market Revenue, 2019–2027 ($Billion)
Figure 31. Japan Personal Cloud Market Revenue, 2019–2027 ($Billion)
Figure 32. China Personal Cloud Market Revenue, 2019–2027 ($Billion)
Figure 33. India Personal Cloud Market Revenue, 2019–2027 ($Billion)
Figure 34. Rest Of Asia-Pacific Personal Cloud Market Revenue, 2019–2027 ($Billion)
Figure 35. Latin America Personal Cloud Market Revenue, 2019–2027 ($Billion)
Figure 36. Middle East Personal Cloud Market Revenue, 2019–2027 ($Billion)
Figure 37. Africa Personal Cloud Market Revenue, 2019–2027 ($Billion)
Figure 38. Key Player Positioning Anlysis: Global Personal Cloud Market
Figure 39. Top Winning Strategies, By Year, 2018-2020
Figure 40. Top Winning Strategies, By Development, 2018-2020
Figure 41. Top Winning Strategies, By Company, 2018-2020
Figure 42. Competitive Dashboard
Figure 43. Competitive Dashboard
Figure 44. Competitive Heatmap Of Key Players
Figure 45. Patent Analysis, By Region
Figure 46. Patent Analysis, By Applicant
Figure 47. Amazon.Com, Inc.: Revenue, 2016–2018 ($Billion)
Figure 48. Amazon Web Services, Inc.: Revenue Share By Segment, 2018 (%)
Figure 49. Amazon Web Services, Inc.: Revenue Share By Region, 2018 (%)
Figure 50. R&D Expenditure, 2016–2018 ($Billion)
Figure 51. Apple Inc.: Revenue, 2016–2018 ($Billion)
Figure 52. Apple Inc.: Revenue Share By Region, 2018 (%)
Figure 53. R&D Expenditure, 2016–2018 ($Billion)
Figure 54. Box Inc.: Revenue, 2016–2018 ($Billion)
Figure 55. Key Executives
Figure 56. R&D Expenditure, 2016–2018 ($Billion)
Figure 57. Dropbox, Inc..: Revenue, 2016–2018 ($Billion)
Figure 58. Dropbox, Inc..: Revenue Share By Region, 2018 (%)
Figure 59. R&D Expenditure, 2016–2018 ($Billion)
Figure 60. Alphabet Inc.: Revenue, 2016–2018 ($Billion)
Figure 61. Alphabet Inc.: Revenue Share By Region, 2018 (%)
Figure 62. R&D Expenditure, 2016–2018 ($Billion)
Figure 63. Microsoft Corporation: Revenue, 2016–2018 ($Billion)
Figure 64. Microsoft Corporation: Revenue Share By Segment, 2018 (%)
Figure 65. Microsoft Corporation: Revenue Share By Region, 2018 (%)
$5939
$6654
$9280
HAVE A QUERY?
OUR CUSTOMER
