0
U.S. (TOLL FREE)
+1 (315) 215-3225
Automative

0
U.S. (TOLL FREE)
+1 (315) 215-3225
Biopower Market By Feedstock (Solid Biofuel, Liquid Biofuel, Biogas), By Technology (Direct Combustion, Gasification, Anaerobic Digestion, Landfill Gas, Others), By End Use (Residential, Commercial, Industrial): Global Opportunity Analysis and Industry Forecast, 2021-2031
Published Date: August 2022
|
Report Code: ALLI-Auto-0R515
Home | Market Reports | Business & Industrial| Energy & Utilities| Renewable & Alternative Energy
Biopower Market By Feedstock Solid Biofuel Liquid Biofuel Biogas By Technology Direct Combustion Gasification Anaerobic Digestion Landfill Gas Others By End Use Residential Commercial Industrial Global Opportunity Analysis and Industry Forecast 2021 2031
BUY CHAPTERS

Biopower Market By Feedstock (Solid Biofuel, Liquid Biofuel, Biogas), By Technology (Direct Combustion, Gasification, Anaerobic Digestion, Landfill Gas, Others), By End Use (Residential, Commercial, Industrial): Global Opportunity Analysis and Industry Forecast, 2021-2031

Code: ALLI-Auto-0R515
Report
August 2022
Pages:338
Allied Market Research
Buy Now with 15% Discount
DESCRIPTION
TABLE OF CONTENT
TABLES & FIGURES

Biopowder Market 

The global biopower market was valued at $14.2 billion in 2021, and is projected to reach $26.3 billion by 2031, growing at a CAGR of 6.4% from 2022 to 2031. Biopower is the term for the energy that is extracted from biogas and several other biofuels. The construction of biogas and biofuel-producing facilities has been sparked by the ease with which resources are available around the world. The United States Environmental Protection Agency (USEPA) estimates that 25% of the nation's greenhouse gas emissions are made up of carbon dioxide from power production. Sustainable solutions, such as the utilization of biomass, are being studied to address the environmental issue.

Biopower Market

Trends Influencing the Growth of the Global Biopowder Market

The Biopower Market has been driven by a rise in the ability to produce renewable energy and the adoption of innovative technology to speed up the conversion of biomass. The need for eco-friendly and energy-efficient products has also significantly boosted market expansion. Methane and carbon dioxide makes up the majority of biogas, which is a component of biopower and is created through the anaerobic digestion process as well as the thermal processing of solid biofuel. Numerous uses for biomass energy exist, including power generation, heating, and cooking. 

The need for energy resources has been greatly impacted by the world's fast population growth. Future energy demands are expected to rise steadily, and the progressive depletion of traditional resources is one of the main drivers of the biopower market's expansion. The governments of the world have taken a number of steps toward clean energy and invested in ineffective waste management strategies that have led to correct waste disposal and opened doors to more abundant biogas resources, which has fueled the expansion of the biopower market globally.

Rapid modernization has raised the need for materials for a pleasant existence, which has increased the amount of garbage produced and increased the need for waste treatment facilities. Governments all around the world have made a number of steps to invest in waste management projects, increasing the amount of disposable waste. In order to meet the increased demand for energy, it has worked as a resource for biogas, opening up the lucrative potential for landfill gas expansion all over the world.

Biopower, including biogas, solid biofuels, and liquid biofuels, has several uses in residential services. Cooking gas is how it is most frequently utilized in rural areas. It is a component of the equipment used to heat water and rooms. Additionally, it can take the place of compressed natural gas when used as a generator fuel source. In small-scale combined heat and power facilities, it is utilized to power boilers. As alternative energy sources for the production of electricity through generators, biogas and biofuel are used. It is used to create hydrogen gas, which is employed in a variety of industries.

Biopowder Market Share

The market for worldwide biopower is dominated by the solid biofuel category. Solid biofuels can be used to generate electricity, heat homes, or cook food since they are made from non-fossil, organic materials including plant biomass, animal waste, and municipal garbage. Since humans first found fire, solid biofuel in the form of wood has been utilized for various purposes, including heating and cooking.

The global biopower market is dominated by the direct combustion sector. A thermochemical process called direct combustion involves burning biomass outside or with more air present. The biomass's chemical energy that was stored through photosynthetic means is transformed into gas during this phase. In comparison to other sophisticated biomass power technologies, combustion technology operates more cheaply and with a less complex operation.

The US, Canada, and Mexico are all included in the analysis of North America. The main players in this region are the United States and Canada. By 2031, the North American biopower market is anticipated to generate more than $10,6 billion in revenue. The United States government regulations, particularly following the suggestion of the current President Biden with various initiatives and actions, aim to produce three billion gallons of sustainable fuel, reduce aviation emissions by 20% by 2030, and support American agriculture & manufacturing while providing additional income to the farmers while aiding the government in addressing the climate crisis.

By Feedstock

  • Solid Biofuel
  • Liquid Biofuel
  • Biogas

By Technology

  • Direct Combustion
  • Gasification
  • Anaerobic Digestion
  • Landfill Gas
  • Application
  • Electricity
  • Direct Use
  • Combined Heat and Power
  • Alternate Fuels
  • Others

By End Use

  • Residential
  • Commercial
  • Industrial

By Region

  • North America
  • US.
  • Canada
  • Mexico
  • Europe
  • Germany
  • France
  • Italy
  • Spain
  • UK
  • Rest Of Europe
  • Asia-Pacific
  • China
  • Japan
  • India
  • South Korea
  • Rest Of Asia-Pacific
  • LAMEA
  • Brazil
  • Turkey
  • South Africa
  • Rest Of LAMEA

Key Market Players

  • Dalkia
  • EnviTec Biogas AG
  • Schmack Biogas GmbH
  • Weltec Biopower GmbH
  • Orsted A/S
  • ElectraTherm
  • Babcock & Wilcox Enterprises Inc.
  • Ameresco
  • MVV Energie AG
  • Enerkem
  • Drax Group
  • Sodra
  • Helius Energy Plc
  • Alstom SA
  • Vattenfall AB
  • Veolia
  • Suez
  • Ramboll Group A/S
  • General Electric
  • Mitsubishi Heavy Industries Ltd

Scope of Biopower Market Report

Report Metric Details
Report Name Biopower Market
The market size in 2021 $14.2 billion
The revenue forecast in 2031 $26.3 billion
Growth Rate CAGR 6.4%
Market size available for years 2020-2030
Forecast units Value (USD)
Segments covered Type, Application, Industry, Regions
Report coverage Revenue & volume forecast, company share, competitive landscape, growth factors, and trends
Geographic regions covered North America, Europe, Asia Pacific, Latin America, Middle East & Africa
CHAPTER 1:INTRODUCTION
1.1.Report description
1.2.Key market segments
1.3.Key benefits to the stakeholders
1.4.Research Methodology
1.4.1.Secondary research
1.4.2.Primary research
1.4.3.Analyst tools and models
CHAPTER 2:EXECUTIVE SUMMARY
2.1.Key findings of the study
2.2.CXO Perspective
CHAPTER 3:MARKET OVERVIEW
3.1.Market definition and scope
3.2.Key findings
3.2.1.Top investment pockets
3.3.Porter’s five forces analysis
3.4.Top player positioning
3.5.Market dynamics
3.5.1.Drivers
3.5.2.Restraints
3.5.3.Opportunities
3.6.COVID-19 Impact Analysis on the market
3.7.Value Chain Analysis
3.8.Key Regulation Analysis
CHAPTER 4: BIOPOWER MARKET, BY FEEDSTOCK
4.1 Overview
4.1.1 Market size and forecast
4.2 Solid Biofuel
4.2.1 Key market trends, growth factors and opportunities
4.2.2 Market size and forecast, by region
4.2.3 Market analysis by country
4.3 Liquid Biofuel
4.3.1 Key market trends, growth factors and opportunities
4.3.2 Market size and forecast, by region
4.3.3 Market analysis by country
4.4 Biogas
4.4.1 Key market trends, growth factors and opportunities
4.4.2 Market size and forecast, by region
4.4.3 Market analysis by country
CHAPTER 5: BIOPOWER MARKET, BY TECHNOLOGY
5.1 Overview
5.1.1 Market size and forecast
5.2 Direct Combustion
5.2.1 Key market trends, growth factors and opportunities
5.2.2 Market size and forecast, by region
5.2.3 Market analysis by country
5.3 Gasification
5.3.1 Key market trends, growth factors and opportunities
5.3.2 Market size and forecast, by region
5.3.3 Market analysis by country
5.4 Anaerobic Digestion
5.4.1 Key market trends, growth factors and opportunities
5.4.2 Market size and forecast, by region
5.4.3 Market analysis by country
5.5 Landfill Gas
5.5.1 Key market trends, growth factors and opportunities
5.5.2 Market size and forecast, by region
5.5.3 Market analysis by country
5.5.4 Landfill Gas Biopower Market by Application
5.5.4.1 Electricity Market size and forecast, by region
5.5.4.2 Electricity Market size and forecast, by country
5.5.4.3 Direct Use Market size and forecast, by region
5.5.4.4 Direct Use Market size and forecast, by country
5.5.4.5 Combined Heat and Power Market size and forecast, by region
5.5.4.6 Combined Heat and Power Market size and forecast, by country
5.5.4.7 Alternate Fuels Market size and forecast, by region
5.5.4.8 Alternate Fuels Market size and forecast, by country
5.6 Others
5.6.1 Key market trends, growth factors and opportunities
5.6.2 Market size and forecast, by region
5.6.3 Market analysis by country
CHAPTER 6: BIOPOWER MARKET, BY END USE
6.1 Overview
6.1.1 Market size and forecast
6.2 Residential
6.2.1 Key market trends, growth factors and opportunities
6.2.2 Market size and forecast, by region
6.2.3 Market analysis by country
6.3 Commercial
6.3.1 Key market trends, growth factors and opportunities
6.3.2 Market size and forecast, by region
6.3.3 Market analysis by country
6.4 Industrial
6.4.1 Key market trends, growth factors and opportunities
6.4.2 Market size and forecast, by region
6.4.3 Market analysis by country
CHAPTER 7: BIOPOWER MARKET, BY REGION
7.1 Overview
7.1.1 Market size and forecast
7.2 North America
7.2.1 Key trends and opportunities
7.2.2 North America Market size and forecast, by Feedstock
7.2.3 North America Market size and forecast, by Technology
7.2.3.1 North America Landfill Gas Biopower Market by Application
7.2.4 North America Market size and forecast, by End Use
7.2.5 North America Market size and forecast, by country
7.2.5.1 U.S.
7.2.5.1.1 Market size and forecast, by Feedstock
7.2.5.1.2 Market size and forecast, by Technology
7.2.5.1.2.1 U.S. Landfill Gas Biopower Market by Application
7.2.5.1.3 Market size and forecast, by End Use
7.2.5.2 Canada
7.2.5.2.1 Market size and forecast, by Feedstock
7.2.5.2.2 Market size and forecast, by Technology
7.2.5.2.2.1 Canada Landfill Gas Biopower Market by Application
7.2.5.2.3 Market size and forecast, by End Use
7.2.5.3 Mexico
7.2.5.3.1 Market size and forecast, by Feedstock
7.2.5.3.2 Market size and forecast, by Technology
7.2.5.3.2.1 Mexico Landfill Gas Biopower Market by Application
7.2.5.3.3 Market size and forecast, by End Use
7.3 Europe
7.3.1 Key trends and opportunities
7.3.2 Europe Market size and forecast, by Feedstock
7.3.3 Europe Market size and forecast, by Technology
7.3.3.1 Europe Landfill Gas Biopower Market by Application
7.3.4 Europe Market size and forecast, by End Use
7.3.5 Europe Market size and forecast, by country
7.3.5.1 Germany
7.3.5.1.1 Market size and forecast, by Feedstock
7.3.5.1.2 Market size and forecast, by Technology
7.3.5.1.2.1 Germany Landfill Gas Biopower Market by Application
7.3.5.1.3 Market size and forecast, by End Use
7.3.5.2 France
7.3.5.2.1 Market size and forecast, by Feedstock
7.3.5.2.2 Market size and forecast, by Technology
7.3.5.2.2.1 France Landfill Gas Biopower Market by Application
7.3.5.2.3 Market size and forecast, by End Use
7.3.5.3 Italy
7.3.5.3.1 Market size and forecast, by Feedstock
7.3.5.3.2 Market size and forecast, by Technology
7.3.5.3.2.1 Italy Landfill Gas Biopower Market by Application
7.3.5.3.3 Market size and forecast, by End Use
7.3.5.4 Spain
7.3.5.4.1 Market size and forecast, by Feedstock
7.3.5.4.2 Market size and forecast, by Technology
7.3.5.4.2.1 Spain Landfill Gas Biopower Market by Application
7.3.5.4.3 Market size and forecast, by End Use
7.3.5.5 UK
7.3.5.5.1 Market size and forecast, by Feedstock
7.3.5.5.2 Market size and forecast, by Technology
7.3.5.5.2.1 UK Landfill Gas Biopower Market by Application
7.3.5.5.3 Market size and forecast, by End Use
7.3.5.6 Rest of Europe
7.3.5.6.1 Market size and forecast, by Feedstock
7.3.5.6.2 Market size and forecast, by Technology
7.3.5.6.2.1 Rest of Europe Landfill Gas Biopower Market by Application
7.3.5.6.3 Market size and forecast, by End Use
7.4 Asia-Pacific
7.4.1 Key trends and opportunities
7.4.2 Asia-Pacific Market size and forecast, by Feedstock
7.4.3 Asia-Pacific Market size and forecast, by Technology
7.4.3.1 Asia-Pacific Landfill Gas Biopower Market by Application
7.4.4 Asia-Pacific Market size and forecast, by End Use
7.4.5 Asia-Pacific Market size and forecast, by country
7.4.5.1 China
7.4.5.1.1 Market size and forecast, by Feedstock
7.4.5.1.2 Market size and forecast, by Technology
7.4.5.1.2.1 China Landfill Gas Biopower Market by Application
7.4.5.1.3 Market size and forecast, by End Use
7.4.5.2 Japan
7.4.5.2.1 Market size and forecast, by Feedstock
7.4.5.2.2 Market size and forecast, by Technology
7.4.5.2.2.1 Japan Landfill Gas Biopower Market by Application
7.4.5.2.3 Market size and forecast, by End Use
7.4.5.3 India
7.4.5.3.1 Market size and forecast, by Feedstock
7.4.5.3.2 Market size and forecast, by Technology
7.4.5.3.2.1 India Landfill Gas Biopower Market by Application
7.4.5.3.3 Market size and forecast, by End Use
7.4.5.4 South Korea
7.4.5.4.1 Market size and forecast, by Feedstock
7.4.5.4.2 Market size and forecast, by Technology
7.4.5.4.2.1 South Korea Landfill Gas Biopower Market by Application
7.4.5.4.3 Market size and forecast, by End Use
7.4.5.5 Rest of Asia-Pacific
7.4.5.5.1 Market size and forecast, by Feedstock
7.4.5.5.2 Market size and forecast, by Technology
7.4.5.5.2.1 Rest of Asia-Pacific Landfill Gas Biopower Market by Application
7.4.5.5.3 Market size and forecast, by End Use
7.5 LAMEA
7.5.1 Key trends and opportunities
7.5.2 LAMEA Market size and forecast, by Feedstock
7.5.3 LAMEA Market size and forecast, by Technology
7.5.3.1 LAMEA Landfill Gas Biopower Market by Application
7.5.4 LAMEA Market size and forecast, by End Use
7.5.5 LAMEA Market size and forecast, by country
7.5.5.1 Brazil
7.5.5.1.1 Market size and forecast, by Feedstock
7.5.5.1.2 Market size and forecast, by Technology
7.5.5.1.2.1 Brazil Landfill Gas Biopower Market by Application
7.5.5.1.3 Market size and forecast, by End Use
7.5.5.2 Turkey
7.5.5.2.1 Market size and forecast, by Feedstock
7.5.5.2.2 Market size and forecast, by Technology
7.5.5.2.2.1 Turkey Landfill Gas Biopower Market by Application
7.5.5.2.3 Market size and forecast, by End Use
7.5.5.3 South Africa
7.5.5.3.1 Market size and forecast, by Feedstock
7.5.5.3.2 Market size and forecast, by Technology
7.5.5.3.2.1 South Africa Landfill Gas Biopower Market by Application
7.5.5.3.3 Market size and forecast, by End Use
7.5.5.4 Rest of LAMEA
7.5.5.4.1 Market size and forecast, by Feedstock
7.5.5.4.2 Market size and forecast, by Technology
7.5.5.4.2.1 Rest of LAMEA Landfill Gas Biopower Market by Application
7.5.5.4.3 Market size and forecast, by End Use
CHAPTER 8: COMPANY LANDSCAPE
8.1. Introduction
8.2. Top winning strategies
8.3. Product Mapping of Top 10 Player
8.4. Competitive Dashboard
8.5. Competitive Heatmap
8.6. Key developments
CHAPTER 9: COMPANY PROFILES
9.1 Dalkia
9.1.1 Company overview
9.1.2 Company snapshot
9.1.3 Operating business segments
9.1.4 Product portfolio
9.1.5 Business performance
9.1.6 Key strategic moves and developments
9.2 EnviTec Biogas AG
9.2.1 Company overview
9.2.2 Company snapshot
9.2.3 Operating business segments
9.2.4 Product portfolio
9.2.5 Business performance
9.2.6 Key strategic moves and developments
9.3 Schmack Biogas GmbH
9.3.1 Company overview
9.3.2 Company snapshot
9.3.3 Operating business segments
9.3.4 Product portfolio
9.3.5 Business performance
9.3.6 Key strategic moves and developments
9.4 Weltec Biopower GmbH
9.4.1 Company overview
9.4.2 Company snapshot
9.4.3 Operating business segments
9.4.4 Product portfolio
9.4.5 Business performance
9.4.6 Key strategic moves and developments
9.5 Orsted A/S
9.5.1 Company overview
9.5.2 Company snapshot
9.5.3 Operating business segments
9.5.4 Product portfolio
9.5.5 Business performance
9.5.6 Key strategic moves and developments
9.6 ElectraTherm
9.6.1 Company overview
9.6.2 Company snapshot
9.6.3 Operating business segments
9.6.4 Product portfolio
9.6.5 Business performance
9.6.6 Key strategic moves and developments
9.7 Babcock & Wilcox Enterprises Inc.
9.7.1 Company overview
9.7.2 Company snapshot
9.7.3 Operating business segments
9.7.4 Product portfolio
9.7.5 Business performance
9.7.6 Key strategic moves and developments
9.8 Ameresco
9.8.1 Company overview
9.8.2 Company snapshot
9.8.3 Operating business segments
9.8.4 Product portfolio
9.8.5 Business performance
9.8.6 Key strategic moves and developments
9.9 MVV Energie AG
9.9.1 Company overview
9.9.2 Company snapshot
9.9.3 Operating business segments
9.9.4 Product portfolio
9.9.5 Business performance
9.9.6 Key strategic moves and developments
9.10 Enerkem
9.10.1 Company overview
9.10.2 Company snapshot
9.10.3 Operating business segments
9.10.4 Product portfolio
9.10.5 Business performance
9.10.6 Key strategic moves and developments
9.11 Drax Group
9.11.1 Company overview
9.11.2 Company snapshot
9.11.3 Operating business segments
9.11.4 Product portfolio
9.11.5 Business performance
9.11.6 Key strategic moves and developments
9.12 Sodra
9.12.1 Company overview
9.12.2 Company snapshot
9.12.3 Operating business segments
9.12.4 Product portfolio
9.12.5 Business performance
9.12.6 Key strategic moves and developments
9.13 Helius Energy Plc
9.13.1 Company overview
9.13.2 Company snapshot
9.13.3 Operating business segments
9.13.4 Product portfolio
9.13.5 Business performance
9.13.6 Key strategic moves and developments
9.14 Alstom SA
9.14.1 Company overview
9.14.2 Company snapshot
9.14.3 Operating business segments
9.14.4 Product portfolio
9.14.5 Business performance
9.14.6 Key strategic moves and developments
9.15 Vattenfall AB
9.15.1 Company overview
9.15.2 Company snapshot
9.15.3 Operating business segments
9.15.4 Product portfolio
9.15.5 Business performance
9.15.6 Key strategic moves and developments
9.16 Veolia
9.16.1 Company overview
9.16.2 Company snapshot
9.16.3 Operating business segments
9.16.4 Product portfolio
9.16.5 Business performance
9.16.6 Key strategic moves and developments
9.17 Suez
9.17.1 Company overview
9.17.2 Company snapshot
9.17.3 Operating business segments
9.17.4 Product portfolio
9.17.5 Business performance
9.17.6 Key strategic moves and developments
9.18 Ramboll Group A/S
9.18.1 Company overview
9.18.2 Company snapshot
9.18.3 Operating business segments
9.18.4 Product portfolio
9.18.5 Business performance
9.18.6 Key strategic moves and developments
9.19 General Electric
9.19.1 Company overview
9.19.2 Company snapshot
9.19.3 Operating business segments
9.19.4 Product portfolio
9.19.5 Business performance
9.19.6 Key strategic moves and developments
9.20 Mitsubishi Heavy Industries Ltd.
9.20.1 Company overview
9.20.2 Company snapshot
9.20.3 Operating business segments
9.20.4 Product portfolio
9.20.5 Business performance
9.20.6 Key strategic moves and development
LIST OF TABLES
TABLE 1. GLOBAL BIOPOWER MARKET, BY FEEDSTOCK, 2021-2031 ($MILLION)
TABLE 2. BIOPOWER MARKET, FOR SOLID BIOFUEL, BY REGION, 2021-2031 ($MILLION)
TABLE 3. BIOPOWER MARKET FOR SOLID BIOFUEL, BY COUNTRY, 2021-2031 ($MILLION)
TABLE 4. BIOPOWER MARKET, FOR LIQUID BIOFUEL, BY REGION, 2021-2031 ($MILLION)
TABLE 5. BIOPOWER MARKET FOR LIQUID BIOFUEL, BY COUNTRY, 2021-2031 ($MILLION)
TABLE 6. BIOPOWER MARKET, FOR BIOGAS, BY REGION, 2021-2031 ($MILLION)
TABLE 7. BIOPOWER MARKET FOR BIOGAS, BY COUNTRY, 2021-2031 ($MILLION)
TABLE 8. GLOBAL BIOPOWER MARKET, BY TECHNOLOGY, 2021-2031 ($MILLION)
TABLE 9. BIOPOWER MARKET, FOR DIRECT COMBUSTION, BY REGION, 2021-2031 ($MILLION)
TABLE 10. BIOPOWER MARKET FOR DIRECT COMBUSTION, BY COUNTRY, 2021-2031 ($MILLION)
TABLE 11. BIOPOWER MARKET, FOR GASIFICATION, BY REGION, 2021-2031 ($MILLION)
TABLE 12. BIOPOWER MARKET FOR GASIFICATION, BY COUNTRY, 2021-2031 ($MILLION)
TABLE 13. BIOPOWER MARKET, FOR ANAEROBIC DIGESTION, BY REGION, 2021-2031 ($MILLION)
TABLE 14. BIOPOWER MARKET FOR ANAEROBIC DIGESTION, BY COUNTRY, 2021-2031 ($MILLION)
TABLE 15. BIOPOWER MARKET, FOR LANDFILL GAS, BY REGION, 2021-2031 ($MILLION)
TABLE 16. BIOPOWER MARKET FOR LANDFILL GAS, BY COUNTRY, 2021-2031 ($MILLION)
TABLE 17. GLOBAL LANDFILL GAS BIOPOWER MARKET, BY APPLICATION, 2021-2031 ($MILLION)
TABLE 18. BIOPOWER MARKET, FOR ELECTRICITY, BY REGION, 2021-2031 ($MILLION)
TABLE 19. BIOPOWER MARKET, FOR ELECTRICITY, BY COUNTRY, 2021-2031 ($MILLION)
TABLE 20. BIOPOWER MARKET, FOR DIRECT USE, BY REGION, 2021-2031 ($MILLION)
TABLE 21. BIOPOWER MARKET, FOR DIRECT USE, BY COUNTRY, 2021-2031 ($MILLION)
TABLE 22. BIOPOWER MARKET, FOR COMBINED HEAT AND POWER, BY REGION, 2021-2031 ($MILLION)
TABLE 23. BIOPOWER MARKET, FOR COMBINED HEAT AND POWER, BY COUNTRY, 2021-2031 ($MILLION)
TABLE 24. BIOPOWER MARKET, FOR ALTERNATE FUELS, BY REGION, 2021-2031 ($MILLION)
TABLE 25. BIOPOWER MARKET, FOR ALTERNATE FUELS, BY COUNTRY, 2021-2031 ($MILLION)
TABLE 26. BIOPOWER MARKET, FOR OTHERS, BY REGION, 2021-2031 ($MILLION)
TABLE 27. BIOPOWER MARKET FOR OTHERS, BY COUNTRY, 2021-2031 ($MILLION)
TABLE 28. GLOBAL BIOPOWER MARKET, BY END USE, 2021-2031 ($MILLION)
TABLE 29. BIOPOWER MARKET, FOR RESIDENTIAL, BY REGION, 2021-2031 ($MILLION)
TABLE 30. BIOPOWER MARKET FOR RESIDENTIAL, BY COUNTRY, 2021-2031 ($MILLION)
TABLE 31. BIOPOWER MARKET, FOR COMMERCIAL, BY REGION, 2021-2031 ($MILLION)
TABLE 32. BIOPOWER MARKET FOR COMMERCIAL, BY COUNTRY, 2021-2031 ($MILLION)
TABLE 33. BIOPOWER MARKET, FOR INDUSTRIAL, BY REGION, 2021-2031 ($MILLION)
TABLE 34. BIOPOWER MARKET FOR INDUSTRIAL, BY COUNTRY, 2021-2031 ($MILLION)
TABLE 35. BIOPOWER MARKET, BY REGION, 2021-2031 ($MILLION)
TABLE 36. NORTH AMERICA BIOPOWER MARKET, BY FEEDSTOCK, 2021-2031 ($MILLION)
TABLE 37. NORTH AMERICA BIOPOWER MARKET, BY TECHNOLOGY, 2021-2031 ($MILLION)
TABLE 38. NORTH AMERICA LANDFILL GAS BIOPOWER MARKET, BY APPLICATION, 2021-2031 ($MILLION)
TABLE 39. NORTH AMERICA BIOPOWER MARKET, BY END USE, 2021-2031 ($MILLION)
TABLE 40. NORTH AMERICA BIOPOWER MARKET, BY COUNTRY, 2021-2031 ($MILLION)
TABLE 41. U.S. BIOPOWER MARKET, BY FEEDSTOCK, 2021-2031 ($MILLION)
TABLE 42. U.S. BIOPOWER MARKET, BY TECHNOLOGY, 2021-2031 ($MILLION)
TABLE 43. U.S. LANDFILL GAS BIOPOWER MARKET, BY APPLICATION, 2021-2031 ($MILLION)
TABLE 44. U.S. BIOPOWER MARKET, BY END USE, 2021-2031 ($MILLION)
TABLE 45. CANADA BIOPOWER MARKET, BY FEEDSTOCK, 2021-2031 ($MILLION)
TABLE 46. CANADA BIOPOWER MARKET, BY TECHNOLOGY, 2021-2031 ($MILLION)
TABLE 47. CANADA LANDFILL GAS BIOPOWER MARKET, BY APPLICATION, 2021-2031 ($MILLION)
TABLE 48. CANADA BIOPOWER MARKET, BY END USE, 2021-2031 ($MILLION)
TABLE 49. MEXICO BIOPOWER MARKET, BY FEEDSTOCK, 2021-2031 ($MILLION)
TABLE 50. MEXICO BIOPOWER MARKET, BY TECHNOLOGY, 2021-2031 ($MILLION)
TABLE 51. MEXICO LANDFILL GAS BIOPOWER MARKET, BY APPLICATION, 2021-2031 ($MILLION)
TABLE 52. MEXICO BIOPOWER MARKET, BY END USE, 2021-2031 ($MILLION)
TABLE 53. EUROPE BIOPOWER MARKET, BY FEEDSTOCK, 2021-2031 ($MILLION)
TABLE 54. EUROPE BIOPOWER MARKET, BY TECHNOLOGY, 2021-2031 ($MILLION)
TABLE 55. EUROPE LANDFILL GAS BIOPOWER MARKET, BY APPLICATION, 2021-2031 ($MILLION)
TABLE 56. EUROPE BIOPOWER MARKET, BY END USE, 2021-2031 ($MILLION)
TABLE 57. EUROPE BIOPOWER MARKET, BY COUNTRY, 2021-2031 ($MILLION)
TABLE 58. GERMANY BIOPOWER MARKET, BY FEEDSTOCK, 2021-2031 ($MILLION)
TABLE 59. GERMANY BIOPOWER MARKET, BY TECHNOLOGY, 2021-2031 ($MILLION)
TABLE 60. GERMANY LANDFILL GAS BIOPOWER MARKET, BY APPLICATION, 2021-2031 ($MILLION)
TABLE 61. GERMANY BIOPOWER MARKET, BY END USE, 2021-2031 ($MILLION)
TABLE 62. FRANCE BIOPOWER MARKET, BY FEEDSTOCK, 2021-2031 ($MILLION)
TABLE 63. FRANCE BIOPOWER MARKET, BY TECHNOLOGY, 2021-2031 ($MILLION)
TABLE 64. FRANCE LANDFILL GAS BIOPOWER MARKET, BY APPLICATION, 2021-2031 ($MILLION)
TABLE 65. FRANCE BIOPOWER MARKET, BY END USE, 2021-2031 ($MILLION)
TABLE 66. ITALY BIOPOWER MARKET, BY FEEDSTOCK, 2021-2031 ($MILLION)
TABLE 67. ITALY BIOPOWER MARKET, BY TECHNOLOGY, 2021-2031 ($MILLION)
TABLE 68. ITALY LANDFILL GAS BIOPOWER MARKET, BY APPLICATION, 2021-2031 ($MILLION)
TABLE 69. ITALY BIOPOWER MARKET, BY END USE, 2021-2031 ($MILLION)
TABLE 70. SPAIN BIOPOWER MARKET, BY FEEDSTOCK, 2021-2031 ($MILLION)
TABLE 71. SPAIN BIOPOWER MARKET, BY TECHNOLOGY, 2021-2031 ($MILLION)
TABLE 72. SPAIN LANDFILL GAS BIOPOWER MARKET, BY APPLICATION, 2021-2031 ($MILLION)
TABLE 73. SPAIN BIOPOWER MARKET, BY END USE, 2021-2031 ($MILLION)
TABLE 74. UK BIOPOWER MARKET, BY FEEDSTOCK, 2021-2031 ($MILLION)
TABLE 75. UK BIOPOWER MARKET, BY TECHNOLOGY, 2021-2031 ($MILLION)
TABLE 76. UK LANDFILL GAS BIOPOWER MARKET, BY APPLICATION, 2021-2031 ($MILLION)
TABLE 77. UK BIOPOWER MARKET, BY END USE, 2021-2031 ($MILLION)
TABLE 78. REST OF EUROPE BIOPOWER MARKET, BY FEEDSTOCK, 2021-2031 ($MILLION)
TABLE 79. REST OF EUROPE BIOPOWER MARKET, BY TECHNOLOGY, 2021-2031 ($MILLION)
TABLE 80. REST OF EUROPE LANDFILL GAS BIOPOWER MARKET, BY APPLICATION, 2021-2031 ($MILLION)
TABLE 81. REST OF EUROPE BIOPOWER MARKET, BY END USE, 2021-2031 ($MILLION)
TABLE 82. ASIA-PACIFIC BIOPOWER MARKET, BY FEEDSTOCK, 2021-2031 ($MILLION)
TABLE 83. ASIA-PACIFIC BIOPOWER MARKET, BY TECHNOLOGY, 2021-2031 ($MILLION)
TABLE 84. ASIA-PACIFIC LANDFILL GAS BIOPOWER MARKET, BY APPLICATION, 2021-2031 ($MILLION)
TABLE 85. ASIA-PACIFIC BIOPOWER MARKET, BY END USE, 2021-2031 ($MILLION)
TABLE 86. ASIA-PACIFIC BIOPOWER MARKET, BY COUNTRY, 2021-2031 ($MILLION)
TABLE 87. CHINA BIOPOWER MARKET, BY FEEDSTOCK, 2021-2031 ($MILLION)
TABLE 88. CHINA BIOPOWER MARKET, BY TECHNOLOGY, 2021-2031 ($MILLION)
TABLE 89. CHINA LANDFILL GAS BIOPOWER MARKET, BY APPLICATION, 2021-2031 ($MILLION)
TABLE 90. CHINA BIOPOWER MARKET, BY END USE, 2021-2031 ($MILLION)
TABLE 91. JAPAN BIOPOWER MARKET, BY FEEDSTOCK, 2021-2031 ($MILLION)
TABLE 92. JAPAN BIOPOWER MARKET, BY TECHNOLOGY, 2021-2031 ($MILLION)
TABLE 93. JAPAN LANDFILL GAS BIOPOWER MARKET, BY APPLICATION, 2021-2031 ($MILLION)
TABLE 94. JAPAN BIOPOWER MARKET, BY END USE, 2021-2031 ($MILLION)
TABLE 95. INDIA BIOPOWER MARKET, BY FEEDSTOCK, 2021-2031 ($MILLION)
TABLE 96. INDIA BIOPOWER MARKET, BY TECHNOLOGY, 2021-2031 ($MILLION)
TABLE 97. INDIA LANDFILL GAS BIOPOWER MARKET, BY APPLICATION, 2021-2031 ($MILLION)
TABLE 98. INDIA BIOPOWER MARKET, BY END USE, 2021-2031 ($MILLION)
TABLE 99. SOUTH KOREA BIOPOWER MARKET, BY FEEDSTOCK, 2021-2031 ($MILLION)
TABLE 100. SOUTH KOREA BIOPOWER MARKET, BY TECHNOLOGY, 2021-2031 ($MILLION)
TABLE 101. SOUTH KOREA LANDFILL GAS BIOPOWER MARKET, BY APPLICATION, 2021-2031 ($MILLION)
TABLE 102. SOUTH KOREA BIOPOWER MARKET, BY END USE, 2021-2031 ($MILLION)
TABLE 103. REST OF ASIA-PACIFIC BIOPOWER MARKET, BY FEEDSTOCK, 2021-2031 ($MILLION)
TABLE 104. REST OF ASIA-PACIFIC BIOPOWER MARKET, BY TECHNOLOGY, 2021-2031 ($MILLION)
TABLE 105. REST OF ASIA-PACIFIC LANDFILL GAS BIOPOWER MARKET, BY APPLICATION, 2021-2031 ($MILLION)
TABLE 106. REST OF ASIA-PACIFIC BIOPOWER MARKET, BY END USE, 2021-2031 ($MILLION)
TABLE 107. LAMEA BIOPOWER MARKET, BY FEEDSTOCK, 2021-2031 ($MILLION)
TABLE 108. LAMEA BIOPOWER MARKET, BY TECHNOLOGY, 2021-2031 ($MILLION)
TABLE 109. LAMEA LANDFILL GAS BIOPOWER MARKET, BY APPLICATION, 2021-2031 ($MILLION)
TABLE 110. LAMEA BIOPOWER MARKET, BY END USE, 2021-2031 ($MILLION)
TABLE 111. LAMEA BIOPOWER MARKET, BY COUNTRY, 2021-2031 ($MILLION)
TABLE 112. BRAZIL BIOPOWER MARKET, BY FEEDSTOCK, 2021-2031 ($MILLION)
TABLE 113. BRAZIL BIOPOWER MARKET, BY TECHNOLOGY, 2021-2031 ($MILLION)
TABLE 114. BRAZIL LANDFILL GAS BIOPOWER MARKET, BY APPLICATION, 2021-2031 ($MILLION)
TABLE 115. BRAZIL BIOPOWER MARKET, BY END USE, 2021-2031 ($MILLION)
TABLE 116. TURKEY BIOPOWER MARKET, BY FEEDSTOCK, 2021-2031 ($MILLION)
TABLE 117. TURKEY BIOPOWER MARKET, BY TECHNOLOGY, 2021-2031 ($MILLION)
TABLE 118. TURKEY LANDFILL GAS BIOPOWER MARKET, BY APPLICATION, 2021-2031 ($MILLION)
TABLE 119. TURKEY BIOPOWER MARKET, BY END USE, 2021-2031 ($MILLION)
TABLE 120. SOUTH AFRICA BIOPOWER MARKET, BY FEEDSTOCK, 2021-2031 ($MILLION)
TABLE 121. SOUTH AFRICA BIOPOWER MARKET, BY TECHNOLOGY, 2021-2031 ($MILLION)
TABLE 122. SOUTH AFRICA LANDFILL GAS BIOPOWER MARKET, BY APPLICATION, 2021-2031 ($MILLION)
TABLE 123. SOUTH AFRICA BIOPOWER MARKET, BY END USE, 2021-2031 ($MILLION)
TABLE 124. REST OF LAMEA BIOPOWER MARKET, BY FEEDSTOCK, 2021-2031 ($MILLION)
TABLE 125. REST OF LAMEA BIOPOWER MARKET, BY TECHNOLOGY, 2021-2031 ($MILLION)
TABLE 126. REST OF LAMEA LANDFILL GAS BIOPOWER MARKET, BY APPLICATION, 2021-2031 ($MILLION)
TABLE 127. REST OF LAMEA BIOPOWER MARKET, BY END USE, 2021-2031 ($MILLION)
TABLE 128.DALKIA: COMPANY SNAPSHOT
TABLE 129.DALKIA: OPERATING SEGMENTS
TABLE 130.DALKIA: PRODUCT PORTFOLIO
TABLE 131.DALKIA: NET SALES,
TABLE 132.DALKIA: KEY STRATERGIES
TABLE 133.ENVITEC BIOGAS AG: COMPANY SNAPSHOT
TABLE 134.ENVITEC BIOGAS AG: OPERATING SEGMENTS
TABLE 135.ENVITEC BIOGAS AG: PRODUCT PORTFOLIO
TABLE 136.ENVITEC BIOGAS AG: NET SALES,
TABLE 137.ENVITEC BIOGAS AG: KEY STRATERGIES
TABLE 138.SCHMACK BIOGAS GMBH: COMPANY SNAPSHOT
TABLE 139.SCHMACK BIOGAS GMBH: OPERATING SEGMENTS
TABLE 140.SCHMACK BIOGAS GMBH: PRODUCT PORTFOLIO
TABLE 141.SCHMACK BIOGAS GMBH: NET SALES,
TABLE 142.SCHMACK BIOGAS GMBH: KEY STRATERGIES
TABLE 143.WELTEC BIOPOWER GMBH: COMPANY SNAPSHOT
TABLE 144.WELTEC BIOPOWER GMBH: OPERATING SEGMENTS
TABLE 145.WELTEC BIOPOWER GMBH: PRODUCT PORTFOLIO
TABLE 146.WELTEC BIOPOWER GMBH: NET SALES,
TABLE 147.WELTEC BIOPOWER GMBH: KEY STRATERGIES
TABLE 148.ORSTED A/S: COMPANY SNAPSHOT
TABLE 149.ORSTED A/S: OPERATING SEGMENTS
TABLE 150.ORSTED A/S: PRODUCT PORTFOLIO
TABLE 151.ORSTED A/S: NET SALES,
TABLE 152.ORSTED A/S: KEY STRATERGIES
TABLE 153.ELECTRATHERM: COMPANY SNAPSHOT
TABLE 154.ELECTRATHERM: OPERATING SEGMENTS
TABLE 155.ELECTRATHERM: PRODUCT PORTFOLIO
TABLE 156.ELECTRATHERM: NET SALES,
TABLE 157.ELECTRATHERM: KEY STRATERGIES
TABLE 158.BABCOCK & WILCOX ENTERPRISES INC.: COMPANY SNAPSHOT
TABLE 159.BABCOCK & WILCOX ENTERPRISES INC.: OPERATING SEGMENTS
TABLE 160.BABCOCK & WILCOX ENTERPRISES INC.: PRODUCT PORTFOLIO
TABLE 161.BABCOCK & WILCOX ENTERPRISES INC.: NET SALES,
TABLE 162.BABCOCK & WILCOX ENTERPRISES INC.: KEY STRATERGIES
TABLE 163.AMERESCO: COMPANY SNAPSHOT
TABLE 164.AMERESCO: OPERATING SEGMENTS
TABLE 165.AMERESCO: PRODUCT PORTFOLIO
TABLE 166.AMERESCO: NET SALES,
TABLE 167.AMERESCO: KEY STRATERGIES
TABLE 168.MVV ENERGIE AG: COMPANY SNAPSHOT
TABLE 169.MVV ENERGIE AG: OPERATING SEGMENTS
TABLE 170.MVV ENERGIE AG: PRODUCT PORTFOLIO
TABLE 171.MVV ENERGIE AG: NET SALES,
TABLE 172.MVV ENERGIE AG: KEY STRATERGIES
TABLE 173.ENERKEM: COMPANY SNAPSHOT
TABLE 174.ENERKEM: OPERATING SEGMENTS
TABLE 175.ENERKEM: PRODUCT PORTFOLIO
TABLE 176.ENERKEM: NET SALES,
TABLE 177.ENERKEM: KEY STRATERGIES
TABLE 178.DRAX GROUP: COMPANY SNAPSHOT
TABLE 179.DRAX GROUP: OPERATING SEGMENTS
TABLE 180.DRAX GROUP: PRODUCT PORTFOLIO
TABLE 181.DRAX GROUP: NET SALES,
TABLE 182.DRAX GROUP: KEY STRATERGIES
TABLE 183.SODRA: COMPANY SNAPSHOT
TABLE 184.SODRA: OPERATING SEGMENTS
TABLE 185.SODRA: PRODUCT PORTFOLIO
TABLE 186.SODRA: NET SALES,
TABLE 187.SODRA: KEY STRATERGIES
TABLE 188.HELIUS ENERGY PLC: COMPANY SNAPSHOT
TABLE 189.HELIUS ENERGY PLC: OPERATING SEGMENTS
TABLE 190.HELIUS ENERGY PLC: PRODUCT PORTFOLIO
TABLE 191.HELIUS ENERGY PLC: NET SALES,
TABLE 192.HELIUS ENERGY PLC: KEY STRATERGIES
TABLE 193.ALSTOM SA: COMPANY SNAPSHOT
TABLE 194.ALSTOM SA: OPERATING SEGMENTS
TABLE 195.ALSTOM SA: PRODUCT PORTFOLIO
TABLE 196.ALSTOM SA: NET SALES,
TABLE 197.ALSTOM SA: KEY STRATERGIES
TABLE 198.VATTENFALL AB: COMPANY SNAPSHOT
TABLE 199.VATTENFALL AB: OPERATING SEGMENTS
TABLE 200.VATTENFALL AB: PRODUCT PORTFOLIO
TABLE 201.VATTENFALL AB: NET SALES,
TABLE 202.VATTENFALL AB: KEY STRATERGIES
TABLE 203.VEOLIA: COMPANY SNAPSHOT
TABLE 204.VEOLIA: OPERATING SEGMENTS
TABLE 205.VEOLIA: PRODUCT PORTFOLIO
TABLE 206.VEOLIA: NET SALES,
TABLE 207.VEOLIA: KEY STRATERGIES
TABLE 208.SUEZ: COMPANY SNAPSHOT
TABLE 209.SUEZ: OPERATING SEGMENTS
TABLE 210.SUEZ: PRODUCT PORTFOLIO
TABLE 211.SUEZ: NET SALES,
TABLE 212.SUEZ: KEY STRATERGIES
TABLE 213.RAMBOLL GROUP A/S: COMPANY SNAPSHOT
TABLE 214.RAMBOLL GROUP A/S: OPERATING SEGMENTS
TABLE 215.RAMBOLL GROUP A/S: PRODUCT PORTFOLIO
TABLE 216.RAMBOLL GROUP A/S: NET SALES,
TABLE 217.RAMBOLL GROUP A/S: KEY STRATERGIES
TABLE 218.GENERAL ELECTRIC: COMPANY SNAPSHOT
TABLE 219.GENERAL ELECTRIC: OPERATING SEGMENTS
TABLE 220.GENERAL ELECTRIC: PRODUCT PORTFOLIO
TABLE 221.GENERAL ELECTRIC: NET SALES,
TABLE 222.GENERAL ELECTRIC: KEY STRATERGIES
TABLE 223.MITSUBISHI HEAVY INDUSTRIES LTD.: COMPANY SNAPSHOT
TABLE 224.MITSUBISHI HEAVY INDUSTRIES LTD.: OPERATING SEGMENTS
TABLE 225.MITSUBISHI HEAVY INDUSTRIES LTD.: PRODUCT PORTFOLIO
TABLE 226.MITSUBISHI HEAVY INDUSTRIES LTD.: NET SALES,
TABLE 227.MITSUBISHI HEAVY INDUSTRIES LTD.: KEY STRATERGIES LIST OF FIGURES
FIGURE 1.BIOPOWER MARKET SEGMENTATION
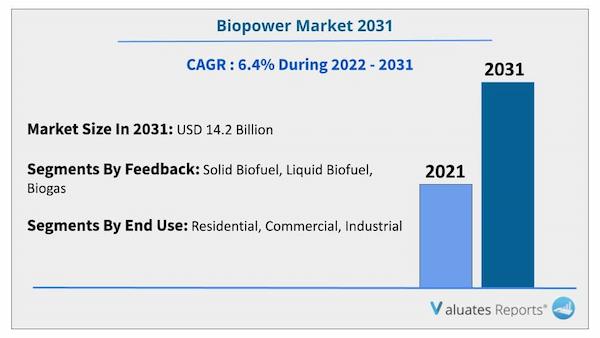
FIGURE 2.BIOPOWER MARKET,2021-2031
FIGURE 3.BIOPOWER MARKET,2021-2031
FIGURE 4. TOP INVESTMENT POCKETS, BY REGION
FIGURE 5.PORTER FIVE-1
FIGURE 6.PORTER FIVE-2
FIGURE 7.PORTER FIVE-3
FIGURE 8.PORTER FIVE-4
FIGURE 9.PORTER FIVE-5
FIGURE 10.TOP PLAYER POSITIONING
FIGURE 11.BIOPOWER MARKET:DRIVERS, RESTRAINTS AND OPPORTUNITIES
FIGURE 12.VALUE CHAIN ANALYSIS
FIGURE 13.KEY REGULATION ANALYSIS
FIGURE 14.BIOPOWER MARKET,BY FEEDSTOCK,2021(%)
FIGURE 15.COMPARATIVE SHARE ANALYSIS OF SOLID BIOFUEL BIOPOWER MARKET,2021-2031(%)
FIGURE 16.COMPARATIVE SHARE ANALYSIS OF LIQUID BIOFUEL BIOPOWER MARKET,2021-2031(%)
FIGURE 17.COMPARATIVE SHARE ANALYSIS OF BIOGAS BIOPOWER MARKET,2021-2031(%)
FIGURE 18.BIOPOWER MARKET,BY TECHNOLOGY,2021(%)
FIGURE 19.COMPARATIVE SHARE ANALYSIS OF DIRECT COMBUSTION BIOPOWER MARKET,2021-2031(%)
FIGURE 20.COMPARATIVE SHARE ANALYSIS OF GASIFICATION BIOPOWER MARKET,2021-2031(%)
FIGURE 21.COMPARATIVE SHARE ANALYSIS OF ANAEROBIC DIGESTION BIOPOWER MARKET,2021-2031(%)
FIGURE 22.COMPARATIVE SHARE ANALYSIS OF LANDFILL GAS BIOPOWER MARKET,2021-2031(%)
FIGURE 23.COMPARATIVE SHARE ANALYSIS OF OTHERS BIOPOWER MARKET,2021-2031(%)
FIGURE 24.BIOPOWER MARKET,BY END USE,2021(%)
FIGURE 25.COMPARATIVE SHARE ANALYSIS OF RESIDENTIAL BIOPOWER MARKET,2021-2031(%)
FIGURE 26.COMPARATIVE SHARE ANALYSIS OF COMMERCIAL BIOPOWER MARKET,2021-2031(%)
FIGURE 27.COMPARATIVE SHARE ANALYSIS OF INDUSTRIAL BIOPOWER MARKET,2021-2031(%)
FIGURE 28.BIOPOWER MARKET BY REGION,2021
FIGURE 29.U.S. BIOPOWER MARKET,2021-2031($MILLION)
FIGURE 30.CANADA BIOPOWER MARKET,2021-2031($MILLION)
FIGURE 31.MEXICO BIOPOWER MARKET,2021-2031($MILLION)
FIGURE 32.GERMANY BIOPOWER MARKET,2021-2031($MILLION)
FIGURE 33.FRANCE BIOPOWER MARKET,2021-2031($MILLION)
FIGURE 34.ITALY BIOPOWER MARKET,2021-2031($MILLION)
FIGURE 35.SPAIN BIOPOWER MARKET,2021-2031($MILLION)
FIGURE 36.UK BIOPOWER MARKET,2021-2031($MILLION)
FIGURE 37.REST OF EUROPE BIOPOWER MARKET,2021-2031($MILLION)
FIGURE 38.CHINA BIOPOWER MARKET,2021-2031($MILLION)
FIGURE 39.JAPAN BIOPOWER MARKET,2021-2031($MILLION)
FIGURE 40.INDIA BIOPOWER MARKET,2021-2031($MILLION)
FIGURE 41.SOUTH KOREA BIOPOWER MARKET,2021-2031($MILLION)
FIGURE 42.REST OF ASIA-PACIFIC BIOPOWER MARKET,2021-2031($MILLION)
FIGURE 43.BRAZIL BIOPOWER MARKET,2021-2031($MILLION)
FIGURE 44.TURKEY BIOPOWER MARKET,2021-2031($MILLION)
FIGURE 45.SOUTH AFRICA BIOPOWER MARKET,2021-2031($MILLION)
FIGURE 46.REST OF LAMEA BIOPOWER MARKET,2021-2031($MILLION)
FIGURE 47. TOP WINNING STRATEGIES, BY YEAR
FIGURE 48. TOP WINNING STRATEGIES, BY DEVELOPMENT
FIGURE 49. TOP WINNING STRATEGIES, BY COMPANY
FIGURE 50.PRODUCT MAPPING OF TOP 10 PLAYERS
FIGURE 51.COMPETITIVE DASHBOARD
FIGURE 52.COMPETITIVE HEATMAP OF TOP 10 KEY PLAYERS
FIGURE 53.DALKIA.: NET SALES ,($MILLION)
FIGURE 54.ENVITEC BIOGAS AG.: NET SALES ,($MILLION)
FIGURE 55.SCHMACK BIOGAS GMBH.: NET SALES ,($MILLION)
FIGURE 56.WELTEC BIOPOWER GMBH.: NET SALES ,($MILLION)
FIGURE 57.ORSTED A/S.: NET SALES ,($MILLION)
FIGURE 58.ELECTRATHERM.: NET SALES ,($MILLION)
FIGURE 59.BABCOCK & WILCOX ENTERPRISES INC..: NET SALES ,($MILLION)
FIGURE 60.AMERESCO.: NET SALES ,($MILLION)
FIGURE 61.MVV ENERGIE AG.: NET SALES ,($MILLION)
FIGURE 62.ENERKEM.: NET SALES ,($MILLION)
FIGURE 63.DRAX GROUP.: NET SALES ,($MILLION)
FIGURE 64.SODRA.: NET SALES ,($MILLION)
FIGURE 65.HELIUS ENERGY PLC.: NET SALES ,($MILLION)
FIGURE 66.ALSTOM SA.: NET SALES ,($MILLION)
FIGURE 67.VATTENFALL AB.: NET SALES ,($MILLION)
FIGURE 68.VEOLIA.: NET SALES ,($MILLION)
FIGURE 69.SUEZ.: NET SALES ,($MILLION)
FIGURE 70.RAMBOLL GROUP A/S.: NET SALES ,($MILLION)
FIGURE 71.GENERAL ELECTRIC.: NET SALES ,($MILLION)
FIGURE 72.MITSUBISHI HEAVY INDUSTRIES LTD..: NET SALES ,($MILLION
SELECT A FORMAT
Added to Cart
Electronic (PDF)

$5730

This license allows only one user to access the PDF.
Electronic (PDF)

$6450

This license allows 1 - 5 user to access the PDF, license is suitable for small groups of 5 users working together
Electronic (PDF)

$9600

This license allows users/teams in a same Enterprise to use this report, various departments within an enterpise can use this report
Electronic (PDF)

$3840

This license just provides quantitative data in a excel sheet
Add to Cart
Buy Now (15% Discount)

OUR CUSTOMER

Samsung SD

SIMILAR REPORTS


RELATED REPORTS

Global Concentrating Solar Power Tower Market Research Report 2024

120 Pages
Type: Report
Code: QYRE-Auto-32T8298
Wed Apr 17 00:00:00 UTC 2024

Add to Cart

Global Electric Generating Set Market Research Report 2024

120 Pages
Type: Report
Code: QYRE-Auto-16B9371
Mon Apr 15 00:00:00 UTC 2024

Add to Cart

Global Solar Air Conditioning Market Research Report 2024

120 Pages
Type: Report
Code: QYRE-Auto-5S896
Mon Apr 15 00:00:00 UTC 2024

Add to Cart

Copper-based Photovoltaic Ribbon - Global Market Share and Ranking, Overall Sales and Demand Forecast 2024-2030

120 Pages
Type: Report
Code: QYRE-Auto-19V14088
Mon Apr 08 00:00:00 UTC 2024

Add to Cart