0
U.S. (TOLL FREE)
+1 (315) 215-3225
Automative

0
U.S. (TOLL FREE)
+1 (315) 215-3225
Nano Radiation Sensors Market By Type (Scintillation Detectors, Solid-state Detectors, Gas-filled Detectors), By Application (Healthcare, Consumer Electronics, Security and Defense, Oil and Gas, Power Plants, Others): Global Opportunity Analysis and Industry Forecast, 2021-2031
Published Date: March 2023
|
Report Code: ALLI-Auto-0V754
Home | Market Reports | Science
Nano Radiation Sensors Market By Type Scintillation Detectors Solid state Detectors Gas filled Detectors By Application Healthcare Consumer Electronics Security and Defense Oil and Gas Power Plants Others Global Opportunity Analysis and Industry Forecast 2021 2031
BUY CHAPTERS

Nano Radiation Sensors Market By Type (Scintillation Detectors, Solid-state Detectors, Gas-filled Detectors), By Application (Healthcare, Consumer Electronics, Security and Defense, Oil and Gas, Power Plants, Others): Global Opportunity Analysis and Industry Forecast, 2021-2031

Code: ALLI-Auto-0V754
Report
March 2023
Pages:293
Allied Market Research
Buy Now with 15% Discount
DESCRIPTION
TABLE OF CONTENT
TABLES & FIGURES

Nano Radiation Sensors Market Size

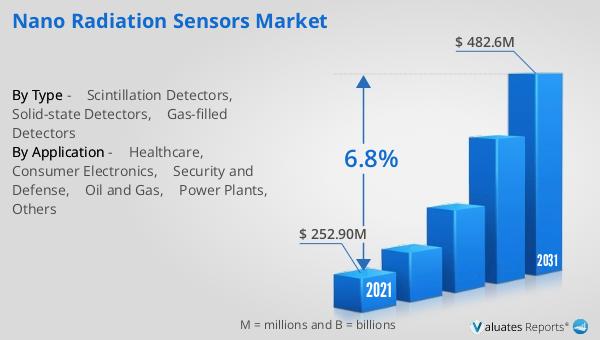
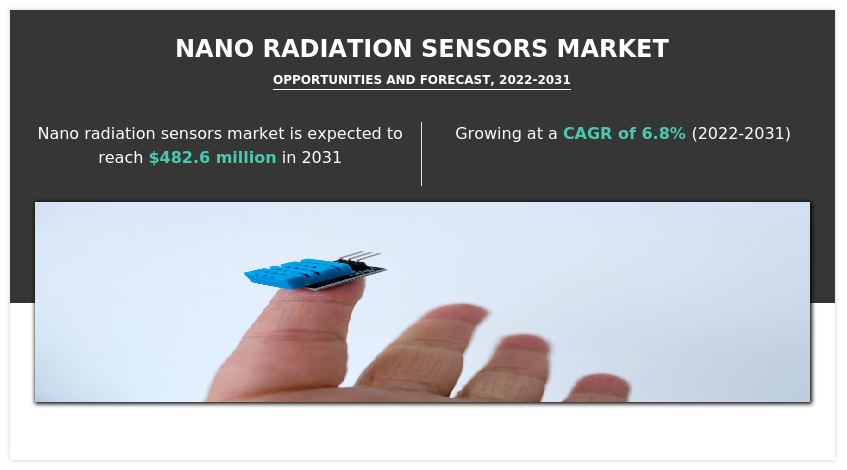
According to a new report published by , titled, “Nano Radiation Sensors Market," The nano radiation sensors market was valued at $252.90 million in 2021, and is estimated to reach $482.6 million by 2031, growing at a CAGR of 6.8% from 2022 to 2031.

Nano Radiation Sensors Market

Nano Radiation Sensors Market

A radiation detector, or specific detector, is a device used to detect, track or identify particles produced by ionizing particles such as cosmic rays, nuclear fission or particle accelerator reactions. Radiation detectors can measure the energy and other properties of a particle, such as momentum, spin, charge, type of particle, in addition to simply recording the presence of the particle.  
Radiation sensors are an important tool for ensuring safety in environments where radiation is present. They can be used to monitor radiation levels and alert individuals to potential hazards, allowing them to take appropriate safety measures. Nano radiation sensors have a number of advantages over traditional radiation sensors, including high sensitivity, low power consumption, and small size. 
One type of nano radiation sensor is the solid-state radiation detector, which is made of a thin film of a semiconductor material, such as silicon or diamond. When ionizing radiation passes through the detector, it generates a charge that is collected by electrodes on either side of the semiconductor. The amount of charge generated is proportional to the amount of radiation absorbed by the detector. 
Another type of nano radiation sensor is the scintillation detector, which is made of a scintillating material, such as a crystal or plastic, that emits light when ionizing radiation interacts with it. The light is then detected by a photodetector, such as a photomultiplier tube or a silicon photodiode. The amount of light generated is proportional to the amount of radiation absorbed by the scintillator. 
There are also nano radiation sensors based on carbon nanotubes or graphene, which have been shown to have high sensitivity to radiation due to their unique electronic properties. These sensors work by measuring changes in electrical conductivity or capacitance when ionizing radiation passes through them. 
Overall, nano radiation sensors offer a promising avenue for developing highly sensitive and compact radiation detectors that can be used in a wide range of applications, including radiation monitoring in nuclear power plants, medical imaging, and space exploration. 
The market for nano radiation sensors has experienced a consistent increase in demand over the past few years, particularly in the areas of security and nuclear surveillance due to their effectiveness in detecting the presence of nuclear devices. To aid in the surveillance efforts of various countries, top manufacturers in the global nano radiation sensors market are actively working to create new and innovative products that are appropriate for use in ports, airports, and regional borders, thereby further driving the growth of the overall market. 
During the forecast period, North America is predicted to be the leading region in the nano radiation sensors market due to the advancements in technology within the semiconductor industry. The market in Europe and Asia Pacific is also projected to grow significantly during this period. However, the market in Latin America, Middle East, and Africa is expected to grow at a moderate pace. To encourage the adoption of nano radiation sensors across various end-use cases, semiconductor companies should prioritize increasing the availability of affordable sensors. 
The nano radiation sensors market is segmented based on type, application, and region. By type, the market is divided into scintillation detectors, solid-state detectors, and gas-filled detectors. By application, the market is categorized into healthcare, consumer electronics, security & defense, oil & gas, power plants, and others. In terms of region, the market is analyzed across North America (U.S., Canada, and Mexico), Europe (UK, Germany, France, and rest of Europe), Asia-Pacific (China, Japan, India, South Korea, and rest of Asia-Pacific) and LAMEA (Latin America, the Middle East, and Africa).   
The key players profiled in the nano radiation sensors industry include First Sensor AG, Hamamastu Photonics K.K, Thermo Fischer Scientific Inc., Kromek Group PLC, Nihon Kessho Kogaku Company Ltd., Fluke Corporation, Baker Hughes (General Electric), Mirion Technologies, PCE Instruments, and Canon Electron Tubes & Devices Co. The players in the market have been actively engaged in the adoption of various strategies such as product launches and agreements to remain competitive and gain an advantage over the competitors in the market.       
Key Market Insights 
The scintillation detectors segment of the market emerged as the leading revenue contributor by type, generating $108.86 million in 2021. It is projected to grow further and reach $210.45 million by 2031, with a compound annual growth rate of 6.91%. 
By application, the healthcare segment was the highest revenue contributor to the market, with $76.35 million in 2021, and is estimated to reach $160.47 million by 2031, with a CAGR of 7.8%. 
Region-wise, North America was the highest revenue contributor, accounting for $85.73 million in 2021, and is estimated to reach $175.14 million by 2031, with a CAGR of 7.5%. 
The U.S. was the leading revenue-generating country, contributing $45.06 million to the market in 2021, and is projected to reach $92.81 million by 2031, with a CAGR of 7.59%. 

Overview

The global nano radiation sensors market was valued at $252.9 million in 2021, and is projected to reach $482.62 million by 2031, registering a CAGR of 6.77% from 2022 to 2031. Nano radiation sensors are devices designed to detect and measure ionizing radiation, which includes particles and electromagnetic waves that can cause damage to living cells and other materials. These sensors are typically much smaller and more sensitive than traditional radiation detection equipment, allowing for precise measurements and greater flexibility.  
Nano radiation sensors can be used in a wide range of industrial applications where the detection and measurement of radiation is important. They can help ensure the safety of workers, the public, and the environment, and help to prevent the spread of radiation contamination. Radiation sensors can be used in aerospace applications to monitor radiation levels in space, particularly in areas where radiation exposure is a concern for astronauts and equipment. Nano radiation sensors can be used to monitor radiation levels in mines, particularly in uranium mines, to ensure that workers are not exposed to dangerous levels of radiation. 
The nano radiation sensors market is segmented based on type, application, and region. By type, the market is divided into scintillation detectors, solid-state detectors, and gas-filled detectors. By application, the market is categorized into healthcare, consumer electronics, security & defense, oil & gas, power plants, and others. In terms of region, the market is analyzed across North America (U.S., Canada, and Mexico), Europe (UK, Germany, France, and rest of Europe), Asia-Pacific (China, Japan, India, South Korea, and rest of Asia-Pacific) and LAMEA (Latin America, the Middle East, and Africa).  
The key players profiled in the nano radiation sensors industry include First Sensor AG, Hamamastu Photonics K.K, Thermo Fischer Scientific Inc., Kromek Group PLC, Nihon Kessho Kogaku Company Ltd., Fluke Corporation, Baker Hughes (General Electric), Mirion Technologies, PCE Instruments, and Canon Electron Tubes & Devices Co.   

Key Benefits For Stakeholders

●This report provides a quantitative analysis of the market segments, current trends, estimations, and dynamics of the nano radiation sensors market analysis from 2021 to 2031 to identify the prevailing nano radiation sensors market opportunities.
●The market research is offered along with information related to key drivers, restraints, and opportunities.
●Porter's five forces analysis highlights the potency of buyers and suppliers to enable stakeholders make profit-oriented business decisions and strengthen their supplier-buyer network.
●In-depth analysis of the nano radiation sensors market segmentation assists to determine the prevailing market opportunities.
●Major countries in each region are mapped according to their revenue contribution to the global market.
●Market player positioning facilitates benchmarking and provides a clear understanding of the present position of the market players.
●The report includes the analysis of the regional as well as global nano radiation sensors market trends, key players, market segments, application areas, and market growth strategies.
Key Market Segments
○ PCE Instrument

Scope of Nano Radiation Sensors Market Report

Report Metric Details
Report Name Nano Radiation Sensors Market
Accounted market size in 2021 $ 252.90 million
Forecasted market size in 2031 $ 482.6 million
CAGR 6.8%
Base Year 2021
Forecasted years 2024 - 2031
By Type ● Scintillation Detectors
● Solid-state Detectors
● Gas-filled Detectors
By Application ● Healthcare
● Consumer Electronics
● Security and Defense
● Oil and Gas
● Power Plants
● Others
By Region
  • North America (United States, Canada)
  • Europe (Germany, France, UK, Italy, Russia) Rest of Europe
  • Nordic Countries
  • Asia-Pacific (China, Japan, South Korea)
  • Southeast Asia (India, Australia)
  • Rest of Asia
  • Latin America (Mexico, Brazil)
  • Rest of Latin America
  • Middle East & Africa (Turkey, Saudi Arabia, UAE, Rest of MEA)
Forecast units USD million in value
Report coverage Revenue and volume forecast, company share, competitive landscape, growth factors and trends

FAQ for this report

How fast is Nano Radiation Sensors Market growing?

Ans: The Nano Radiation Sensors Market witnessing a CAGR of 6.8% during the forecast period 2024-2031.

What is the Nano Radiation Sensors Market size in 2031?

Ans: The Nano Radiation Sensors Market size in 2031 will be $ 482.6 million.

What are the Application segmentation covered in the Nano Radiation Sensors Market report?

Ans: The Applications covered in the Nano Radiation Sensors Market report are ● Healthcare, ● Consumer Electronics, ● Security and Defense, ● Oil and Gas, ● Power Plants, ● Others

What are the Type segmentation covered in the Nano Radiation Sensors Market report?

Ans: The Types covered in the Nano Radiation Sensors Market report are ● Scintillation Detectors, ● Solid-state Detectors, ● Gas-filled Detectors

CHAPTER 1: INTRODUCTION
1.1. Report description
1.2. Key market segments
1.3. Key benefits to the stakeholders
1.4. Research Methodology
1.4.1. Primary research
1.4.2. Secondary research
1.4.3. Analyst tools and models
CHAPTER 2: EXECUTIVE SUMMARY
2.1. CXO Perspective
CHAPTER 3: MARKET OVERVIEW
3.1. Market definition and scope
3.2. Key findings
3.2.1. Top impacting factors
3.2.2. Top investment pockets
3.3. Porter’s five forces analysis
3.3.1. Bargaining power of suppliers
3.3.2. Bargaining power of buyers
3.3.3. Threat of substitutes
3.3.4. Threat of new entrants
3.3.5. Intensity of rivalry
3.4. Market dynamics
3.4.1. Drivers
3.4.1.1. Nano radiation sensors in nuclear surveillance applications show potential for market growth
3.4.1.2. Growing applications of nuclear medicine and radiotherapy in cancer treatment driving demand for radiation sensor devices
3.4.2. Restraints
3.4.2.1. High cost in the development and performance of nano radiation sensors
3.4.3. Opportunities
3.4.3.1. Growing interest on nuclear energy in emerging countries
3.5. COVID-19 Impact Analysis on the market
CHAPTER 4: NANO RADIATION SENSORS MARKET, BY TYPE
4.1. Overview
4.1.1. Market size and forecast
4.2. Scintillation Detectors
4.2.1. Key market trends, growth factors and opportunities
4.2.2. Market size and forecast, by region
4.2.3. Market share analysis by country
4.3. Solid-state Detectors
4.3.1. Key market trends, growth factors and opportunities
4.3.2. Market size and forecast, by region
4.3.3. Market share analysis by country
4.4. Gas-filled Detectors
4.4.1. Key market trends, growth factors and opportunities
4.4.2. Market size and forecast, by region
4.4.3. Market share analysis by country
CHAPTER 5: NANO RADIATION SENSORS MARKET, BY APPLICATION
5.1. Overview
5.1.1. Market size and forecast
5.2. Healthcare
5.2.1. Key market trends, growth factors and opportunities
5.2.2. Market size and forecast, by region
5.2.3. Market share analysis by country
5.3. Consumer Electronics
5.3.1. Key market trends, growth factors and opportunities
5.3.2. Market size and forecast, by region
5.3.3. Market share analysis by country
5.4. Security and Defense
5.4.1. Key market trends, growth factors and opportunities
5.4.2. Market size and forecast, by region
5.4.3. Market share analysis by country
5.5. Oil and Gas
5.5.1. Key market trends, growth factors and opportunities
5.5.2. Market size and forecast, by region
5.5.3. Market share analysis by country
5.6. Power Plants
5.6.1. Key market trends, growth factors and opportunities
5.6.2. Market size and forecast, by region
5.6.3. Market share analysis by country
5.7. Others
5.7.1. Key market trends, growth factors and opportunities
5.7.2. Market size and forecast, by region
5.7.3. Market share analysis by country
CHAPTER 6: NANO RADIATION SENSORS MARKET, BY REGION
6.1. Overview
6.1.1. Market size and forecast By Region
6.2. North America
6.2.1. Key trends and opportunities
6.2.2. Market size and forecast, by Type
6.2.3. Market size and forecast, by Application
6.2.4. Market size and forecast, by country
6.2.4.1. U.S.
6.2.4.1.1. Key market trends, growth factors and opportunities
6.2.4.1.2. Market size and forecast, by Type
6.2.4.1.3. Market size and forecast, by Application
6.2.4.2. Canada
6.2.4.2.1. Key market trends, growth factors and opportunities
6.2.4.2.2. Market size and forecast, by Type
6.2.4.2.3. Market size and forecast, by Application
6.2.4.3. Mexico
6.2.4.3.1. Key market trends, growth factors and opportunities
6.2.4.3.2. Market size and forecast, by Type
6.2.4.3.3. Market size and forecast, by Application
6.3. Europe
6.3.1. Key trends and opportunities
6.3.2. Market size and forecast, by Type
6.3.3. Market size and forecast, by Application
6.3.4. Market size and forecast, by country
6.3.4.1. UK
6.3.4.1.1. Key market trends, growth factors and opportunities
6.3.4.1.2. Market size and forecast, by Type
6.3.4.1.3. Market size and forecast, by Application
6.3.4.2. Germany
6.3.4.2.1. Key market trends, growth factors and opportunities
6.3.4.2.2. Market size and forecast, by Type
6.3.4.2.3. Market size and forecast, by Application
6.3.4.3. France
6.3.4.3.1. Key market trends, growth factors and opportunities
6.3.4.3.2. Market size and forecast, by Type
6.3.4.3.3. Market size and forecast, by Application
6.3.4.4. Rest of Europe
6.3.4.4.1. Key market trends, growth factors and opportunities
6.3.4.4.2. Market size and forecast, by Type
6.3.4.4.3. Market size and forecast, by Application
6.4. Asia-Pacific
6.4.1. Key trends and opportunities
6.4.2. Market size and forecast, by Type
6.4.3. Market size and forecast, by Application
6.4.4. Market size and forecast, by country
6.4.4.1. China
6.4.4.1.1. Key market trends, growth factors and opportunities
6.4.4.1.2. Market size and forecast, by Type
6.4.4.1.3. Market size and forecast, by Application
6.4.4.2. Japan
6.4.4.2.1. Key market trends, growth factors and opportunities
6.4.4.2.2. Market size and forecast, by Type
6.4.4.2.3. Market size and forecast, by Application
6.4.4.3. India
6.4.4.3.1. Key market trends, growth factors and opportunities
6.4.4.3.2. Market size and forecast, by Type
6.4.4.3.3. Market size and forecast, by Application
6.4.4.4. South Korea
6.4.4.4.1. Key market trends, growth factors and opportunities
6.4.4.4.2. Market size and forecast, by Type
6.4.4.4.3. Market size and forecast, by Application
6.4.4.5. Rest of Asia-Pacific
6.4.4.5.1. Key market trends, growth factors and opportunities
6.4.4.5.2. Market size and forecast, by Type
6.4.4.5.3. Market size and forecast, by Application
6.5. LAMEA
6.5.1. Key trends and opportunities
6.5.2. Market size and forecast, by Type
6.5.3. Market size and forecast, by Application
6.5.4. Market size and forecast, by country
6.5.4.1. Latin America
6.5.4.1.1. Key market trends, growth factors and opportunities
6.5.4.1.2. Market size and forecast, by Type
6.5.4.1.3. Market size and forecast, by Application
6.5.4.2. Middle East
6.5.4.2.1. Key market trends, growth factors and opportunities
6.5.4.2.2. Market size and forecast, by Type
6.5.4.2.3. Market size and forecast, by Application
6.5.4.3. Africa
6.5.4.3.1. Key market trends, growth factors and opportunities
6.5.4.3.2. Market size and forecast, by Type
6.5.4.3.3. Market size and forecast, by Application
CHAPTER 7: COMPETITIVE LANDSCAPE
7.1. Introduction
7.2. Top winning strategies
7.3. Product Mapping of Top 10 Player
7.4. Competitive Dashboard
7.5. Competitive Heatmap
7.6. Top player positioning, 2021
CHAPTER 8: COMPANY PROFILES
8.1. First Sensor Ag
8.1.1. Company overview
8.1.2. Key Executives
8.1.3. Company snapshot
8.1.4. Operating business segments
8.1.5. Product portfolio
8.1.6. Business performance
8.2. Hamamastu Photonics K.K
8.2.1. Company overview
8.2.2. Key Executives
8.2.3. Company snapshot
8.2.4. Operating business segments
8.2.5. Product portfolio
8.2.6. Business performance
8.2.7. Key strategic moves and developments
8.3. Thermo Fischer Scientific Inc.
8.3.1. Company overview
8.3.2. Key Executives
8.3.3. Company snapshot
8.3.4. Operating business segments
8.3.5. Product portfolio
8.3.6. Business performance
8.3.7. Key strategic moves and developments
8.4. Kromek Group PLC
8.4.1. Company overview
8.4.2. Key Executives
8.4.3. Company snapshot
8.4.4. Operating business segments
8.4.5. Product portfolio
8.4.6. Business performance
8.4.7. Key strategic moves and developments
8.5. NIHON KESSHO KOGAKU CO., LTD.
8.5.1. Company overview
8.5.2. Key Executives
8.5.3. Company snapshot
8.5.4. Operating business segments
8.5.5. Product portfolio
8.6. Fluke Corporation
8.6.1. Company overview
8.6.2. Key Executives
8.6.3. Company snapshot
8.6.4. Operating business segments
8.6.5. Product portfolio
8.7. Baker Hughes (General Electric)
8.7.1. Company overview
8.7.2. Key Executives
8.7.3. Company snapshot
8.7.4. Operating business segments
8.7.5. Product portfolio
8.7.6. Business performance
8.8. Mirion Technologies Inc.
8.8.1. Company overview
8.8.2. Key Executives
8.8.3. Company snapshot
8.8.4. Operating business segments
8.8.5. Product portfolio
8.8.6. Business performance
8.9. PCE Instruments
8.9.1. Company overview
8.9.2. Key Executives
8.9.3. Company snapshot
8.9.4. Operating business segments
8.9.5. Product portfolio
8.10. Canon Electron Tubes & Devices Co.
8.10.1. Company overview
8.10.2. Key Executives
8.10.3. Company snapshot
8.10.4. Operating business segments
8.10.5. Product portfolio
8.10.6. Business performance
8.10.7. Key strategic moves and development
LIST OF TABLES
TABLE 01. GLOBAL NANO RADIATION SENSORS MARKET, BY TYPE, 2021-2031 ($MILLION)
TABLE 02. NANO RADIATION SENSORS MARKET FOR SCINTILLATION DETECTORS, BY REGION, 2021-2031 ($MILLION)
TABLE 03. NANO RADIATION SENSORS MARKET FOR SOLID-STATE DETECTORS, BY REGION, 2021-2031 ($MILLION)
TABLE 04. NANO RADIATION SENSORS MARKET FOR GAS-FILLED DETECTORS, BY REGION, 2021-2031 ($MILLION)
TABLE 05. GLOBAL NANO RADIATION SENSORS MARKET, BY APPLICATION, 2021-2031 ($MILLION)
TABLE 06. NANO RADIATION SENSORS MARKET FOR HEALTHCARE, BY REGION, 2021-2031 ($MILLION)
TABLE 07. NANO RADIATION SENSORS MARKET FOR CONSUMER ELECTRONICS, BY REGION, 2021-2031 ($MILLION)
TABLE 08. NANO RADIATION SENSORS MARKET FOR SECURITY AND DEFENSE, BY REGION, 2021-2031 ($MILLION)
TABLE 09. NANO RADIATION SENSORS MARKET FOR OIL AND GAS, BY REGION, 2021-2031 ($MILLION)
TABLE 10. NANO RADIATION SENSORS MARKET FOR POWER PLANTS, BY REGION, 2021-2031 ($MILLION)
TABLE 11. NANO RADIATION SENSORS MARKET FOR OTHERS, BY REGION, 2021-2031 ($MILLION)
TABLE 12. NANO RADIATION SENSORS MARKET, BY REGION, 2021-2031 ($MILLION)
TABLE 13. NORTH AMERICA NANO RADIATION SENSORS MARKET, BY TYPE, 2021-2031 ($MILLION)
TABLE 14. NORTH AMERICA NANO RADIATION SENSORS MARKET, BY APPLICATION, 2021-2031 ($MILLION)
TABLE 15. NORTH AMERICA NANO RADIATION SENSORS MARKET, BY COUNTRY, 2021-2031 ($MILLION)
TABLE 16. U.S. NANO RADIATION SENSORS MARKET, BY TYPE, 2021-2031 ($MILLION)
TABLE 17. U.S. NANO RADIATION SENSORS MARKET, BY APPLICATION, 2021-2031 ($MILLION)
TABLE 18. CANADA NANO RADIATION SENSORS MARKET, BY TYPE, 2021-2031 ($MILLION)
TABLE 19. CANADA NANO RADIATION SENSORS MARKET, BY APPLICATION, 2021-2031 ($MILLION)
TABLE 20. MEXICO NANO RADIATION SENSORS MARKET, BY TYPE, 2021-2031 ($MILLION)
TABLE 21. MEXICO NANO RADIATION SENSORS MARKET, BY APPLICATION, 2021-2031 ($MILLION)
TABLE 22. EUROPE NANO RADIATION SENSORS MARKET, BY TYPE, 2021-2031 ($MILLION)
TABLE 23. EUROPE NANO RADIATION SENSORS MARKET, BY APPLICATION, 2021-2031 ($MILLION)
TABLE 24. EUROPE NANO RADIATION SENSORS MARKET, BY COUNTRY, 2021-2031 ($MILLION)
TABLE 25. UK NANO RADIATION SENSORS MARKET, BY TYPE, 2021-2031 ($MILLION)
TABLE 26. UK NANO RADIATION SENSORS MARKET, BY APPLICATION, 2021-2031 ($MILLION)
TABLE 27. GERMANY NANO RADIATION SENSORS MARKET, BY TYPE, 2021-2031 ($MILLION)
TABLE 28. GERMANY NANO RADIATION SENSORS MARKET, BY APPLICATION, 2021-2031 ($MILLION)
TABLE 29. FRANCE NANO RADIATION SENSORS MARKET, BY TYPE, 2021-2031 ($MILLION)
TABLE 30. FRANCE NANO RADIATION SENSORS MARKET, BY APPLICATION, 2021-2031 ($MILLION)
TABLE 31. REST OF EUROPE NANO RADIATION SENSORS MARKET, BY TYPE, 2021-2031 ($MILLION)
TABLE 32. REST OF EUROPE NANO RADIATION SENSORS MARKET, BY APPLICATION, 2021-2031 ($MILLION)
TABLE 33. ASIA-PACIFIC NANO RADIATION SENSORS MARKET, BY TYPE, 2021-2031 ($MILLION)
TABLE 34. ASIA-PACIFIC NANO RADIATION SENSORS MARKET, BY APPLICATION, 2021-2031 ($MILLION)
TABLE 35. ASIA-PACIFIC NANO RADIATION SENSORS MARKET, BY COUNTRY, 2021-2031 ($MILLION)
TABLE 36. CHINA NANO RADIATION SENSORS MARKET, BY TYPE, 2021-2031 ($MILLION)
TABLE 37. CHINA NANO RADIATION SENSORS MARKET, BY APPLICATION, 2021-2031 ($MILLION)
TABLE 38. JAPAN NANO RADIATION SENSORS MARKET, BY TYPE, 2021-2031 ($MILLION)
TABLE 39. JAPAN NANO RADIATION SENSORS MARKET, BY APPLICATION, 2021-2031 ($MILLION)
TABLE 40. INDIA NANO RADIATION SENSORS MARKET, BY TYPE, 2021-2031 ($MILLION)
TABLE 41. INDIA NANO RADIATION SENSORS MARKET, BY APPLICATION, 2021-2031 ($MILLION)
TABLE 42. SOUTH KOREA NANO RADIATION SENSORS MARKET, BY TYPE, 2021-2031 ($MILLION)
TABLE 43. SOUTH KOREA NANO RADIATION SENSORS MARKET, BY APPLICATION, 2021-2031 ($MILLION)
TABLE 44. REST OF ASIA-PACIFIC NANO RADIATION SENSORS MARKET, BY TYPE, 2021-2031 ($MILLION)
TABLE 45. REST OF ASIA-PACIFIC NANO RADIATION SENSORS MARKET, BY APPLICATION, 2021-2031 ($MILLION)
TABLE 46. LAMEA NANO RADIATION SENSORS MARKET, BY TYPE, 2021-2031 ($MILLION)
TABLE 47. LAMEA NANO RADIATION SENSORS MARKET, BY APPLICATION, 2021-2031 ($MILLION)
TABLE 48. LAMEA NANO RADIATION SENSORS MARKET, BY COUNTRY, 2021-2031 ($MILLION)
TABLE 49. LATIN AMERICA NANO RADIATION SENSORS MARKET, BY TYPE, 2021-2031 ($MILLION)
TABLE 50. LATIN AMERICA NANO RADIATION SENSORS MARKET, BY APPLICATION, 2021-2031 ($MILLION)
TABLE 51. MIDDLE EAST NANO RADIATION SENSORS MARKET, BY TYPE, 2021-2031 ($MILLION)
TABLE 52. MIDDLE EAST NANO RADIATION SENSORS MARKET, BY APPLICATION, 2021-2031 ($MILLION)
TABLE 53. AFRICA NANO RADIATION SENSORS MARKET, BY TYPE, 2021-2031 ($MILLION)
TABLE 54. AFRICA NANO RADIATION SENSORS MARKET, BY APPLICATION, 2021-2031 ($MILLION)
TABLE 55. FIRST SENSOR AG: KEY EXECUTIVES
TABLE 56. FIRST SENSOR AG: COMPANY SNAPSHOT
TABLE 57. FIRST SENSOR AG: PRODUCT SEGMENTS
TABLE 58. FIRST SENSOR AG: PRODUCT PORTFOLIO
TABLE 59. HAMAMASTU PHOTONICS K.K: KEY EXECUTIVES
TABLE 60. HAMAMASTU PHOTONICS K.K: COMPANY SNAPSHOT
TABLE 61. HAMAMASTU PHOTONICS K.K: PRODUCT SEGMENTS
TABLE 62. HAMAMASTU PHOTONICS K.K: PRODUCT PORTFOLIO
TABLE 63. HAMAMASTU PHOTONICS K.K: KEY STRATERGIES
TABLE 64. THERMO FISCHER SCIENTIFIC INC.: KEY EXECUTIVES
TABLE 65. THERMO FISCHER SCIENTIFIC INC.: COMPANY SNAPSHOT
TABLE 66. THERMO FISCHER SCIENTIFIC INC.: PRODUCT SEGMENTS
TABLE 67. THERMO FISCHER SCIENTIFIC INC.: PRODUCT PORTFOLIO
TABLE 68. THERMO FISCHER SCIENTIFIC INC.: KEY STRATERGIES
TABLE 69. KROMEK GROUP PLC: KEY EXECUTIVES
TABLE 70. KROMEK GROUP PLC: COMPANY SNAPSHOT
TABLE 71. KROMEK GROUP PLC: PRODUCT SEGMENTS
TABLE 72. KROMEK GROUP PLC: PRODUCT PORTFOLIO
TABLE 73. KROMEK GROUP PLC: KEY STRATERGIES
TABLE 74. NIHON KESSHO KOGAKU CO., LTD.: KEY EXECUTIVES
TABLE 75. NIHON KESSHO KOGAKU CO., LTD.: COMPANY SNAPSHOT
TABLE 76. NIHON KESSHO KOGAKU CO., LTD.: PRODUCT SEGMENTS
TABLE 77. NIHON KESSHO KOGAKU CO., LTD.: PRODUCT PORTFOLIO
TABLE 78. FLUKE CORPORATION: KEY EXECUTIVES
TABLE 79. FLUKE CORPORATION: COMPANY SNAPSHOT
TABLE 80. FLUKE CORPORATION: PRODUCT SEGMENTS
TABLE 81. FLUKE CORPORATION: PRODUCT PORTFOLIO
TABLE 82. BAKER HUGHES (GENERAL ELECTRIC): KEY EXECUTIVES
TABLE 83. BAKER HUGHES (GENERAL ELECTRIC): COMPANY SNAPSHOT
TABLE 84. BAKER HUGHES (GENERAL ELECTRIC): PRODUCT SEGMENTS
TABLE 85. BAKER HUGHES (GENERAL ELECTRIC): PRODUCT PORTFOLIO
TABLE 86. MIRION TECHNOLOGIES INC.: KEY EXECUTIVES
TABLE 87. MIRION TECHNOLOGIES INC.: COMPANY SNAPSHOT
TABLE 88. MIRION TECHNOLOGIES INC.: PRODUCT SEGMENTS
TABLE 89. MIRION TECHNOLOGIES INC.: PRODUCT PORTFOLIO
TABLE 90. PCE INSTRUMENTS: KEY EXECUTIVES
TABLE 91. PCE INSTRUMENTS: COMPANY SNAPSHOT
TABLE 92. PCE INSTRUMENTS: PRODUCT SEGMENTS
TABLE 93. PCE INSTRUMENTS: PRODUCT PORTFOLIO
TABLE 94. CANON ELECTRON TUBES & DEVICES CO.: KEY EXECUTIVES
TABLE 95. CANON ELECTRON TUBES & DEVICES CO.: COMPANY SNAPSHOT
TABLE 96. CANON ELECTRON TUBES & DEVICES CO.: PRODUCT SEGMENTS
TABLE 97. CANON ELECTRON TUBES & DEVICES CO.: PRODUCT PORTFOLIO
TABLE 98. CANON ELECTRON TUBES & DEVICES CO.: KEY STRATERGIES LIST OF FIGURES
FIGURE 01. NANO RADIATION SENSORS MARKET, 2021-2031
FIGURE 02. SEGMENTATION OF NANO RADIATION SENSORS MARKET, 2021-2031
FIGURE 03. TOP INVESTMENT POCKETS IN NANO RADIATION SENSORS MARKET (2022-2031)
FIGURE 04. MODERATE BARGAINING POWER OF SUPPLIERS
FIGURE 05. LOW TO MODERATE BARGAINING POWER OF BUYERS
FIGURE 06. MODERATE THREAT OF SUBSTITUTES
FIGURE 07. MODERATE TO HIGH THREAT OF NEW ENTRANTS
FIGURE 08. MODERATE INTENSITY OF RIVALRY
FIGURE 09. DRIVERS, RESTRAINTS AND OPPORTUNITIES: GLOBALNANO RADIATION SENSORS MARKET
FIGURE 10. NANO RADIATION SENSORS MARKET, BY TYPE, 2021(%)
FIGURE 11. COMPARATIVE SHARE ANALYSIS OF NANO RADIATION SENSORS MARKET FOR SCINTILLATION DETECTORS, BY COUNTRY 2021 AND 2031(%)
FIGURE 12. COMPARATIVE SHARE ANALYSIS OF NANO RADIATION SENSORS MARKET FOR SOLID-STATE DETECTORS, BY COUNTRY 2021 AND 2031(%)
FIGURE 13. COMPARATIVE SHARE ANALYSIS OF NANO RADIATION SENSORS MARKET FOR GAS-FILLED DETECTORS, BY COUNTRY 2021 AND 2031(%)
FIGURE 14. NANO RADIATION SENSORS MARKET, BY APPLICATION, 2021(%)
FIGURE 15. COMPARATIVE SHARE ANALYSIS OF NANO RADIATION SENSORS MARKET FOR HEALTHCARE, BY COUNTRY 2021 AND 2031(%)
FIGURE 16. COMPARATIVE SHARE ANALYSIS OF NANO RADIATION SENSORS MARKET FOR CONSUMER ELECTRONICS, BY COUNTRY 2021 AND 2031(%)
FIGURE 17. COMPARATIVE SHARE ANALYSIS OF NANO RADIATION SENSORS MARKET FOR SECURITY AND DEFENSE, BY COUNTRY 2021 AND 2031(%)
FIGURE 18. COMPARATIVE SHARE ANALYSIS OF NANO RADIATION SENSORS MARKET FOR OIL AND GAS, BY COUNTRY 2021 AND 2031(%)
FIGURE 19. COMPARATIVE SHARE ANALYSIS OF NANO RADIATION SENSORS MARKET FOR POWER PLANTS, BY COUNTRY 2021 AND 2031(%)
FIGURE 20. COMPARATIVE SHARE ANALYSIS OF NANO RADIATION SENSORS MARKET FOR OTHERS, BY COUNTRY 2021 AND 2031(%)
FIGURE 21. NANO RADIATION SENSORS MARKET BY REGION, 2021
FIGURE 22. U.S. NANO RADIATION SENSORS MARKET, 2021-2031 ($MILLION)
FIGURE 23. CANADA NANO RADIATION SENSORS MARKET, 2021-2031 ($MILLION)
FIGURE 24. MEXICO NANO RADIATION SENSORS MARKET, 2021-2031 ($MILLION)
FIGURE 25. UK NANO RADIATION SENSORS MARKET, 2021-2031 ($MILLION)
FIGURE 26. GERMANY NANO RADIATION SENSORS MARKET, 2021-2031 ($MILLION)
FIGURE 27. FRANCE NANO RADIATION SENSORS MARKET, 2021-2031 ($MILLION)
FIGURE 28. REST OF EUROPE NANO RADIATION SENSORS MARKET, 2021-2031 ($MILLION)
FIGURE 29. CHINA NANO RADIATION SENSORS MARKET, 2021-2031 ($MILLION)
FIGURE 30. JAPAN NANO RADIATION SENSORS MARKET, 2021-2031 ($MILLION)
FIGURE 31. INDIA NANO RADIATION SENSORS MARKET, 2021-2031 ($MILLION)
FIGURE 32. SOUTH KOREA NANO RADIATION SENSORS MARKET, 2021-2031 ($MILLION)
FIGURE 33. REST OF ASIA-PACIFIC NANO RADIATION SENSORS MARKET, 2021-2031 ($MILLION)
FIGURE 34. LATIN AMERICA NANO RADIATION SENSORS MARKET, 2021-2031 ($MILLION)
FIGURE 35. MIDDLE EAST NANO RADIATION SENSORS MARKET, 2021-2031 ($MILLION)
FIGURE 36. AFRICA NANO RADIATION SENSORS MARKET, 2021-2031 ($MILLION)
FIGURE 37. TOP WINNING STRATEGIES, BY YEAR
FIGURE 38. TOP WINNING STRATEGIES, BY DEVELOPMENT
FIGURE 39. TOP WINNING STRATEGIES, BY COMPANY
FIGURE 40. PRODUCT MAPPING OF TOP 10 PLAYERS
FIGURE 41. COMPETITIVE DASHBOARD
FIGURE 42. COMPETITIVE HEATMAP: NANO RADIATION SENSORS MARKET
FIGURE 43. TOP PLAYER POSITIONING, 2021
FIGURE 44. FIRST SENSOR AG: NET SALES, 2020-2022 ($MILLION)
FIGURE 45. FIRST SENSOR AG: RESEARCH & DEVELOPMENT EXPENDITURE, 2020-2022 ($MILLION)
FIGURE 46. FIRST SENSOR AG: REVENUE SHARE BY REGION, 2022 (%)
FIGURE 47. HAMAMASTU PHOTONICS K.K: NET REVENUE, 2020-2022 ($MILLION)
FIGURE 48. HAMAMASTU PHOTONICS K.K: RESEARCH & DEVELOPMENT EXPENDITURE, 2020-2022 ($MILLION)
FIGURE 49. HAMAMASTU PHOTONICS K.K: REVENUE SHARE BY REGION, 2022 (%)
FIGURE 50. HAMAMASTU PHOTONICS K.K: REVENUE SHARE BY SEGMENT, 2022 (%)
FIGURE 51. THERMO FISCHER SCIENTIFIC INC.: NET SALES, 2019-2021 ($MILLION)
FIGURE 52. THERMO FISCHER SCIENTIFIC INC.: RESEARCH & DEVELOPMENT EXPENDITURE, 2019-2021 ($MILLION)
FIGURE 53. THERMO FISCHER SCIENTIFIC INC.: REVENUE SHARE BY SEGMENT, 2021 (%)
FIGURE 54. THERMO FISCHER SCIENTIFIC INC.: REVENUE SHARE BY REGION, 2021 (%)
FIGURE 55. KROMEK GROUP PLC: NET SALES, 2020-2022 ($MILLION)
FIGURE 56. KROMEK GROUP PLC: RESEARCH & DEVELOPMENT EXPENDITURE, 2020-2022 ($MILLION)
FIGURE 57. KROMEK GROUP PLC: REVENUE SHARE BY REGION, 2022 (%)
FIGURE 58. BAKER HUGHES (GENERAL ELECTRIC): NET REVENUE, 2020-2022 ($MILLION)
FIGURE 59. BAKER HUGHES (GENERAL ELECTRIC): RESEARCH & DEVELOPMENT EXPENDITURE, 2020-2022 ($MILLION)
FIGURE 60. BAKER HUGHES (GENERAL ELECTRIC): REVENUE SHARE BY SEGMENT, 2022 (%)
FIGURE 61. BAKER HUGHES (GENERAL ELECTRIC): REVENUE SHARE BY REGION, 2022 (%)
FIGURE 62. MIRION TECHNOLOGIES INC.: NET SALES, 2020-2022 ($MILLION)
FIGURE 63. MIRION TECHNOLOGIES INC.: RESEARCH & DEVELOPMENT EXPENDITURE, 2020-2022 ($MILLION)
FIGURE 64. MIRION TECHNOLOGIES INC.: REVENUE SHARE BY REGION, 2022 (%)
FIGURE 65. MIRION TECHNOLOGIES INC.: REVENUE SHARE BY SEGMENT, 2022 (%)
FIGURE 66. CANON ELECTRON TUBES & DEVICES CO.: NET SALES, 2019-2021 ($MILLION)
FIGURE 67. CANON ELECTRON TUBES & DEVICES CO.: RESEARCH & DEVELOPMENT EXPENDITURE, 2019-2021 ($MILLION)
FIGURE 68. CANON ELECTRON TUBES & DEVICES CO.: REVENUE SHARE BY SEGMENT, 2021 (%)
FIGURE 69. CANON ELECTRON TUBES & DEVICES CO.: REVENUE SHARE BY REGION, 2021 (%
SELECT A FORMAT
Added to Cart
Electronic (PDF)

$5730

This license allows only one user to access the PDF.
Electronic (PDF)

$6450

This license allows 1 - 5 user to access the PDF, license is suitable for small groups of 5 users working together
Electronic (PDF)

$9600

This license allows users/teams in a same Enterprise to use this report, various departments within an enterpise can use this report
Electronic (PDF)

$3840

This license just provides quantitative data in a excel sheet
Add to Cart
Buy Now (15% Discount)

OUR CUSTOMER

Seventh Sense AI

SIMILAR REPORTS


RELATED REPORTS

Global FPD Robots Market Research Report 2024

120 Pages
Type: Report
Code: QYRE-Auto-13C5731
Mon Apr 29 00:00:00 UTC 2024

Add to Cart

Global Composite Current Collector Market Research Report 2024

120 Pages
Type: Report
Code: QYRE-Auto-39C10224
Mon Apr 29 00:00:00 UTC 2024

Add to Cart

Global Mobile Robot Positioning and Navigation System Market Research Report 2024

120 Pages
Type: Report
Code: QYRE-Auto-33D9199
Mon Apr 29 00:00:00 UTC 2024

Add to Cart

Global Intelligent Mobile Robotics Market Research Report 2024

120 Pages
Type: Report
Code: QYRE-Auto-24U9163
Mon Apr 29 00:00:00 UTC 2024

Add to Cart