0
U.S. (TOLL FREE)
+1 (315) 215-3225
Automative

0
U.S. (TOLL FREE)
+1 (315) 215-3225
Cannabis Market By Product Type (Buds or Marijuana Flower, Cannabis Extracts), By Compound (THC-dominant, Balanced THC and CBD, CBD-dominant), By Application (Medical, Recreational, Others): Global Opportunity Analysis and Industry Forecast, 2021-2031
Published Date: September 2022
|
Report Code: ALLI-Auto-0W815
Home | Market Reports | Sensitive Subjects
Cannabis Market By Product Type Buds or Marijuana Flower Cannabis Extracts By Compound THC dominant Balanced THC and CBD CBD dominant By Application Medical Recreational Others Global Opportunity Analysis and Industry Forecast 2021 2031
BUY CHAPTERS

Cannabis Market By Product Type (Buds or Marijuana Flower, Cannabis Extracts), By Compound (THC-dominant, Balanced THC and CBD, CBD-dominant), By Application (Medical, Recreational, Others): Global Opportunity Analysis and Industry Forecast, 2021-2031

Code: ALLI-Auto-0W815
Report
September 2022
Pages:250
Allied Market Research
Buy Now with 15% Discount
DESCRIPTION
TABLE OF CONTENT
TABLES & FIGURES

Cannabis Market Size

According to a new report published by , titled, “Cannabis Market," The cannabis market size was valued at $25.7 billion in 2021, and is estimated to reach $148.9 billion by 2031, growing at a CAGR of 20.1% from 2022 to 2031.

Cannabis Market

Cannabis Market

For the treatment of a number of disorders, doctors recommend cannabis, often known as marijuana. Due to production and political constraints, the use of cannabis as medicine has not undergone extensive testing, which has limited the amount of clinical research that can be done to determine the safety and effectiveness of utilizing cannabis to treat ailments.
The key factors driving the cannabis market growth are the legalization of marijuana in many different countries, the rise in consumer knowledge of the drug's health advantages, and its expanding medicinal uses, including the treatment of a wide range of ailments and symptoms. The medicinal cannabis business is also expanding as a result of increased R&D activity and the creation of novel products. The market's expansion is hampered by a number of major issues, including a complex legislative framework for cannabis use and cannabis' societal stigma. Instead, the Asia-Pacific region's legalization of cannabis presents a business opportunity for the industry's producers.
According to cannabis market analysis, the global cannabis market is analyzed on the basis of product type, compound, application, and region. By product type, the market is divided into buds or marijuana flower and cannabis extracts. Among these, the cannabis extracts segment occupied the major cannabis market share of the market in 2021, and is projected to maintain its dominance during the cannabis market forecast period. Cannabis extracts are concentrates created using a solvent. The terms "extract" and "concentrate" are occasionally used synonymously, despite the fact that this is erroneous. All extracts are concentrates, but not all concentrates are extracts. Butane, propane, ethanol, and supercritical carbon dioxide are the most typical solvents utilized to create a cannabis extract (CO2). All these cannabis market trends are creating cannabis market opportunities. 
By compound, the cannabis market is divided into THC-dominant, balanced THC & CBD, and CBD-dominant. The CBD-dominant segment is growing at a moderate rate during the forecast period. Cannabidiol, or CBD, is the second most common active component in marijuana (marijuana). While CBD is a crucial component of medicinal marijuana, it is either produced in a lab or is taken straight from the hemp plant, a relative of the marijuana plant.
By application, it is classified into medical, recreational, and others. The recreational segment is anticipated to grow at highest CAGR during the forecast period. Cannabis is used recreationally when it is consumed for pleasure rather than for medical reasons. The use of marijuana for medicinal purposes, which entails using the drug as directed to treat certain medical diseases' symptoms, can be contrasted with marijuana use for recreational purposes.
The region that dominated the global cannabis market in 2021 was North America, and this dominance is anticipated to continue throughout the forecast period. This was attributed to the legalization of cannabis for medical and recreational use in both the U.S. and Canada, as well as the rise in the use of medical cannabis in North America to treat a number of diseases linked to changing lifestyles, including epilepsy, cancer, multiple sclerosis, post-traumatic stress disorder, chronic pain, depression, and social anxiety. A further factor supporting the expansion of the market in the region was continued R&D in cannabis's recreational uses.
Exporters in both developed and developing nations faced a number of difficulties as a result of the COVID-19 epidemic. The implementation of lockdown and curfew procedures on a global scale had an impact on both domestic and foreign manufacture of cannabis, which in turn hindered market expansion. As a result, the COVID-19 epidemic had a negative influence on the cannabis market in 2020 as a result of decreased company sales and operations being suspended.
The major players analyzed for global cannabis industry are Aurora Cannabis Inc., Tilray, Canopy Growth Corporation, Cresco Labs, Curaleaf, Ecofibre Limited, Green Thumb Industries, Hexo Corporation, INDIVA, Maricann Inc., Medical Marijuana Inc., MME LLC., Organigram Holdings Inc., Stencocare, and Harvest Health & Recreation, Inc.
KEY FINDINGS OF STUDY
By product type, the cannabis extracts segment was the highest revenue contributor to the market, with $13,794.3 million in 2021, and is estimated to reach $82,309.1 million by 2031, with a CAGR of 20.4%.
By compound, the balanced THC and CBD segment was the highest revenue contributor to the market, with $11,976.5 million in 2021, and is estimated to reach $67,909.8 million by 2031, with a CAGR of 19.8%.
Depending on application, the recreational segment was the highest revenue contributor to the market, with $13,873.2 million in 2021, and is estimated to reach $78,013.0 million by 2031, with a CAGR of 19.7%.
Region wise, North America was the highest revenue contributor, accounting for $22,115.3 million in 2021, and is estimated to reach $104,403.3 million by 2031, with a CAGR of 17.6%.

Overview

The global cannabis market was valued at $25.7 billion in 2021, and is projected to reach $148.9 billion by 2031, growing at a CAGR of 20.1% from 2022 to 2031.Cannabis is a psychoactive narcotic derived from the Cannabis plant, which is also known by various names, including marijuana. The cannabis plant, which is indigenous to Central and South Asia, has been used for ages in traditional remedies as well as a narcotic for both recreational and entheogenic uses. One of the 483 known plant chemicals, comprising at least 65 more cannabinoids, including cannabidiol, tetrahydrocannabinol (THC) is the primary psychoactive component of cannabis (CBD). Cannabis can be consumed as a smoked product, vaped, ingested, or utilized as an extract. Although it can be used for spiritual objectives, cannabis is most frequently utilized for recreational or therapeutic purposes. Although it is legal in some places, it is the most widely used illegal substance in the world. Adults in Zambia, the U.S., Canada, and Nigeria use it the most frequently.
The global cannabis market is analyzed on the basis of product type, compound, application, and region. By product type, the market is divided into buds or marijuana flower and cannabis extracts. By compound, the market is divided into THC-dominant, balanced THC & CBD, and CBD-dominant. By application, it is classified into medical, recreational, and others. Region wise, the market is analyzed across North America (the U.S., Canada, and Mexico), Europe (Germany, Italy, Denmark, Poland, the UK, and the rest of Europe), Asia-Pacific (Thailand, Australia, New Zealand, and the rest of Asia-Pacific), and LAMEA (Brazil, South Africa, and Rest of LAMEA).
The impact of the COVID-19 outbreak was negative on the growth of the global cannabis market. The trade restrictions and lockdown resulted into halting of production and manufacturing units. Conversely, the recovery of the cannabis market is expected in near future. 
The legalization of cannabis in many different places, the growing public knowledge of cannabis' health advantages, and its expanding use in medicine to treat a variety of ailments and symptoms are the main reasons driving the expansion of the global cannabis industry. Additionally, the development of new products and increasing R&D operations support the expansion of the cannabis business. Cannabis use is subject to complicated regulations, and the use of cannabis is stigmatized in society, which restricts market expansion. For companies in the cannabis market, however, the legalization of cannabis in Asia-Pacific is anticipated to present attractive development prospects.
The key players operating in the cannabis market have adopted product launch, business expansion, and merger & acquisition as its key strategies to expand their market share, increase profitability, and remain competitive in the market. The major players operating in the global cannabis market are Aurora Cannabis Inc., Tilray, Canopy Growth Corporation, Cresco Labs, Curaleaf, Ecofibre Limited, Green Thumb Industries, Hexo Corporation, INDIVA, Maricann Inc., Medical Marijuana Inc., MME LLC., Organigram Holdings Inc., Stencocare, and Harvest Health & Recreation, Inc.

Key Benefits For Stakeholders

●This report provides a quantitative analysis of the market segments, current trends, estimations, and dynamics of the cannabis market analysis from 2021 to 2031 to identify the prevailing cannabis market opportunities.
●The market research is offered along with information related to key drivers, restraints, and opportunities.
●Porter's five forces analysis highlights the potency of buyers and suppliers to enable stakeholders make profit-oriented business decisions and strengthen their supplier-buyer network.
●In-depth analysis of the cannabis market segmentation assists to determine the prevailing market opportunities.
●Major countries in each region are mapped according to their revenue contribution to the global market.
●Market player positioning facilitates benchmarking and provides a clear understanding of the present position of the market players.
●The report includes the analysis of the regional as well as global cannabis market trends, key players, market segments, application areas, and market growth strategies.
Key Market Segments
○ Harvest Health & Recreation, In

Scope of Cannabis Market Report

Report Metric Details
Report Name Cannabis Market
Accounted market size in 2021 $ 25.7 billion
Forecasted market size in 2031 $ 148.9 billion
CAGR 20.1%
Base Year 2021
Forecasted years 2024 - 2031
By Product Type ● Buds or Marijuana Flower
● Cannabis Extracts
By Compound ● THC-dominant
● Balanced THC and CBD
● CBD-dominant
By Application ● Medical
● Recreational
● Others
By Region
  • North America (United States, Canada)
  • Europe (Germany, France, UK, Italy, Russia) Rest of Europe
  • Nordic Countries
  • Asia-Pacific (China, Japan, South Korea)
  • Southeast Asia (India, Australia)
  • Rest of Asia
  • Latin America (Mexico, Brazil)
  • Rest of Latin America
  • Middle East & Africa (Turkey, Saudi Arabia, UAE, Rest of MEA)
Forecast units USD million in value
Report coverage Revenue and volume forecast, company share, competitive landscape, growth factors and trends

FAQ for this report

How fast is Cannabis Market growing?

Ans: The Cannabis Market witnessing a CAGR of 20.1% during the forecast period 2024-2031.

What is the Cannabis Market size in 2031?

Ans: The Cannabis Market size in 2031 will be $ 148.9 billion.

What are the Application segmentation covered in the Cannabis Market report?

Ans: The Applications covered in the Cannabis Market report are ● Medical, ● Recreational, ● Others

What are the Type segmentation covered in the Cannabis Market report?

Ans: The Types covered in the Cannabis Market report are ● Buds or Marijuana Flower, ● Cannabis Extracts

CHAPTER 1:INTRODUCTION
1.1.Report description
1.2.Key market segments
1.3.Key benefits to the stakeholders
1.4.Research Methodology
1.4.1.Secondary research
1.4.2.Primary research
1.4.3.Analyst tools and models
CHAPTER 2:EXECUTIVE SUMMARY
2.1.Key findings of the study
2.2.CXO Perspective
CHAPTER 3:MARKET OVERVIEW
3.1.Market definition and scope
3.2.Key findings
3.2.1.Top investment pockets
3.3.Porter’s five forces analysis
3.4.Top player positioning
3.5.Market dynamics
3.5.1.Drivers
3.5.2.Restraints
3.5.3.Opportunities
3.6.COVID-19 Impact Analysis on the market
3.7.Value Chain Analysis
3.8.Market Share Analysis
CHAPTER 4: CANNABIS MARKET, BY PRODUCT TYPE
4.1 Overview
4.1.1 Market size and forecast
4.2 Buds or Marijuana Flower
4.2.1 Key market trends, growth factors and opportunities
4.2.2 Market size and forecast, by region
4.2.3 Market analysis by country
4.3 Cannabis Extracts
4.3.1 Key market trends, growth factors and opportunities
4.3.2 Market size and forecast, by region
4.3.3 Market analysis by country
CHAPTER 5: CANNABIS MARKET, BY COMPOUND
5.1 Overview
5.1.1 Market size and forecast
5.2 THC-dominant
5.2.1 Key market trends, growth factors and opportunities
5.2.2 Market size and forecast, by region
5.2.3 Market analysis by country
5.3 Balanced THC and CBD
5.3.1 Key market trends, growth factors and opportunities
5.3.2 Market size and forecast, by region
5.3.3 Market analysis by country
5.4 CBD-dominant
5.4.1 Key market trends, growth factors and opportunities
5.4.2 Market size and forecast, by region
5.4.3 Market analysis by country
CHAPTER 6: CANNABIS MARKET, BY APPLICATION
6.1 Overview
6.1.1 Market size and forecast
6.2 Medical
6.2.1 Key market trends, growth factors and opportunities
6.2.2 Market size and forecast, by region
6.2.3 Market analysis by country
6.3 Recreational
6.3.1 Key market trends, growth factors and opportunities
6.3.2 Market size and forecast, by region
6.3.3 Market analysis by country
6.4 Others
6.4.1 Key market trends, growth factors and opportunities
6.4.2 Market size and forecast, by region
6.4.3 Market analysis by country
CHAPTER 7: CANNABIS MARKET, BY REGION
7.1 Overview
7.1.1 Market size and forecast
7.2 North America
7.2.1 Key trends and opportunities
7.2.2 North America Market size and forecast, by Product Type
7.2.3 North America Market size and forecast, by Compound
7.2.4 North America Market size and forecast, by Application
7.2.5 North America Market size and forecast, by country
7.2.5.1 U.S.
7.2.5.1.1 Market size and forecast, by Product Type
7.2.5.1.2 Market size and forecast, by Compound
7.2.5.1.3 Market size and forecast, by Application
7.2.5.2 Canada
7.2.5.2.1 Market size and forecast, by Product Type
7.2.5.2.2 Market size and forecast, by Compound
7.2.5.2.3 Market size and forecast, by Application
7.2.5.3 Mexico
7.2.5.3.1 Market size and forecast, by Product Type
7.2.5.3.2 Market size and forecast, by Compound
7.2.5.3.3 Market size and forecast, by Application
7.3 Europe
7.3.1 Key trends and opportunities
7.3.2 Europe Market size and forecast, by Product Type
7.3.3 Europe Market size and forecast, by Compound
7.3.4 Europe Market size and forecast, by Application
7.3.5 Europe Market size and forecast, by country
7.3.5.1 Germany
7.3.5.1.1 Market size and forecast, by Product Type
7.3.5.1.2 Market size and forecast, by Compound
7.3.5.1.3 Market size and forecast, by Application
7.3.5.2 Italy
7.3.5.2.1 Market size and forecast, by Product Type
7.3.5.2.2 Market size and forecast, by Compound
7.3.5.2.3 Market size and forecast, by Application
7.3.5.3 Denmark
7.3.5.3.1 Market size and forecast, by Product Type
7.3.5.3.2 Market size and forecast, by Compound
7.3.5.3.3 Market size and forecast, by Application
7.3.5.4 Poland
7.3.5.4.1 Market size and forecast, by Product Type
7.3.5.4.2 Market size and forecast, by Compound
7.3.5.4.3 Market size and forecast, by Application
7.3.5.5 UK
7.3.5.5.1 Market size and forecast, by Product Type
7.3.5.5.2 Market size and forecast, by Compound
7.3.5.5.3 Market size and forecast, by Application
7.3.5.6 Rest of Europe
7.3.5.6.1 Market size and forecast, by Product Type
7.3.5.6.2 Market size and forecast, by Compound
7.3.5.6.3 Market size and forecast, by Application
7.4 Asia-Pacific
7.4.1 Key trends and opportunities
7.4.2 Asia-Pacific Market size and forecast, by Product Type
7.4.3 Asia-Pacific Market size and forecast, by Compound
7.4.4 Asia-Pacific Market size and forecast, by Application
7.4.5 Asia-Pacific Market size and forecast, by country
7.4.5.1 Thailand
7.4.5.1.1 Market size and forecast, by Product Type
7.4.5.1.2 Market size and forecast, by Compound
7.4.5.1.3 Market size and forecast, by Application
7.4.5.2 Australia
7.4.5.2.1 Market size and forecast, by Product Type
7.4.5.2.2 Market size and forecast, by Compound
7.4.5.2.3 Market size and forecast, by Application
7.4.5.3 New Zealand
7.4.5.3.1 Market size and forecast, by Product Type
7.4.5.3.2 Market size and forecast, by Compound
7.4.5.3.3 Market size and forecast, by Application
7.4.5.4 Rest of Asia-Pacific
7.4.5.4.1 Market size and forecast, by Product Type
7.4.5.4.2 Market size and forecast, by Compound
7.4.5.4.3 Market size and forecast, by Application
7.5 LAMEA
7.5.1 Key trends and opportunities
7.5.2 LAMEA Market size and forecast, by Product Type
7.5.3 LAMEA Market size and forecast, by Compound
7.5.4 LAMEA Market size and forecast, by Application
7.5.5 LAMEA Market size and forecast, by country
7.5.5.1 Brazil
7.5.5.1.1 Market size and forecast, by Product Type
7.5.5.1.2 Market size and forecast, by Compound
7.5.5.1.3 Market size and forecast, by Application
7.5.5.2 South Africa
7.5.5.2.1 Market size and forecast, by Product Type
7.5.5.2.2 Market size and forecast, by Compound
7.5.5.2.3 Market size and forecast, by Application
7.5.5.3 Rest of LAMEA
7.5.5.3.1 Market size and forecast, by Product Type
7.5.5.3.2 Market size and forecast, by Compound
7.5.5.3.3 Market size and forecast, by Application
CHAPTER 8: COMPANY LANDSCAPE
8.1. Introduction
8.2. Top winning strategies
8.3. Product Mapping of Top 10 Player
8.4. Competitive Dashboard
8.5. Competitive Heatmap
8.6. Key developments
CHAPTER 9: COMPANY PROFILES
9.1 Aurora Cannabis Inc.
9.1.1 Company overview
9.1.2 Company snapshot
9.1.3 Operating business segments
9.1.4 Product portfolio
9.1.5 Business performance
9.1.6 Key strategic moves and developments
9.2 Aphria Inc.
9.2.1 Company overview
9.2.2 Company snapshot
9.2.3 Operating business segments
9.2.4 Product portfolio
9.2.5 Business performance
9.2.6 Key strategic moves and developments
9.3 Canopy Growth Corporation
9.3.1 Company overview
9.3.2 Company snapshot
9.3.3 Operating business segments
9.3.4 Product portfolio
9.3.5 Business performance
9.3.6 Key strategic moves and developments
9.4 cresco labs
9.4.1 Company overview
9.4.2 Company snapshot
9.4.3 Operating business segments
9.4.4 Product portfolio
9.4.5 Business performance
9.4.6 Key strategic moves and developments
9.5 Curaleaf Holdings
9.5.1 Company overview
9.5.2 Company snapshot
9.5.3 Operating business segments
9.5.4 Product portfolio
9.5.5 Business performance
9.5.6 Key strategic moves and developments
9.6 Ecofibre Limited
9.6.1 Company overview
9.6.2 Company snapshot
9.6.3 Operating business segments
9.6.4 Product portfolio
9.6.5 Business performance
9.6.6 Key strategic moves and developments
9.7 green thumb industries (gti)
9.7.1 Company overview
9.7.2 Company snapshot
9.7.3 Operating business segments
9.7.4 Product portfolio
9.7.5 Business performance
9.7.6 Key strategic moves and developments
9.8 Harvest Health and Recreation
9.8.1 Company overview
9.8.2 Company snapshot
9.8.3 Operating business segments
9.8.4 Product portfolio
9.8.5 Business performance
9.8.6 Key strategic moves and developments
9.9 HEXO Corp.
9.9.1 Company overview
9.9.2 Company snapshot
9.9.3 Operating business segments
9.9.4 Product portfolio
9.9.5 Business performance
9.9.6 Key strategic moves and developments
9.10 Indiva
9.10.1 Company overview
9.10.2 Company snapshot
9.10.3 Operating business segments
9.10.4 Product portfolio
9.10.5 Business performance
9.10.6 Key strategic moves and developments
9.11 Maricann Group Inc.
9.11.1 Company overview
9.11.2 Company snapshot
9.11.3 Operating business segments
9.11.4 Product portfolio
9.11.5 Business performance
9.11.6 Key strategic moves and developments
9.12 Medical Marijuana Inc.
9.12.1 Company overview
9.12.2 Company snapshot
9.12.3 Operating business segments
9.12.4 Product portfolio
9.12.5 Business performance
9.12.6 Key strategic moves and developments
9.13 MedMen
9.13.1 Company overview
9.13.2 Company snapshot
9.13.3 Operating business segments
9.13.4 Product portfolio
9.13.5 Business performance
9.13.6 Key strategic moves and developments
9.14 Organigrams Holding Inc.
9.14.1 Company overview
9.14.2 Company snapshot
9.14.3 Operating business segments
9.14.4 Product portfolio
9.14.5 Business performance
9.14.6 Key strategic moves and developments
9.15 Stenocare
9.15.1 Company overview
9.15.2 Company snapshot
9.15.3 Operating business segments
9.15.4 Product portfolio
9.15.5 Business performance
9.15.6 Key strategic moves and development
LIST OF TABLES
TABLE 1. GLOBAL CANNABIS MARKET, BY PRODUCT TYPE, 2021-2031 ($MILLION)
TABLE 2. CANNABIS MARKET SIZE, FOR BUDS OR MARIJUANA FLOWER, BY REGION, 2021-2031 ($MILLION)
TABLE 3. CANNABIS MARKET FOR BUDS OR MARIJUANA FLOWER, BY COUNTRY, 2021-2031 ($MILLION)
TABLE 4. CANNABIS MARKET SIZE, FOR CANNABIS EXTRACTS, BY REGION, 2021-2031 ($MILLION)
TABLE 5. CANNABIS MARKET FOR CANNABIS EXTRACTS, BY COUNTRY, 2021-2031 ($MILLION)
TABLE 6. GLOBAL CANNABIS MARKET, BY COMPOUND, 2021-2031 ($MILLION)
TABLE 7. CANNABIS MARKET SIZE, FOR THC-DOMINANT, BY REGION, 2021-2031 ($MILLION)
TABLE 8. CANNABIS MARKET FOR THC-DOMINANT, BY COUNTRY, 2021-2031 ($MILLION)
TABLE 9. CANNABIS MARKET SIZE, FOR BALANCED THC AND CBD, BY REGION, 2021-2031 ($MILLION)
TABLE 10. CANNABIS MARKET FOR BALANCED THC AND CBD, BY COUNTRY, 2021-2031 ($MILLION)
TABLE 11. CANNABIS MARKET SIZE, FOR CBD-DOMINANT, BY REGION, 2021-2031 ($MILLION)
TABLE 12. CANNABIS MARKET FOR CBD-DOMINANT, BY COUNTRY, 2021-2031 ($MILLION)
TABLE 13. GLOBAL CANNABIS MARKET, BY APPLICATION, 2021-2031 ($MILLION)
TABLE 14. CANNABIS MARKET SIZE, FOR MEDICAL, BY REGION, 2021-2031 ($MILLION)
TABLE 15. CANNABIS MARKET FOR MEDICAL, BY COUNTRY, 2021-2031 ($MILLION)
TABLE 16. CANNABIS MARKET SIZE, FOR RECREATIONAL, BY REGION, 2021-2031 ($MILLION)
TABLE 17. CANNABIS MARKET FOR RECREATIONAL, BY COUNTRY, 2021-2031 ($MILLION)
TABLE 18. CANNABIS MARKET SIZE, FOR OTHERS, BY REGION, 2021-2031 ($MILLION)
TABLE 19. CANNABIS MARKET FOR OTHERS, BY COUNTRY, 2021-2031 ($MILLION)
TABLE 20. CANNABIS MARKET, BY REGION, 2021-2031 ($MILLION)
TABLE 21. NORTH AMERICA CANNABIS MARKET, BY PRODUCT TYPE, 2021-2031 ($MILLION)
TABLE 22. NORTH AMERICA CANNABIS MARKET, BY COMPOUND, 2021-2031 ($MILLION)
TABLE 23. NORTH AMERICA CANNABIS MARKET, BY APPLICATION, 2021-2031 ($MILLION)
TABLE 24. NORTH AMERICA CANNABIS MARKET, BY COUNTRY, 2021-2031 ($MILLION)
TABLE 25. U.S. CANNABIS MARKET, BY PRODUCT TYPE, 2021-2031 ($MILLION)
TABLE 26. U.S. CANNABIS MARKET, BY COMPOUND, 2021-2031 ($MILLION)
TABLE 27. U.S. CANNABIS MARKET, BY APPLICATION, 2021-2031 ($MILLION)
TABLE 28. CANADA CANNABIS MARKET, BY PRODUCT TYPE, 2021-2031 ($MILLION)
TABLE 29. CANADA CANNABIS MARKET, BY COMPOUND, 2021-2031 ($MILLION)
TABLE 30. CANADA CANNABIS MARKET, BY APPLICATION, 2021-2031 ($MILLION)
TABLE 31. MEXICO CANNABIS MARKET, BY PRODUCT TYPE, 2021-2031 ($MILLION)
TABLE 32. MEXICO CANNABIS MARKET, BY COMPOUND, 2021-2031 ($MILLION)
TABLE 33. MEXICO CANNABIS MARKET, BY APPLICATION, 2021-2031 ($MILLION)
TABLE 34. EUROPE CANNABIS MARKET, BY PRODUCT TYPE, 2021-2031 ($MILLION)
TABLE 35. EUROPE CANNABIS MARKET, BY COMPOUND, 2021-2031 ($MILLION)
TABLE 36. EUROPE CANNABIS MARKET, BY APPLICATION, 2021-2031 ($MILLION)
TABLE 37. EUROPE CANNABIS MARKET, BY COUNTRY, 2021-2031 ($MILLION)
TABLE 38. GERMANY CANNABIS MARKET, BY PRODUCT TYPE, 2021-2031 ($MILLION)
TABLE 39. GERMANY CANNABIS MARKET, BY COMPOUND, 2021-2031 ($MILLION)
TABLE 40. GERMANY CANNABIS MARKET, BY APPLICATION, 2021-2031 ($MILLION)
TABLE 41. ITALY CANNABIS MARKET, BY PRODUCT TYPE, 2021-2031 ($MILLION)
TABLE 42. ITALY CANNABIS MARKET, BY COMPOUND, 2021-2031 ($MILLION)
TABLE 43. ITALY CANNABIS MARKET, BY APPLICATION, 2021-2031 ($MILLION)
TABLE 44. DENMARK CANNABIS MARKET, BY PRODUCT TYPE, 2021-2031 ($MILLION)
TABLE 45. DENMARK CANNABIS MARKET, BY COMPOUND, 2021-2031 ($MILLION)
TABLE 46. DENMARK CANNABIS MARKET, BY APPLICATION, 2021-2031 ($MILLION)
TABLE 47. POLAND CANNABIS MARKET, BY PRODUCT TYPE, 2021-2031 ($MILLION)
TABLE 48. POLAND CANNABIS MARKET, BY COMPOUND, 2021-2031 ($MILLION)
TABLE 49. POLAND CANNABIS MARKET, BY APPLICATION, 2021-2031 ($MILLION)
TABLE 50. UK CANNABIS MARKET, BY PRODUCT TYPE, 2021-2031 ($MILLION)
TABLE 51. UK CANNABIS MARKET, BY COMPOUND, 2021-2031 ($MILLION)
TABLE 52. UK CANNABIS MARKET, BY APPLICATION, 2021-2031 ($MILLION)
TABLE 53. REST OF EUROPE CANNABIS MARKET, BY PRODUCT TYPE, 2021-2031 ($MILLION)
TABLE 54. REST OF EUROPE CANNABIS MARKET, BY COMPOUND, 2021-2031 ($MILLION)
TABLE 55. REST OF EUROPE CANNABIS MARKET, BY APPLICATION, 2021-2031 ($MILLION)
TABLE 56. ASIA-PACIFIC CANNABIS MARKET, BY PRODUCT TYPE, 2021-2031 ($MILLION)
TABLE 57. ASIA-PACIFIC CANNABIS MARKET, BY COMPOUND, 2021-2031 ($MILLION)
TABLE 58. ASIA-PACIFIC CANNABIS MARKET, BY APPLICATION, 2021-2031 ($MILLION)
TABLE 59. ASIA-PACIFIC CANNABIS MARKET, BY COUNTRY, 2021-2031 ($MILLION)
TABLE 60. THAILAND CANNABIS MARKET, BY PRODUCT TYPE, 2021-2031 ($MILLION)
TABLE 61. THAILAND CANNABIS MARKET, BY COMPOUND, 2021-2031 ($MILLION)
TABLE 62. THAILAND CANNABIS MARKET, BY APPLICATION, 2021-2031 ($MILLION)
TABLE 63. AUSTRALIA CANNABIS MARKET, BY PRODUCT TYPE, 2021-2031 ($MILLION)
TABLE 64. AUSTRALIA CANNABIS MARKET, BY COMPOUND, 2021-2031 ($MILLION)
TABLE 65. AUSTRALIA CANNABIS MARKET, BY APPLICATION, 2021-2031 ($MILLION)
TABLE 66. NEW ZEALAND CANNABIS MARKET, BY PRODUCT TYPE, 2021-2031 ($MILLION)
TABLE 67. NEW ZEALAND CANNABIS MARKET, BY COMPOUND, 2021-2031 ($MILLION)
TABLE 68. NEW ZEALAND CANNABIS MARKET, BY APPLICATION, 2021-2031 ($MILLION)
TABLE 69. REST OF ASIA-PACIFIC CANNABIS MARKET, BY PRODUCT TYPE, 2021-2031 ($MILLION)
TABLE 70. REST OF ASIA-PACIFIC CANNABIS MARKET, BY COMPOUND, 2021-2031 ($MILLION)
TABLE 71. REST OF ASIA-PACIFIC CANNABIS MARKET, BY APPLICATION, 2021-2031 ($MILLION)
TABLE 72. LAMEA CANNABIS MARKET, BY PRODUCT TYPE, 2021-2031 ($MILLION)
TABLE 73. LAMEA CANNABIS MARKET, BY COMPOUND, 2021-2031 ($MILLION)
TABLE 74. LAMEA CANNABIS MARKET, BY APPLICATION, 2021-2031 ($MILLION)
TABLE 75. LAMEA CANNABIS MARKET, BY COUNTRY, 2021-2031 ($MILLION)
TABLE 76. BRAZIL CANNABIS MARKET, BY PRODUCT TYPE, 2021-2031 ($MILLION)
TABLE 77. BRAZIL CANNABIS MARKET, BY COMPOUND, 2021-2031 ($MILLION)
TABLE 78. BRAZIL CANNABIS MARKET, BY APPLICATION, 2021-2031 ($MILLION)
TABLE 79. SOUTH AFRICA CANNABIS MARKET, BY PRODUCT TYPE, 2021-2031 ($MILLION)
TABLE 80. SOUTH AFRICA CANNABIS MARKET, BY COMPOUND, 2021-2031 ($MILLION)
TABLE 81. SOUTH AFRICA CANNABIS MARKET, BY APPLICATION, 2021-2031 ($MILLION)
TABLE 82. REST OF LAMEA CANNABIS MARKET, BY PRODUCT TYPE, 2021-2031 ($MILLION)
TABLE 83. REST OF LAMEA CANNABIS MARKET, BY COMPOUND, 2021-2031 ($MILLION)
TABLE 84. REST OF LAMEA CANNABIS MARKET, BY APPLICATION, 2021-2031 ($MILLION)
TABLE 85.AURORA CANNABIS INC.: COMPANY SNAPSHOT
TABLE 86.AURORA CANNABIS INC.: OPERATING SEGMENTS
TABLE 87.AURORA CANNABIS INC.: PRODUCT PORTFOLIO
TABLE 88.AURORA CANNABIS INC.: NET SALES,
TABLE 89.AURORA CANNABIS INC.: KEY STRATERGIES
TABLE 90.APHRIA INC.: COMPANY SNAPSHOT
TABLE 91.APHRIA INC.: OPERATING SEGMENTS
TABLE 92.APHRIA INC.: PRODUCT PORTFOLIO
TABLE 93.APHRIA INC.: NET SALES,
TABLE 94.APHRIA INC.: KEY STRATERGIES
TABLE 95.CANOPY GROWTH CORPORATION: COMPANY SNAPSHOT
TABLE 96.CANOPY GROWTH CORPORATION: OPERATING SEGMENTS
TABLE 97.CANOPY GROWTH CORPORATION: PRODUCT PORTFOLIO
TABLE 98.CANOPY GROWTH CORPORATION: NET SALES,
TABLE 99.CANOPY GROWTH CORPORATION: KEY STRATERGIES
TABLE 100.CRESCO LABS: COMPANY SNAPSHOT
TABLE 101.CRESCO LABS: OPERATING SEGMENTS
TABLE 102.CRESCO LABS: PRODUCT PORTFOLIO
TABLE 103.CRESCO LABS: NET SALES,
TABLE 104.CRESCO LABS: KEY STRATERGIES
TABLE 105.CURALEAF HOLDINGS: COMPANY SNAPSHOT
TABLE 106.CURALEAF HOLDINGS: OPERATING SEGMENTS
TABLE 107.CURALEAF HOLDINGS: PRODUCT PORTFOLIO
TABLE 108.CURALEAF HOLDINGS: NET SALES,
TABLE 109.CURALEAF HOLDINGS: KEY STRATERGIES
TABLE 110.ECOFIBRE LIMITED: COMPANY SNAPSHOT
TABLE 111.ECOFIBRE LIMITED: OPERATING SEGMENTS
TABLE 112.ECOFIBRE LIMITED: PRODUCT PORTFOLIO
TABLE 113.ECOFIBRE LIMITED: NET SALES,
TABLE 114.ECOFIBRE LIMITED: KEY STRATERGIES
TABLE 115.GREEN THUMB INDUSTRIES (GTI): COMPANY SNAPSHOT
TABLE 116.GREEN THUMB INDUSTRIES (GTI): OPERATING SEGMENTS
TABLE 117.GREEN THUMB INDUSTRIES (GTI): PRODUCT PORTFOLIO
TABLE 118.GREEN THUMB INDUSTRIES (GTI): NET SALES,
TABLE 119.GREEN THUMB INDUSTRIES (GTI): KEY STRATERGIES
TABLE 120.HARVEST HEALTH AND RECREATION: COMPANY SNAPSHOT
TABLE 121.HARVEST HEALTH AND RECREATION: OPERATING SEGMENTS
TABLE 122.HARVEST HEALTH AND RECREATION: PRODUCT PORTFOLIO
TABLE 123.HARVEST HEALTH AND RECREATION: NET SALES,
TABLE 124.HARVEST HEALTH AND RECREATION: KEY STRATERGIES
TABLE 125.HEXO CORP.: COMPANY SNAPSHOT
TABLE 126.HEXO CORP.: OPERATING SEGMENTS
TABLE 127.HEXO CORP.: PRODUCT PORTFOLIO
TABLE 128.HEXO CORP.: NET SALES,
TABLE 129.HEXO CORP.: KEY STRATERGIES
TABLE 130.INDIVA: COMPANY SNAPSHOT
TABLE 131.INDIVA: OPERATING SEGMENTS
TABLE 132.INDIVA: PRODUCT PORTFOLIO
TABLE 133.INDIVA: NET SALES,
TABLE 134.INDIVA: KEY STRATERGIES
TABLE 135.MARICANN GROUP INC.: COMPANY SNAPSHOT
TABLE 136.MARICANN GROUP INC.: OPERATING SEGMENTS
TABLE 137.MARICANN GROUP INC.: PRODUCT PORTFOLIO
TABLE 138.MARICANN GROUP INC.: NET SALES,
TABLE 139.MARICANN GROUP INC.: KEY STRATERGIES
TABLE 140.MEDICAL MARIJUANA INC.: COMPANY SNAPSHOT
TABLE 141.MEDICAL MARIJUANA INC.: OPERATING SEGMENTS
TABLE 142.MEDICAL MARIJUANA INC.: PRODUCT PORTFOLIO
TABLE 143.MEDICAL MARIJUANA INC.: NET SALES,
TABLE 144.MEDICAL MARIJUANA INC.: KEY STRATERGIES
TABLE 145.MEDMEN: COMPANY SNAPSHOT
TABLE 146.MEDMEN: OPERATING SEGMENTS
TABLE 147.MEDMEN: PRODUCT PORTFOLIO
TABLE 148.MEDMEN: NET SALES,
TABLE 149.MEDMEN: KEY STRATERGIES
TABLE 150.ORGANIGRAMS HOLDING INC.: COMPANY SNAPSHOT
TABLE 151.ORGANIGRAMS HOLDING INC.: OPERATING SEGMENTS
TABLE 152.ORGANIGRAMS HOLDING INC.: PRODUCT PORTFOLIO
TABLE 153.ORGANIGRAMS HOLDING INC.: NET SALES,
TABLE 154.ORGANIGRAMS HOLDING INC.: KEY STRATERGIES
TABLE 155.STENOCARE: COMPANY SNAPSHOT
TABLE 156.STENOCARE: OPERATING SEGMENTS
TABLE 157.STENOCARE: PRODUCT PORTFOLIO
TABLE 158.STENOCARE: NET SALES,
TABLE 159.STENOCARE: KEY STRATERGIES LIST OF FIGURES
FIGURE 1.CANNABIS MARKET SEGMENTATION
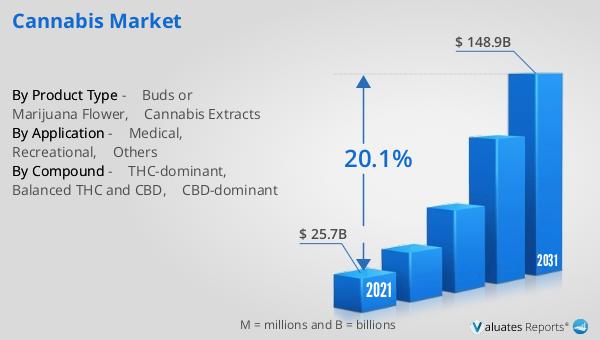
FIGURE 2.CANNABIS MARKET,2021-2031
FIGURE 3.CANNABIS MARKET,2021-2031
FIGURE 4. TOP INVESTMENT POCKETS, BY REGION
FIGURE 5.PORTER FIVE-1
FIGURE 6.PORTER FIVE-2
FIGURE 7.PORTER FIVE-3
FIGURE 8.PORTER FIVE-4
FIGURE 9.PORTER FIVE-5
FIGURE 10.TOP PLAYER POSITIONING
FIGURE 11.CANNABIS MARKET:DRIVERS, RESTRAINTS AND OPPORTUNITIES
FIGURE 12.VALUE CHAIN ANALYSIS
FIGURE 13.MARKET SHARE ANALYSIS
FIGURE 14.CANNABIS MARKET,BY PRODUCT TYPE,2021(%)
FIGURE 15.COMPARATIVE SHARE ANALYSIS OF BUDS OR MARIJUANA FLOWER CANNABIS MARKET,2021-2031(%)
FIGURE 16.COMPARATIVE SHARE ANALYSIS OF CANNABIS EXTRACTS CANNABIS MARKET,2021-2031(%)
FIGURE 17.CANNABIS MARKET,BY COMPOUND,2021(%)
FIGURE 18.COMPARATIVE SHARE ANALYSIS OF THC-DOMINANT CANNABIS MARKET,2021-2031(%)
FIGURE 19.COMPARATIVE SHARE ANALYSIS OF BALANCED THC AND CBD CANNABIS MARKET,2021-2031(%)
FIGURE 20.COMPARATIVE SHARE ANALYSIS OF CBD-DOMINANT CANNABIS MARKET,2021-2031(%)
FIGURE 21.CANNABIS MARKET,BY APPLICATION,2021(%)
FIGURE 22.COMPARATIVE SHARE ANALYSIS OF MEDICAL CANNABIS MARKET,2021-2031(%)
FIGURE 23.COMPARATIVE SHARE ANALYSIS OF RECREATIONAL CANNABIS MARKET,2021-2031(%)
FIGURE 24.COMPARATIVE SHARE ANALYSIS OF OTHERS CANNABIS MARKET,2021-2031(%)
FIGURE 25.CANNABIS MARKET BY REGION,2021
FIGURE 26.U.S. CANNABIS MARKET,2021-2031($MILLION)
FIGURE 27.CANADA CANNABIS MARKET,2021-2031($MILLION)
FIGURE 28.MEXICO CANNABIS MARKET,2021-2031($MILLION)
FIGURE 29.GERMANY CANNABIS MARKET,2021-2031($MILLION)
FIGURE 30.ITALY CANNABIS MARKET,2021-2031($MILLION)
FIGURE 31.DENMARK CANNABIS MARKET,2021-2031($MILLION)
FIGURE 32.POLAND CANNABIS MARKET,2021-2031($MILLION)
FIGURE 33.UK CANNABIS MARKET,2021-2031($MILLION)
FIGURE 34.REST OF EUROPE CANNABIS MARKET,2021-2031($MILLION)
FIGURE 35.THAILAND CANNABIS MARKET,2021-2031($MILLION)
FIGURE 36.AUSTRALIA CANNABIS MARKET,2021-2031($MILLION)
FIGURE 37.NEW ZEALAND CANNABIS MARKET,2021-2031($MILLION)
FIGURE 38.REST OF ASIA-PACIFIC CANNABIS MARKET,2021-2031($MILLION)
FIGURE 39.BRAZIL CANNABIS MARKET,2021-2031($MILLION)
FIGURE 40.SOUTH AFRICA CANNABIS MARKET,2021-2031($MILLION)
FIGURE 41.REST OF LAMEA CANNABIS MARKET,2021-2031($MILLION)
FIGURE 42. TOP WINNING STRATEGIES, BY YEAR
FIGURE 43. TOP WINNING STRATEGIES, BY DEVELOPMENT
FIGURE 44. TOP WINNING STRATEGIES, BY COMPANY
FIGURE 45.PRODUCT MAPPING OF TOP 10 PLAYERS
FIGURE 46.COMPETITIVE DASHBOARD
FIGURE 47.COMPETITIVE HEATMAP OF TOP 10 KEY PLAYERS
FIGURE 48.AURORA CANNABIS INC..: NET SALES ,($MILLION)
FIGURE 49.APHRIA INC..: NET SALES ,($MILLION)
FIGURE 50.CANOPY GROWTH CORPORATION.: NET SALES ,($MILLION)
FIGURE 51.CRESCO LABS.: NET SALES ,($MILLION)
FIGURE 52.CURALEAF HOLDINGS.: NET SALES ,($MILLION)
FIGURE 53.ECOFIBRE LIMITED.: NET SALES ,($MILLION)
FIGURE 54.GREEN THUMB INDUSTRIES (GTI).: NET SALES ,($MILLION)
FIGURE 55.HARVEST HEALTH AND RECREATION.: NET SALES ,($MILLION)
FIGURE 56.HEXO CORP..: NET SALES ,($MILLION)
FIGURE 57.INDIVA.: NET SALES ,($MILLION)
FIGURE 58.MARICANN GROUP INC..: NET SALES ,($MILLION)
FIGURE 59.MEDICAL MARIJUANA INC..: NET SALES ,($MILLION)
FIGURE 60.MEDMEN.: NET SALES ,($MILLION)
FIGURE 61.ORGANIGRAMS HOLDING INC..: NET SALES ,($MILLION)
FIGURE 62.STENOCARE.: NET SALES ,($MILLION
SELECT A FORMAT
Added to Cart
Electronic (PDF)

$5730

This license allows only one user to access the PDF.
Electronic (PDF)

$6450

This license allows 1 - 5 user to access the PDF, license is suitable for small groups of 5 users working together
Electronic (PDF)

$9600

This license allows users/teams in a same Enterprise to use this report, various departments within an enterpise can use this report
Electronic (PDF)

$3840

This license just provides quantitative data in a excel sheet
Add to Cart
Buy Now (15% Discount)

OUR CUSTOMER

Nano String

SIMILAR REPORTS


RELATED REPORTS

Global Directed Energy Weapon Systems Market Research Report 2024

120 Pages
Type: Report
Code: QYRE-Auto-14D5837
Mon Apr 29 00:00:00 UTC 2024

Add to Cart

Global Flash Suppressor Market Research Report 2024

120 Pages
Type: Report
Code: QYRE-Auto-37V7518
Sun Apr 28 00:00:00 UTC 2024

Add to Cart

Global Controlled Release Cannabis Pills Market Research Report 2024

120 Pages
Type: Report
Code: QYRE-Auto-1V9558
Mon Apr 15 00:00:00 UTC 2024

Add to Cart

76mm Camouflage Ammunition - Global Market Share and Ranking, Overall Sales and Demand Forecast 2024-2030

120 Pages
Type: Report
Code: QYRE-Auto-32Y2346
Sun Apr 07 00:00:00 UTC 2024

Add to Cart