0
U.S. (TOLL FREE)
+1 (315) 215-3225
Automative

0
U.S. (TOLL FREE)
+1 (315) 215-3225
Caffeine Market By TYPE (SYNTHESIZED CAFFEINE, NATURAL CAFFEINE), By APPLICATION (FOOD, BEVERAGE, PHARMACEUTICAL, COSMETICS and PERSONAL CARE, NUTRACEUTICAL): Global Opportunity Analysis and Industry Forecast, 2021-2031
Published Date: November 2022
|
Report Code: ALLI-Auto-0Y896
Home | Market Reports | Food & Drink| Beverages
Caffeine Market By TYPE SYNTHESIZED CAFFEINE NATURAL CAFFEINE By APPLICATION FOOD BEVERAGE PHARMACEUTICAL COSMETICS and PERSONAL CARE NUTRACEUTICAL Global Opportunity Analysis and Industry Forecast 2021 2031
BUY CHAPTERS

Caffeine Market By TYPE (SYNTHESIZED CAFFEINE, NATURAL CAFFEINE), By APPLICATION (FOOD, BEVERAGE, PHARMACEUTICAL, COSMETICS and PERSONAL CARE, NUTRACEUTICAL): Global Opportunity Analysis and Industry Forecast, 2021-2031

Code: ALLI-Auto-0Y896
Report
November 2022
Pages:210
Allied Market Research
Buy Now with 15% Discount
DESCRIPTION
TABLE OF CONTENT
TABLES & FIGURES

Caffeine Market Size

According to a new report published by , titled, “Caffeine Market," The caffeine market was valued at $715.20 million in 2021 and is estimated to reach $1.2 billion by 2031, growing at a CAGR of 5.2% from 2022 to 2031.

Caffeine Market

Caffeine Market

Caffeine is an alkaloid compound that is found primarily in coffee, guarana, tea, cocoa, guayusa, yaupon holly, and other plants and is a stimulant of the central nervous system as well as acts as a psychoactive drug. Caffeine is a white crystalline purine, mostly a methylxanthine alkaloid with a bitter taste. There are two types of caffeine available in the market such as natural and synthesized caffeine, which are derived from natural and synthetic sources. Commercially natural caffeine is obtained from decaffeinated coffee and tea by extraction using a solvent. Synthetic caffeine is produced from synthetic sources such as urea and chloroacetic acid.
Excessive caffeine consumption has undesirable side effects, including anxiety, sleeplessness, headaches, nausea, and dizziness. Consumers opted out of healthier caffeinated alternatives as a result of these adverse consequences. There is different caffeine substitutes are available in the market such as ginseng, pomegranate juice, maca, baobab, reishi, and others. According to the FDA, 400 mg of caffeine per day, or about 4 or 5 cups of coffee, is usually not harmful or dangerous for healthy adults, but exceeding this limit can have adverse effects. Furthermore, the key players in the food & beverages industry are focusing on research and development to produce innovative ingredients that may replace caffeine in food & beverage products. excessive consumption of caffeine can cause adverse health effects, which are expected to hinder the growth of the caffeine market.
Energy drink manufacturers such as Red bull Inc., Monster Beverages Corporation, The Coca-Cola Company, and others use aggressive marketing campaigns to capture the major share. They majorly target adventurous sports and events such as snowboarding, motorbike sports, and water sports. This creates awareness among consumers and viewers about the energy drink and its health benefits. In addition, these players are launching products with various flavors and tastes to attract a huge customer base, thus the increasing penetration of the sports nutrition industry is expected to create more opportunities for key players in the caffeine market in the upcoming years.
According to the market analysis, the global caffeine market is segmented into type, application, and region. Based on type, the market is divided into synthesized caffeine and natural caffeine. By application, the market is divided into food, beverages, pharmaceutical, cosmetics and personal care, and nutraceutical. Region-wise, the market is analyzed across North America (the U.S., Canada, and Mexico), Europe (Germany, France, Italy, Spain, UK, Russia, and rest of Europe), Asia-Pacific (China, Japan, India, Australia, South Korea, Indonesia, Thailand, and rest of Asia-Pacific), and LAMEA (Brazil, South Africa, Saudi Arabia, UAE, Argentina, and rest of LAMEA).
By type, the market is bifurcated into synthesized caffeine and natural caffeine. The synthetic caffeine segment constitutes a major caffeine market share. This is attributed to increasing in the demand for synthetic caffeine has increased owing to the increase in population. Overproduction of caffeine helps to lower the cost; the dependency of various industries on caffeine has increased extensively. Caffeine is one of the major ingredients used in energy drinks, cola, and other caffeinated beverages. Synthetic caffeine is widely used in the pharmaceutical and nutraceutical industry as an ingredient. Especially in Asia-Pacific, the demand for synthetic caffeine is anticipated to increase during the forecast period, owing to its high purchasing power.
By application, the pharmaceutical segment dominated the global market and is expected to retain its dominance during the caffeine market forecast period. The majority of caffeine is utilized in the pharmaceutical industry. The rise in awareness regarding health benefits associated with caffeine consumption is expected to propel the growth of the caffeine market. The caffeine market in LAMEA is anticipated to grow with a CAGR of 6.4% between 2022 and 2031, while the Asia-Pacific market is anticipated to witness a CAGR of 5.8%.
By region, Europe region dominated the global market and is expected to retain its dominance during the caffeine market forecast period. Germany is the leading market in Europe and is also expected to be the fastest-growing market. The consumption of caffeine by end-user industries is increasing at a significant rate in Europe, owing to a rise in awareness regarding the health benefits of caffeine among consumers. Europe operates as a single market with 28 countries and is tagged as the major trading power. Furthermore, an increase in product diversification in the category of food & beverages and the development of natural caffeine is expected to propel the demand for caffeine in the upcoming years.
The impact of the COVID-19 outbreak was moderate for the growth of the global caffeine market. The trade restrictions and lockdown resulted in the halting of production and manufacturing units. The recovery of the caffeine market is expected in near future.
The players in the caffeine market have adopted acquisition, business expansion, partnership, collaboration, and product launch as their key development strategies to increase profitability and improve their position in the caffeine market. Some of the key players profiled in the caffeine market analysis Aarti Industries Limited, BASF SE, Caesar & Loretz GmbH, CSPC Pharmaceutical Group Limited., Jilin Province Synthetic Pharmaceutical Co., Ltd., JoinTown Pharmaceutical Group Co., Ltd., Ravago Group, Shandong Xinhua Pharmaceutical Co., Ltd., Spectrum Laboratory Products, Inc., and Taj Pharma Group


Overview

The caffeine market size was $715.2 million in 2021 and is estimated to reach $ 1,194 million by 2031, registering a CAGR of 5.2% from 2022 to 2031. Caffeine is an alkaloid compound that is found especially in coffee, guarana, tea, cocoa, guayusa, yaupon holly, and other plants and is a stimulant of the central nervous system as well as acts as a psychoactive drug. Caffeine is a white crystalline purine, mostly a methylxanthine alkaloid with a bitter taste. There are two types of caffeine available in the market such as natural and synthesized caffeine, which are derived from natural and synthetic sources. Commercially natural caffeine is obtained from decaffeinated coffee and tea by extraction using a solvent. Synthetic caffeine is produced from synthetic sources such as urea and chloroacetic acid.
Energy drink manufacturers such as Red bull Inc., Monster Beverages Corporation, The Coca-Cola Company, and others use aggressive marketing campaigns to capture the major share. They majorly target adventurous sports and events such as snowboarding, motorbike sports, and water sports. This creates awareness among consumers and viewers about the energy drink and its health benefits. In addition, these players are launching products with various flavors and tastes to attract a huge customer base, thus the increasing penetration of the sports nutrition industry is expected to create more opportunities for key players in the caffeine market in the upcoming years.
Excessive caffeine consumption has undesirable side effects, including anxiety, sleeplessness, headaches, nausea, and dizziness. Consumers opted out of healthier caffeinated alternatives as a result of these adverse consequences. There is different caffeine substitutes are available in the market such as ginseng, pomegranate juice, maca, baobab, reishi, and others. According to the FDA, 400 mg of caffeine per day, or about 4 or 5 cups of coffee, is usually not harmful or dangerous for healthy adults, but exceeding this limit can have adverse effects. Furthermore, the key players in the food & beverages industry are focusing on research and development to produce an innovative ingredient that may replace caffeine in food & beverage products. excessive consumption of caffeine can cause adverse health effects, which are expected to hinder the growth of the caffeine market.
According to the market analysis, the global caffeine market is segmented into type, application, and region. Based on type, the market is divided into synthesized caffeine and natural caffeine. By application, the market is divided into food, beverages, pharmaceutical, cosmetics and personal care, and nutraceutical. Region-wise, the market is analyzed across North America (the U.S., Canada, and Mexico), Europe (Germany, France, Italy, Spain, UK, Russia, and rest of Europe), Asia-Pacific (China, Japan, India, Australia, South Korea, Indonesia, Thailand, and rest of Asia-Pacific), and LAMEA (Brazil, South Africa, Saudi Arabia, UAE, Argentina, and rest of LAMEA).
By type, the market is bifurcated into synthesized caffeine and natural caffeine. The synthetic caffeine segment constitutes a major caffeine market share. This is attributed to increase in the demand for synthetic caffeine has increased owing to the increase in population. Overproduction of caffeine helps to lower the cost; the dependency of various industries on caffeine has increased extensively. Caffeine is one of the major ingredients used in energy drinks, cola, and other caffeinated beverages. Synthetic caffeine is widely used in the pharmaceutical and nutraceutical industry as ingredient. Especially in Asia-Pacific, the demand for synthetic caffeine is anticipated to increase during the forecast period, owing to its high purchasing power.
By application, the pharmaceutical segment dominated the global market and is expected to retain its dominance during the caffeine market forecast period. Majority of the caffeine is utilized in the pharmaceutical industry. Rise in awareness regarding health benefits associated with caffeine consumption is expected to propel the growth of the caffeine market. The caffeine market in LAMEA is anticipated to grow with a CAGR of 6.4% between 2022 and 2031, while the Asia-Pacific market is anticipated to witness a CAGR of 5.8%.
By region, Europe region dominated the global market and is expected to retain its dominance during the caffeine market forecast period. Germany is the leading market in Europe and is also expected to be the fastest growing market. The consumption of caffeine by end-user industries is increasing at a significant rate in Europe, owing to a rise in awareness regarding the health benefits of caffeine among consumers. Europe operates as a single market with 28 countries and is tagged as the major trading power. Furthermore, an increase in product diversification in the category of food & beverages and the development of natural caffeine is expected to propel the demand for caffeine in the upcoming years.
The impact of the COVID-19 outbreak was moderate for the growth of the global caffeine market. The trade restrictions and lockdown resulted in the halting of production and manufacturing units. The recovery of the caffeine market is expected in near future.
The players in the caffeine market have adopted acquisition, business expansion, partnership, collaboration, and product launch as their key development strategies to increase profitability and improve their position in the caffeine market. Some of the key players profiled in the caffeine market analysis Aarti Industries Limited, BASF SE, Caesar & Loretz GmbH, CSPC Pharmaceutical Group Limited., Jilin Province Synthetic Pharmaceutical Co., Ltd., JoinTown Pharmaceutical Group Co., Ltd., Ravago Group, Shandong Xinhua Pharmaceutical Co., Ltd., Spectrum Laboratory Products, Inc., and Taj Pharma Group
 

Key Benefits For Stakeholders

●This report provides a quantitative analysis of the market segments, current trends, estimations, and dynamics of the caffeine market analysis from 2021 to 2031 to identify the prevailing caffeine market opportunities.
●The market research is offered along with information related to key drivers, restraints, and opportunities.
●Porter's five forces analysis highlights the potency of buyers and suppliers to enable stakeholders make profit-oriented business decisions and strengthen their supplier-buyer network.
●In-depth analysis of the caffeine market segmentation assists to determine the prevailing market opportunities.
●Major countries in each region are mapped according to their revenue contribution to the global market.
●Market player positioning facilitates benchmarking and provides a clear understanding of the present position of the market players.
●The report includes the analysis of the regional as well as global caffeine market trends, key players, market segments, application areas, and market growth strategies.
Key Market Segments
○ Jilin Province Synthetic Pharmaceutical Co., Ltd

Scope of Caffeine Market Report

Report Metric Details
Report Name Caffeine Market
Accounted market size in 2021 $ 715.20 in million
Forecasted market size in 2031 $ 1.2 billion
CAGR 5.2%
Base Year 2021
Forecasted years 2024 - 2031
By APPLICATION ● FOOD
● BEVERAGE
● PHARMACEUTICAL
● COSMETICS and PERSONAL CARE
● NUTRACEUTICAL
By TYPE ● SYNTHESIZED CAFFEINE
● NATURAL CAFFEINE
By Region
  • North America (United States, Canada)
  • Europe (Germany, France, UK, Italy, Russia) Rest of Europe
  • Nordic Countries
  • Asia-Pacific (China, Japan, South Korea)
  • Southeast Asia (India, Australia)
  • Rest of Asia
  • Latin America (Mexico, Brazil)
  • Rest of Latin America
  • Middle East & Africa (Turkey, Saudi Arabia, UAE, Rest of MEA)
Forecast units USD million in value
Report coverage Revenue and volume forecast, company share, competitive landscape, growth factors and trends

FAQ for this report

How fast is Caffeine Market growing?

Ans: The Caffeine Market witnessing a CAGR of 5.2% during the forecast period 2024-2031.

What is the Caffeine Market size in 2031?

Ans: The Caffeine Market size in 2031 will be $ 1.2 billion.

What are the Application segmentation covered in the Caffeine Market report?

Ans: The Applications covered in the Caffeine Market report are ● FOOD, ● BEVERAGE, ● PHARMACEUTICAL, ● COSMETICS and PERSONAL CARE, ● NUTRACEUTICAL

What are the Type segmentation covered in the Caffeine Market report?

Ans: The Types covered in the Caffeine Market report are ● SYNTHESIZED CAFFEINE, ● NATURAL CAFFEINE

CHAPTER 1:INTRODUCTION
1.1.Report description
1.2.Key market segments
1.3.Key benefits to the stakeholders
1.4.Research Methodology
1.4.1.Secondary research
1.4.2.Primary research
1.4.3.Analyst tools and models
CHAPTER 2:EXECUTIVE SUMMARY
2.1.Key findings of the study
2.2.CXO Perspective
CHAPTER 3:MARKET OVERVIEW
3.1.Market definition and scope
3.2.Key findings
3.2.1.Top investment pockets
3.3.Porter’s five forces analysis
3.4.Market dynamics
3.4.1.Drivers
3.4.1.1. Caffeine is Gaining Popularity in Nutraceuticals
3.4.1.2. Surge in the functional beverages market in Asia-Pacific
3.4.1.3. Rise in number of athletes and sports persons
3.4.2.Restraints
3.4.2.1. The Detrimental Effects of Excessive Caffeine consumption
3.4.2.2. Undefined regulatory guidelines
3.4.3.Opportunities
3.4.3.1. Rise in consumer demand for allergen-free food & beverages
3.4.3.2. Increase in penetration of the sports nutrition industry
3.5.COVID-19 Impact Analysis on the market
CHAPTER 4: CAFFEINE MARKET, BY TYPE
4.1 Overview
4.1.1 Market size and forecast
4.2 SYNTHESIZED CAFFEINE
4.2.1 Key market trends, growth factors and opportunities
4.2.2 Market size and forecast, by region
4.2.3 Market share analysis by country
4.3 NATURAL CAFFEINE
4.3.1 Key market trends, growth factors and opportunities
4.3.2 Market size and forecast, by region
4.3.3 Market share analysis by country
CHAPTER 5: CAFFEINE MARKET, BY APPLICATION
5.1 Overview
5.1.1 Market size and forecast
5.2 FOOD
5.2.1 Key market trends, growth factors and opportunities
5.2.2 Market size and forecast, by region
5.2.3 Market share analysis by country
5.3 BEVERAGE
5.3.1 Key market trends, growth factors and opportunities
5.3.2 Market size and forecast, by region
5.3.3 Market share analysis by country
5.4 PHARMACEUTICAL
5.4.1 Key market trends, growth factors and opportunities
5.4.2 Market size and forecast, by region
5.4.3 Market share analysis by country
5.5 COSMETICS and PERSONAL CARE
5.5.1 Key market trends, growth factors and opportunities
5.5.2 Market size and forecast, by region
5.5.3 Market share analysis by country
5.6 NUTRACEUTICAL
5.6.1 Key market trends, growth factors and opportunities
5.6.2 Market size and forecast, by region
5.6.3 Market share analysis by country
CHAPTER 6: CAFFEINE MARKET, BY REGION
6.1 Overview
6.1.1 Market size and forecast
6.2 North America
6.2.1 Key trends and opportunities
6.2.2 North America Market size and forecast, by TYPE
6.2.3 North America Market size and forecast, by APPLICATION
6.2.4 North America Market size and forecast, by country
6.2.4.1 U.S.
6.2.4.1.1 Key market trends, growth factors and opportunities
6.2.4.1.2 Market size and forecast, by TYPE
6.2.4.1.3 Market size and forecast, by APPLICATION
6.2.4.2 Canada
6.2.4.2.1 Key market trends, growth factors and opportunities
6.2.4.2.2 Market size and forecast, by TYPE
6.2.4.2.3 Market size and forecast, by APPLICATION
6.2.4.3 Mexico
6.2.4.3.1 Key market trends, growth factors and opportunities
6.2.4.3.2 Market size and forecast, by TYPE
6.2.4.3.3 Market size and forecast, by APPLICATION
6.3 Europe
6.3.1 Key trends and opportunities
6.3.2 Europe Market size and forecast, by TYPE
6.3.3 Europe Market size and forecast, by APPLICATION
6.3.4 Europe Market size and forecast, by country
6.3.4.1 Germany
6.3.4.1.1 Key market trends, growth factors and opportunities
6.3.4.1.2 Market size and forecast, by TYPE
6.3.4.1.3 Market size and forecast, by APPLICATION
6.3.4.2 France
6.3.4.2.1 Key market trends, growth factors and opportunities
6.3.4.2.2 Market size and forecast, by TYPE
6.3.4.2.3 Market size and forecast, by APPLICATION
6.3.4.3 Italy
6.3.4.3.1 Key market trends, growth factors and opportunities
6.3.4.3.2 Market size and forecast, by TYPE
6.3.4.3.3 Market size and forecast, by APPLICATION
6.3.4.4 Spain
6.3.4.4.1 Key market trends, growth factors and opportunities
6.3.4.4.2 Market size and forecast, by TYPE
6.3.4.4.3 Market size and forecast, by APPLICATION
6.3.4.5 UK
6.3.4.5.1 Key market trends, growth factors and opportunities
6.3.4.5.2 Market size and forecast, by TYPE
6.3.4.5.3 Market size and forecast, by APPLICATION
6.3.4.6 Russia
6.3.4.6.1 Key market trends, growth factors and opportunities
6.3.4.6.2 Market size and forecast, by TYPE
6.3.4.6.3 Market size and forecast, by APPLICATION
6.3.4.7 Rest of Europe
6.3.4.7.1 Key market trends, growth factors and opportunities
6.3.4.7.2 Market size and forecast, by TYPE
6.3.4.7.3 Market size and forecast, by APPLICATION
6.4 Asia-Pacific
6.4.1 Key trends and opportunities
6.4.2 Asia-Pacific Market size and forecast, by TYPE
6.4.3 Asia-Pacific Market size and forecast, by APPLICATION
6.4.4 Asia-Pacific Market size and forecast, by country
6.4.4.1 China
6.4.4.1.1 Key market trends, growth factors and opportunities
6.4.4.1.2 Market size and forecast, by TYPE
6.4.4.1.3 Market size and forecast, by APPLICATION
6.4.4.2 Japan
6.4.4.2.1 Key market trends, growth factors and opportunities
6.4.4.2.2 Market size and forecast, by TYPE
6.4.4.2.3 Market size and forecast, by APPLICATION
6.4.4.3 India
6.4.4.3.1 Key market trends, growth factors and opportunities
6.4.4.3.2 Market size and forecast, by TYPE
6.4.4.3.3 Market size and forecast, by APPLICATION
6.4.4.4 Australia
6.4.4.4.1 Key market trends, growth factors and opportunities
6.4.4.4.2 Market size and forecast, by TYPE
6.4.4.4.3 Market size and forecast, by APPLICATION
6.4.4.5 South Korea
6.4.4.5.1 Key market trends, growth factors and opportunities
6.4.4.5.2 Market size and forecast, by TYPE
6.4.4.5.3 Market size and forecast, by APPLICATION
6.4.4.6 Indonesia
6.4.4.6.1 Key market trends, growth factors and opportunities
6.4.4.6.2 Market size and forecast, by TYPE
6.4.4.6.3 Market size and forecast, by APPLICATION
6.4.4.7 Thailand
6.4.4.7.1 Key market trends, growth factors and opportunities
6.4.4.7.2 Market size and forecast, by TYPE
6.4.4.7.3 Market size and forecast, by APPLICATION
6.4.4.8 Rest of Asia-Pacific
6.4.4.8.1 Key market trends, growth factors and opportunities
6.4.4.8.2 Market size and forecast, by TYPE
6.4.4.8.3 Market size and forecast, by APPLICATION
6.5 LAMEA
6.5.1 Key trends and opportunities
6.5.2 LAMEA Market size and forecast, by TYPE
6.5.3 LAMEA Market size and forecast, by APPLICATION
6.5.4 LAMEA Market size and forecast, by country
6.5.4.1 Brazil
6.5.4.1.1 Key market trends, growth factors and opportunities
6.5.4.1.2 Market size and forecast, by TYPE
6.5.4.1.3 Market size and forecast, by APPLICATION
6.5.4.2 South Africa
6.5.4.2.1 Key market trends, growth factors and opportunities
6.5.4.2.2 Market size and forecast, by TYPE
6.5.4.2.3 Market size and forecast, by APPLICATION
6.5.4.3 Saudi Arabia
6.5.4.3.1 Key market trends, growth factors and opportunities
6.5.4.3.2 Market size and forecast, by TYPE
6.5.4.3.3 Market size and forecast, by APPLICATION
6.5.4.4 UAE
6.5.4.4.1 Key market trends, growth factors and opportunities
6.5.4.4.2 Market size and forecast, by TYPE
6.5.4.4.3 Market size and forecast, by APPLICATION
6.5.4.5 Argentina
6.5.4.5.1 Key market trends, growth factors and opportunities
6.5.4.5.2 Market size and forecast, by TYPE
6.5.4.5.3 Market size and forecast, by APPLICATION
6.5.4.6 Rest of LAMEA
6.5.4.6.1 Key market trends, growth factors and opportunities
6.5.4.6.2 Market size and forecast, by TYPE
6.5.4.6.3 Market size and forecast, by APPLICATION
CHAPTER 7: COMPANY LANDSCAPE
7.1. Introduction
7.2. Top winning strategies
7.3. Product Mapping of Top 10 Player
7.4. Competitive Dashboard
7.5. Competitive Heatmap
7.5. Top player positioning, 2021
CHAPTER 8: COMPANY PROFILES
8.1 JoinTown Pharmaceutical Group Co., Ltd.
8.1.1 Company overview
8.1.2 Key Executives
8.1.3 Company snapshot
8.1.4 Operating business segments
8.1.5 Product portfolio
8.1.6 Business performance
8.1.7 Key strategic moves and developments
8.2 Spectrum Laboratory Products, Inc.
8.2.1 Company overview
8.2.2 Key Executives
8.2.3 Company snapshot
8.2.4 Operating business segments
8.2.5 Product portfolio
8.2.6 Business performance
8.2.7 Key strategic moves and developments
8.3 Taj Pharma Group
8.3.1 Company overview
8.3.2 Key Executives
8.3.3 Company snapshot
8.3.4 Operating business segments
8.3.5 Product portfolio
8.3.6 Business performance
8.3.7 Key strategic moves and developments
8.4 CSPC Pharmaceutical Group Limited.
8.4.1 Company overview
8.4.2 Key Executives
8.4.3 Company snapshot
8.4.4 Operating business segments
8.4.5 Product portfolio
8.4.6 Business performance
8.4.7 Key strategic moves and developments
8.5 Caesar & Loretz GmbH
8.5.1 Company overview
8.5.2 Key Executives
8.5.3 Company snapshot
8.5.4 Operating business segments
8.5.5 Product portfolio
8.5.6 Business performance
8.5.7 Key strategic moves and developments
8.6 Ravago Group
8.6.1 Company overview
8.6.2 Key Executives
8.6.3 Company snapshot
8.6.4 Operating business segments
8.6.5 Product portfolio
8.6.6 Business performance
8.6.7 Key strategic moves and developments
8.7 Aarti Industries Limited
8.7.1 Company overview
8.7.2 Key Executives
8.7.3 Company snapshot
8.7.4 Operating business segments
8.7.5 Product portfolio
8.7.6 Business performance
8.7.7 Key strategic moves and developments
8.8 BASF SE
8.8.1 Company overview
8.8.2 Key Executives
8.8.3 Company snapshot
8.8.4 Operating business segments
8.8.5 Product portfolio
8.8.6 Business performance
8.8.7 Key strategic moves and developments
8.9 Shandong Xinhua Pharmaceutical Co., Ltd.
8.9.1 Company overview
8.9.2 Key Executives
8.9.3 Company snapshot
8.9.4 Operating business segments
8.9.5 Product portfolio
8.9.6 Business performance
8.9.7 Key strategic moves and developments
8.10 Jilin Province Synthetic Pharmaceutical Co., Ltd.
8.10.1 Company overview
8.10.2 Key Executives
8.10.3 Company snapshot
8.10.4 Operating business segments
8.10.5 Product portfolio
8.10.6 Business performance
8.10.7 Key strategic moves and development
LIST OF TABLES
TABLE 1. GLOBAL CAFFEINE MARKET, BY TYPE, 2021-2031 (REVENUE, $MILLION)
TABLE 2. CAFFEINE MARKET FOR SYNTHESIZED CAFFEINE, BY REGION, 2021-2031 (REVENUE, $MILLION)
TABLE 3. CAFFEINE MARKET FOR NATURAL CAFFEINE, BY REGION, 2021-2031 (REVENUE, $MILLION)
TABLE 4. GLOBAL CAFFEINE MARKET, BY APPLICATION, 2021-2031 (REVENUE, $MILLION)
TABLE 5. CAFFEINE MARKET FOR FOOD, BY REGION, 2021-2031 (REVENUE, $MILLION)
TABLE 6. CAFFEINE MARKET FOR BEVERAGE, BY REGION, 2021-2031 (REVENUE, $MILLION)
TABLE 7. CAFFEINE MARKET FOR PHARMACEUTICAL, BY REGION, 2021-2031 (REVENUE, $MILLION)
TABLE 8. CAFFEINE MARKET FOR COSMETICS AND PERSONAL CARE, BY REGION, 2021-2031 (REVENUE, $MILLION)
TABLE 9. CAFFEINE MARKET FOR NUTRACEUTICAL, BY REGION, 2021-2031 (REVENUE, $MILLION)
TABLE 10. CAFFEINE MARKET, BY REGION, 2021-2031 (REVENUE, $MILLION)
TABLE 11. NORTH AMERICA CAFFEINE MARKET, BY TYPE, 2021-2031 (REVENUE, $MILLION)
TABLE 12. NORTH AMERICA CAFFEINE MARKET, BY APPLICATION, 2021-2031 (REVENUE, $MILLION)
TABLE 13. NORTH AMERICA CAFFEINE MARKET, BY COUNTRY, 2021-2031 (REVENUE, $MILLION)
TABLE 14. U.S. CAFFEINE MARKET, BY TYPE, 2021-2031 (REVENUE, $MILLION)
TABLE 15. U.S. CAFFEINE MARKET, BY APPLICATION, 2021-2031 (REVENUE, $MILLION)
TABLE 16. CANADA CAFFEINE MARKET, BY TYPE, 2021-2031 (REVENUE, $MILLION)
TABLE 17. CANADA CAFFEINE MARKET, BY APPLICATION, 2021-2031 (REVENUE, $MILLION)
TABLE 18. MEXICO CAFFEINE MARKET, BY TYPE, 2021-2031 (REVENUE, $MILLION)
TABLE 19. MEXICO CAFFEINE MARKET, BY APPLICATION, 2021-2031 (REVENUE, $MILLION)
TABLE 20. EUROPE CAFFEINE MARKET, BY TYPE, 2021-2031 (REVENUE, $MILLION)
TABLE 21. EUROPE CAFFEINE MARKET, BY APPLICATION, 2021-2031 (REVENUE, $MILLION)
TABLE 22. EUROPE CAFFEINE MARKET, BY COUNTRY, 2021-2031 (REVENUE, $MILLION)
TABLE 23. GERMANY CAFFEINE MARKET, BY TYPE, 2021-2031 (REVENUE, $MILLION)
TABLE 24. GERMANY CAFFEINE MARKET, BY APPLICATION, 2021-2031 (REVENUE, $MILLION)
TABLE 25. FRANCE CAFFEINE MARKET, BY TYPE, 2021-2031 (REVENUE, $MILLION)
TABLE 26. FRANCE CAFFEINE MARKET, BY APPLICATION, 2021-2031 (REVENUE, $MILLION)
TABLE 27. ITALY CAFFEINE MARKET, BY TYPE, 2021-2031 (REVENUE, $MILLION)
TABLE 28. ITALY CAFFEINE MARKET, BY APPLICATION, 2021-2031 (REVENUE, $MILLION)
TABLE 29. SPAIN CAFFEINE MARKET, BY TYPE, 2021-2031 (REVENUE, $MILLION)
TABLE 30. SPAIN CAFFEINE MARKET, BY APPLICATION, 2021-2031 (REVENUE, $MILLION)
TABLE 31. UK CAFFEINE MARKET, BY TYPE, 2021-2031 (REVENUE, $MILLION)
TABLE 32. UK CAFFEINE MARKET, BY APPLICATION, 2021-2031 (REVENUE, $MILLION)
TABLE 33. RUSSIA CAFFEINE MARKET, BY TYPE, 2021-2031 (REVENUE, $MILLION)
TABLE 34. RUSSIA CAFFEINE MARKET, BY APPLICATION, 2021-2031 (REVENUE, $MILLION)
TABLE 35. REST OF EUROPE CAFFEINE MARKET, BY TYPE, 2021-2031 (REVENUE, $MILLION)
TABLE 36. REST OF EUROPE CAFFEINE MARKET, BY APPLICATION, 2021-2031 (REVENUE, $MILLION)
TABLE 37. ASIA-PACIFIC CAFFEINE MARKET, BY TYPE, 2021-2031 (REVENUE, $MILLION)
TABLE 38. ASIA-PACIFIC CAFFEINE MARKET, BY APPLICATION, 2021-2031 (REVENUE, $MILLION)
TABLE 39. ASIA-PACIFIC CAFFEINE MARKET, BY COUNTRY, 2021-2031 (REVENUE, $MILLION)
TABLE 40. CHINA CAFFEINE MARKET, BY TYPE, 2021-2031 (REVENUE, $MILLION)
TABLE 41. CHINA CAFFEINE MARKET, BY APPLICATION, 2021-2031 (REVENUE, $MILLION)
TABLE 42. JAPAN CAFFEINE MARKET, BY TYPE, 2021-2031 (REVENUE, $MILLION)
TABLE 43. JAPAN CAFFEINE MARKET, BY APPLICATION, 2021-2031 (REVENUE, $MILLION)
TABLE 44. INDIA CAFFEINE MARKET, BY TYPE, 2021-2031 (REVENUE, $MILLION)
TABLE 45. INDIA CAFFEINE MARKET, BY APPLICATION, 2021-2031 (REVENUE, $MILLION)
TABLE 46. AUSTRALIA CAFFEINE MARKET, BY TYPE, 2021-2031 (REVENUE, $MILLION)
TABLE 47. AUSTRALIA CAFFEINE MARKET, BY APPLICATION, 2021-2031 (REVENUE, $MILLION)
TABLE 48. SOUTH KOREA CAFFEINE MARKET, BY TYPE, 2021-2031 (REVENUE, $MILLION)
TABLE 49. SOUTH KOREA CAFFEINE MARKET, BY APPLICATION, 2021-2031 (REVENUE, $MILLION)
TABLE 50. INDONESIA CAFFEINE MARKET, BY TYPE, 2021-2031 (REVENUE, $MILLION)
TABLE 51. INDONESIA CAFFEINE MARKET, BY APPLICATION, 2021-2031 (REVENUE, $MILLION)
TABLE 52. THAILAND CAFFEINE MARKET, BY TYPE, 2021-2031 (REVENUE, $MILLION)
TABLE 53. THAILAND CAFFEINE MARKET, BY APPLICATION, 2021-2031 (REVENUE, $MILLION)
TABLE 54. REST OF ASIA-PACIFIC CAFFEINE MARKET, BY TYPE, 2021-2031 (REVENUE, $MILLION)
TABLE 55. REST OF ASIA-PACIFIC CAFFEINE MARKET, BY APPLICATION, 2021-2031 (REVENUE, $MILLION)
TABLE 56. LAMEA CAFFEINE MARKET, BY TYPE, 2021-2031 (REVENUE, $MILLION)
TABLE 57. LAMEA CAFFEINE MARKET, BY APPLICATION, 2021-2031 (REVENUE, $MILLION)
TABLE 58. LAMEA CAFFEINE MARKET, BY COUNTRY, 2021-2031 (REVENUE, $MILLION)
TABLE 59. BRAZIL CAFFEINE MARKET, BY TYPE, 2021-2031 (REVENUE, $MILLION)
TABLE 60. BRAZIL CAFFEINE MARKET, BY APPLICATION, 2021-2031 (REVENUE, $MILLION)
TABLE 61. SOUTH AFRICA CAFFEINE MARKET, BY TYPE, 2021-2031 (REVENUE, $MILLION)
TABLE 62. SOUTH AFRICA CAFFEINE MARKET, BY APPLICATION, 2021-2031 (REVENUE, $MILLION)
TABLE 63. SAUDI ARABIA CAFFEINE MARKET, BY TYPE, 2021-2031 (REVENUE, $MILLION)
TABLE 64. SAUDI ARABIA CAFFEINE MARKET, BY APPLICATION, 2021-2031 (REVENUE, $MILLION)
TABLE 65. UAE CAFFEINE MARKET, BY TYPE, 2021-2031 (REVENUE, $MILLION)
TABLE 66. UAE CAFFEINE MARKET, BY APPLICATION, 2021-2031 (REVENUE, $MILLION)
TABLE 67. ARGENTINA CAFFEINE MARKET, BY TYPE, 2021-2031 (REVENUE, $MILLION)
TABLE 68. ARGENTINA CAFFEINE MARKET, BY APPLICATION, 2021-2031 (REVENUE, $MILLION)
TABLE 69. REST OF LAMEA CAFFEINE MARKET, BY TYPE, 2021-2031 (REVENUE, $MILLION)
TABLE 70. REST OF LAMEA CAFFEINE MARKET, BY APPLICATION, 2021-2031 (REVENUE, $MILLION)
TABLE 71.JOINTOWN PHARMACEUTICAL GROUP CO., LTD.: KEY EXECUTIVES
TABLE 71.JOINTOWN PHARMACEUTICAL GROUP CO., LTD.: COMPANY SNAPSHOT
TABLE 72.JOINTOWN PHARMACEUTICAL GROUP CO., LTD.: OPERATING SEGMENTS
TABLE 73.JOINTOWN PHARMACEUTICAL GROUP CO., LTD.: PRODUCT PORTFOLIO
TABLE 74.JOINTOWN PHARMACEUTICAL GROUP CO., LTD.: NET SALES
TABLE 75.JOINTOWN PHARMACEUTICAL GROUP CO., LTD.: KEY STRATERGIES
TABLE 77.SPECTRUM LABORATORY PRODUCTS, INC.: KEY EXECUTIVES
TABLE 77.SPECTRUM LABORATORY PRODUCTS, INC.: COMPANY SNAPSHOT
TABLE 78.SPECTRUM LABORATORY PRODUCTS, INC.: OPERATING SEGMENTS
TABLE 79.SPECTRUM LABORATORY PRODUCTS, INC.: PRODUCT PORTFOLIO
TABLE 80.SPECTRUM LABORATORY PRODUCTS, INC.: NET SALES
TABLE 81.SPECTRUM LABORATORY PRODUCTS, INC.: KEY STRATERGIES
TABLE 83.TAJ PHARMA GROUP: KEY EXECUTIVES
TABLE 83.TAJ PHARMA GROUP: COMPANY SNAPSHOT
TABLE 84.TAJ PHARMA GROUP: OPERATING SEGMENTS
TABLE 85.TAJ PHARMA GROUP: PRODUCT PORTFOLIO
TABLE 86.TAJ PHARMA GROUP: NET SALES
TABLE 87.TAJ PHARMA GROUP: KEY STRATERGIES
TABLE 89.CSPC PHARMACEUTICAL GROUP LIMITED.: KEY EXECUTIVES
TABLE 89.CSPC PHARMACEUTICAL GROUP LIMITED.: COMPANY SNAPSHOT
TABLE 90.CSPC PHARMACEUTICAL GROUP LIMITED.: OPERATING SEGMENTS
TABLE 91.CSPC PHARMACEUTICAL GROUP LIMITED.: PRODUCT PORTFOLIO
TABLE 92.CSPC PHARMACEUTICAL GROUP LIMITED.: NET SALES
TABLE 93.CSPC PHARMACEUTICAL GROUP LIMITED.: KEY STRATERGIES
TABLE 95.CAESAR & LORETZ GMBH: COMPANY SNAPSHOT
TABLE 95.CAESAR & LORETZ GMBH: KEY EXECUTIVES
TABLE 96.CAESAR & LORETZ GMBH: OPERATING SEGMENTS
TABLE 97.CAESAR & LORETZ GMBH: PRODUCT PORTFOLIO
TABLE 98.CAESAR & LORETZ GMBH: NET SALES
TABLE 99.CAESAR & LORETZ GMBH: KEY STRATERGIES
TABLE 101.RAVAGO GROUP: KEY EXECUTIVES
TABLE 101.RAVAGO GROUP: COMPANY SNAPSHOT
TABLE 102.RAVAGO GROUP: OPERATING SEGMENTS
TABLE 103.RAVAGO GROUP: PRODUCT PORTFOLIO
TABLE 104.RAVAGO GROUP: NET SALES
TABLE 105.RAVAGO GROUP: KEY STRATERGIES
TABLE 107.AARTI INDUSTRIES LIMITED: KEY EXECUTIVES
TABLE 107.AARTI INDUSTRIES LIMITED: COMPANY SNAPSHOT
TABLE 108.AARTI INDUSTRIES LIMITED: OPERATING SEGMENTS
TABLE 109.AARTI INDUSTRIES LIMITED: PRODUCT PORTFOLIO
TABLE 110.AARTI INDUSTRIES LIMITED: NET SALES
TABLE 111.AARTI INDUSTRIES LIMITED: KEY STRATERGIES
TABLE 113.BASF SE: COMPANY SNAPSHOT
TABLE 113.BASF SE: KEY EXECUTIVES
TABLE 114.BASF SE: OPERATING SEGMENTS
TABLE 115.BASF SE: PRODUCT PORTFOLIO
TABLE 116.BASF SE: NET SALES
TABLE 117.BASF SE: KEY STRATERGIES
TABLE 119.SHANDONG XINHUA PHARMACEUTICAL CO., LTD.: KEY EXECUTIVES
TABLE 119.SHANDONG XINHUA PHARMACEUTICAL CO., LTD.: COMPANY SNAPSHOT
TABLE 120.SHANDONG XINHUA PHARMACEUTICAL CO., LTD.: OPERATING SEGMENTS
TABLE 121.SHANDONG XINHUA PHARMACEUTICAL CO., LTD.: PRODUCT PORTFOLIO
TABLE 122.SHANDONG XINHUA PHARMACEUTICAL CO., LTD.: NET SALES
TABLE 123.SHANDONG XINHUA PHARMACEUTICAL CO., LTD.: KEY STRATERGIES
TABLE 125.JILIN PROVINCE SYNTHETIC PHARMACEUTICAL CO., LTD.: KEY EXECUTIVES
TABLE 125.JILIN PROVINCE SYNTHETIC PHARMACEUTICAL CO., LTD.: COMPANY SNAPSHOT
TABLE 126.JILIN PROVINCE SYNTHETIC PHARMACEUTICAL CO., LTD.: OPERATING SEGMENTS
TABLE 127.JILIN PROVINCE SYNTHETIC PHARMACEUTICAL CO., LTD.: PRODUCT PORTFOLIO
TABLE 128.JILIN PROVINCE SYNTHETIC PHARMACEUTICAL CO., LTD.: NET SALES
TABLE 129.JILIN PROVINCE SYNTHETIC PHARMACEUTICAL CO., LTD.: KEY STRATERGIES LIST OF FIGURES
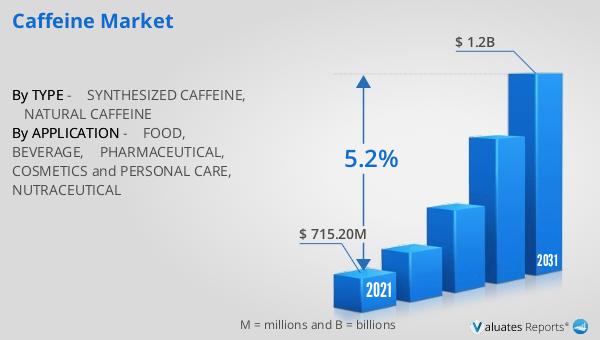
FIGURE 1. SEGMENTATION OF CAFFEINE MARKET,2021-2031
FIGURE 2.CAFFEINE MARKET,2021-2031
FIGURE 3. TOP INVESTMENT POCKETS, BY REGION
FIGURE 4.PORTER FIVE-1
FIGURE 5.PORTER FIVE-2
FIGURE 6.PORTER FIVE-3
FIGURE 7.PORTER FIVE-4
FIGURE 8.PORTER FIVE-5
FIGURE 9.CAFFEINE MARKET:DRIVERS, RESTRAINTS AND OPPORTUNITIES
FIGURE 10.CAFFEINE MARKET,BY TYPE,2021(%)
FIGURE 11.COMPARATIVE SHARE ANALYSIS OF SYNTHESIZED CAFFEINE CAFFEINE MARKET, 2021 AND 2031(%)
FIGURE 12.COMPARATIVE SHARE ANALYSIS OF NATURAL CAFFEINE CAFFEINE MARKET, 2021 AND 2031(%)
FIGURE 13.CAFFEINE MARKET,BY APPLICATION,2021(%)
FIGURE 14.COMPARATIVE SHARE ANALYSIS OF FOOD CAFFEINE MARKET, 2021 AND 2031(%)
FIGURE 15.COMPARATIVE SHARE ANALYSIS OF BEVERAGE CAFFEINE MARKET, 2021 AND 2031(%)
FIGURE 16.COMPARATIVE SHARE ANALYSIS OF PHARMACEUTICAL CAFFEINE MARKET, 2021 AND 2031(%)
FIGURE 17.COMPARATIVE SHARE ANALYSIS OF COSMETICS AND PERSONAL CARE CAFFEINE MARKET, 2021 AND 2031(%)
FIGURE 18.COMPARATIVE SHARE ANALYSIS OF NUTRACEUTICAL CAFFEINE MARKET, 2021 AND 2031(%)
FIGURE 19.CAFFEINE MARKET BY REGION,2021
FIGURE 20.U.S. CAFFEINE MARKET,2021-2031($MILLION)
FIGURE 21.CANADA CAFFEINE MARKET,2021-2031($MILLION)
FIGURE 22.MEXICO CAFFEINE MARKET,2021-2031($MILLION)
FIGURE 23.GERMANY CAFFEINE MARKET,2021-2031($MILLION)
FIGURE 24.FRANCE CAFFEINE MARKET,2021-2031($MILLION)
FIGURE 25.ITALY CAFFEINE MARKET,2021-2031($MILLION)
FIGURE 26.SPAIN CAFFEINE MARKET,2021-2031($MILLION)
FIGURE 27.UK CAFFEINE MARKET,2021-2031($MILLION)
FIGURE 28.RUSSIA CAFFEINE MARKET,2021-2031($MILLION)
FIGURE 29.REST OF EUROPE CAFFEINE MARKET,2021-2031($MILLION)
FIGURE 30.CHINA CAFFEINE MARKET,2021-2031($MILLION)
FIGURE 31.JAPAN CAFFEINE MARKET,2021-2031($MILLION)
FIGURE 32.INDIA CAFFEINE MARKET,2021-2031($MILLION)
FIGURE 33.AUSTRALIA CAFFEINE MARKET,2021-2031($MILLION)
FIGURE 34.SOUTH KOREA CAFFEINE MARKET,2021-2031($MILLION)
FIGURE 35.INDONESIA CAFFEINE MARKET,2021-2031($MILLION)
FIGURE 36.THAILAND CAFFEINE MARKET,2021-2031($MILLION)
FIGURE 37.REST OF ASIA-PACIFIC CAFFEINE MARKET,2021-2031($MILLION)
FIGURE 38.BRAZIL CAFFEINE MARKET,2021-2031($MILLION)
FIGURE 39.SOUTH AFRICA CAFFEINE MARKET,2021-2031($MILLION)
FIGURE 40.SAUDI ARABIA CAFFEINE MARKET,2021-2031($MILLION)
FIGURE 41.UAE CAFFEINE MARKET,2021-2031($MILLION)
FIGURE 42.ARGENTINA CAFFEINE MARKET,2021-2031($MILLION)
FIGURE 43.REST OF LAMEA CAFFEINE MARKET,2021-2031($MILLION)
FIGURE 44. TOP WINNING STRATEGIES, BY YEAR
FIGURE 45. TOP WINNING STRATEGIES, BY DEVELOPMENT
FIGURE 46. TOP WINNING STRATEGIES, BY COMPANY
FIGURE 47.PRODUCT MAPPING OF TOP 10 PLAYERS
FIGURE 48.COMPETITIVE DASHBOARD
FIGURE 49.COMPETITIVE HEATMAP OF TOP 10 KEY PLAYERS
FIGURE 50.TOP PLAYER POSITIONING, 2021
FIGURE 51.JOINTOWN PHARMACEUTICAL GROUP CO., LTD..: NET SALES ($MILLION)
FIGURE 52.SPECTRUM LABORATORY PRODUCTS, INC..: NET SALES ($MILLION)
FIGURE 53.TAJ PHARMA GROUP.: NET SALES ($MILLION)
FIGURE 54.CSPC PHARMACEUTICAL GROUP LIMITED..: NET SALES ($MILLION)
FIGURE 55.CAESAR & LORETZ GMBH.: NET SALES ($MILLION)
FIGURE 56.RAVAGO GROUP.: NET SALES ($MILLION)
FIGURE 57.AARTI INDUSTRIES LIMITED.: NET SALES ($MILLION)
FIGURE 58.BASF SE.: NET SALES ($MILLION)
FIGURE 59.SHANDONG XINHUA PHARMACEUTICAL CO., LTD..: NET SALES ($MILLION)
FIGURE 60.JILIN PROVINCE SYNTHETIC PHARMACEUTICAL CO., LTD..: NET SALES ($MILLION
SELECT A FORMAT
Added to Cart
Electronic (PDF)

$5730

This license allows only one user to access the PDF.
Electronic (PDF)

$6450

This license allows 1 - 5 user to access the PDF, license is suitable for small groups of 5 users working together
Electronic (PDF)

$9600

This license allows users/teams in a same Enterprise to use this report, various departments within an enterpise can use this report
Electronic (PDF)

$3840

This license just provides quantitative data in a excel sheet
Add to Cart
Buy Now (15% Discount)

OUR CUSTOMER

Nano Dimension

SIMILAR REPORTS


RELATED REPORTS

Add to Cart

Coffee Concentrate Juice - Global Market Share and Ranking, Overall Sales and Demand Forecast 2024-2030

120 Pages
Type: Report
Code: QYRE-Auto-21X14223
Thu May 02 00:00:00 UTC 2024

Add to Cart

Nonfat Cocoa Liquor - Global Market Share and Ranking, Overall Sales and Demand Forecast 2024-2030

120 Pages
Type: Report
Code: QYRE-Auto-21D14221
Thu May 02 00:00:00 UTC 2024

Add to Cart

Citrus Bitters - Global Market Share and Ranking, Overall Sales and Demand Forecast 2024-2030

120 Pages
Type: Report
Code: QYRE-Auto-32K13882
Tue Apr 30 00:00:00 UTC 2024

Add to Cart