0
U.S. (TOLL FREE)
+1 (315) 215-3225
Automative

0
U.S. (TOLL FREE)
+1 (315) 215-3225
Asia-Pacific Big Data Analytics In Semiconductor & Electronics Market By Component (Solutions and Services), Deployment Mode (On-Premise and Cloud), End User (Semiconductor and Electronics), Analytical Tools (Dashboard and Data Visualization, Reporting, Self-Service Tools, Data Mining and Warehousing, and Others), Application (Customer Analytics, Supply Chain Analytics, Marketing Analytics, Pricing Analytics, Workforce Analytics, and Others), Usage (Sales & Marketing, Fault Detection & Classification, Predictive Maintenance, Virtual Meterology, Process Optimization, Yield Prediction, and Others) : Global Opportunity Analysis and Industry Forecast, 2020-2027
Published Date: December 2020
|
Report Code: ALLI-Auto-1B419
Home | Market Reports | Computers & Electronics| Enterprise Technology| Data Management
Asia Pacific Big Data Analytics In Semiconductor Electronics Market By Component Solutions and Services Deployment Mode On Premise and Cloud End User Semiconductor and Electronics Analytical Tools Dashboard and Data Visualization Reporting Self Service Tools Data Mining and Warehousing and Others Application Customer Analytics Supply Chain Analytics Marketing Analytics Pricing Analytics Workforce Analytics and Others Usage Sales Marketing Fault Detection Classification Predictive Maintenance Virtual Meterology Process Optimization Yield Prediction and Others Global Opportunity Analysis and Industry Forecast 2020 2027
BUY CHAPTERS

Asia-Pacific Big Data Analytics In Semiconductor & Electronics Market By Component (Solutions and Services), Deployment Mode (On-Premise and Cloud), End User (Semiconductor and Electronics), Analytical Tools (Dashboard and Data Visualization, Reporting, Self-Service Tools, Data Mining and Warehousing, and Others), Application (Customer Analytics, Supply Chain Analytics, Marketing Analytics, Pricing Analytics, Workforce Analytics, and Others), Usage (Sales & Marketing, Fault Detection & Classification, Predictive Maintenance, Virtual Meterology, Process Optimization, Yield Prediction, and Others) : Global Opportunity Analysis and Industry Forecast, 2020-2027

Code: ALLI-Auto-1B419
Report
December 2020
Pages:394
Allied Market Research
Buy Now with 15% Discount
DESCRIPTION
TABLE OF CONTENT
TABLES & FIGURES

Asia Pacific Big Data Analytics in Semiconductor & Electronics Market 

Asia-Pacific big data analytics in semiconductor & electronics market size was valued at USD 7,486.00 million in 2019, and is projected to reach USD 14,839.00 million by 2027, growing at a CAGR of 9.2% from 2020 to 2027.

APAC Big Data Analytics in Semiconductor & Electronics Market

The key objective of big data analytics in semiconductor & electronics is to help organizations get better understanding of their customers, business processes, and help organizations to narrow down their targeted audience, thus improving marketing campaign of companies. Numerous benefits are associated with big data analytics such as it allows customers to capture & process different services, modify existing orders, and process customer moves.

On the basis of analytics tools, dashboard & data visualization segment dominated the Asia-Pacific big data analytics in semiconductor & electronics market share in 2019, and is expected to maintain this trend during the forecast period as these tools help to identify the inter-relation between multi-dimensional sets of data and deliver practical features to interpret them. Thus, most enterprises are adopting these tools to scrutinize customer buying and other business operational patterns to forecast their future sale strategies. In addition, increase in acceptance of such platforms for software advisory along with predictive analysis propels expansion of the Asia-Pacific big data analytics in semiconductor & electronics market. However, the self-service tools segment is expected to witness highest growth as these tools are extensively used for data visualization to find various business insights that help improve decision-making capability of organizations and increase sales. In addition, self-service analytics helps business users to get benefitted from data collected and drive positive business outcome such as better operational efficiency and higher profits.

On the basis of application, the customer analytics segment dominated the market in 2019, and is expected to maintain this trend during the forecast period. Tools are extensively used for data visualization to find various business insights that help improve the decision-making capability of organizations and increase sales. In addition, self-service analytics helps business users to get benefitted from the data collected and drive positive business outcome such as better operational efficiency and higher profits. However, the pricing analytics segment is expected to witness highest growth, as pricing analytics has become an important component in revenue and profit management. Its adoption has increased significantly, which boosts growth of the market. Moreover, increase in focus of industries on revenue management to streamline business operations and improve overall financial performance is opportunistic for the Asia-Pacific big data analytics in semiconductor & electronics market growth.

In terms of region, China dominates the Asia-Pacific big data analytics in semiconductor & electronics market, owing to major shift toward digital transformation across semiconductor & electronics industry and rise in convergence of different technologies, such as big data & analytics and AI, have created an impact on the region and managed to increase its IT budget. Moreover, surge in need to manage massive volume of data generated by organizations due to technological advancements in data collection, visualization, and analytics drives growth of the big data analytics in semiconductor & electronics market. However, Vietnam is expected to observe highest growth rate during the Asia-Pacific big data analytics in semiconductor & electronics market forecast period, as the semiconductor industry in Vietnam is growing exponentially, owing to number of factors such as surge in volume of data generated due to digitization and growth in use of electronic devices & network in Vietnam.

The Asia-Pacific big data analytics in semiconductor & electronics market report focuses on the growth prospects, restraints, and market analysis. The study provides Porter’s five forces analysis of the asset performance management industry to understand the impact of various factors such as bargaining power of suppliers, competitive intensity of competitors, threat of new entrants, threat of substitutes, and bargaining power of buyers on the Asia-Pacific big data analytics in semiconductor & electronics market trends.

Segment Review

The Asia-Pacific big data analytics in semiconductor & electronics market is segmented into component, deployment model, end user, analytics tool, application, usage and region. In terms of component, the market is fragmented into software and services. On the basis of deployment mode, it is bifurcated into on-premise and cloud. Depending on end user, it is bifurcated into semiconductor and electronics. On the basis of analytics tool, it is categorized into dashboard & data visualization, data mining & warehousing, self-service tools, reporting, and others. By application, it is segregated into customer analytics, supply chain analytics, marketing analytics, pricing analytics, workforce analytics, and others. By usage, the market is segmented into sales & marketing, fault detection & classification, predictive maintenance, virtual meteorology, process optimization, yield prediction, and others. By country, Asia-Pacific big data analytics in semiconductor & electronics industry is divided into China, India, Japan, South Korea, Taiwan, Singapore, Malaysia, the Philippines, Thailand, Vietnam, and rest of Asia-Pacific.

Top Impacting Factors

The growth of the Asia-Pacific big data analytics in semiconductor & electronics industry is driven by factors such surge in adoption of big data analytics software by various organizations to facilitate enhanced & faster decision-making and to provide competitive advantage by analyzing and acting upon information in a timely manner. In addition, numerous benefits provided by big data and business analytics such as faster data processing positively impacts the growth of the Asia-Pacific big data analytics in semiconductor & electronics market. Moreover, high implementation cost and dearth of skilled workforce are expected to affect the market growth. Increase in need to gain better insights for business planning, emerging APC analytics applications and trends in semiconductor manufacturing facilities, and increase in adoption of IoT devices coupled with ongoing Industry 4.0 trend of the market during the forecast period. However, each of these factors is projected to have a definite impact on the growth of the big data analytics in semiconductor & electronics market.

Emerging advanced process control analytics applications and trends in semiconductor manufacturing facilities

The recent evolution in semiconductor manufacturing advanced process control (APC) applications reflects a movement from a more reactive to predictive and even proactive approach to factory control. Failure detection is augmented with failure prediction to support capabilities such as predictive maintenance. Metrology measurement prediction using virtual metrology is being leveraged to reduce cycle times due to metrology delay and improve process capability. In addition, predictive scheduling, initially at the process level and finally at the across-fab level, is being leveraged to reduce some capacity constraints. Yield prediction with feedback into process control, production scheduling, and maintenance scheduling is being explored so as to optimize the that fab-wide control to yield-throughput objectives. Eventually, these predictive solutions will extend more horizontally, incorporating upstream and downstream supply chain, thus presenting lucrative opportunities for big data analytics in semiconductor & electronics market during the forecast period.

Scope of Global APAC Big Data Analytics in Semiconductor & Electronics Market Report

Report Metric Details
Report Name APAC Big Data Analytics in Semiconductor & Electronics Market
Base Year 2020
Forecasted years 2021-2027
By Company SAP SE, INTERNATIONAL BUSINESS MACHINES CORPORATION, CISCO SYSTEMS, INC., SAS INSTITUTE INC., DELL EMC, TIBCO SOFTWARE INC., AMAZON WEB SERVICES, INC., KX SYSTEMS INC., MICROSOFT CORPORATION, SPLUNK INC.
Segment by Component
  • Solution
  • Services
Segment by Deployment Mode
  • Cloud Based
  • On Premise
Segment by Analytical Tool
  • Dashboard & Data Visualization
  • Reporting
  • Self Service Tools
  • Data Mining & Warehousing
  • Others
  • Dashboard & Data Visualization
  • Reporting
  • Self-service Tools
  • Data Mining & Warehousing
Segment by Application
  • Customer Analytics
  • Supply Chain Analytics
  • Marketing Analytics
  • Pricing Analytics
  • Workforce Analytics
Segment by End User
  • Semiconductor
  • Electronics
Consumption by Region
  • North America (United States, Canada)
  • Europe (Germany, France, UK, Italy, Russia)
  • Asia-Pacific (China, Japan, South Korea, Taiwan)
  • Southeast Asia (India)
  • Latin America (Mexico, Brazil)
Forecast units USD million in value
Report coverage Revenue and volume forecast, company share, competitive landscape, growth factors and trends
CHAPTER 1:INTRODUCTION
1.1.REPORT DESCRIPTION
1.2.KEY BENEFITS FOR STAKEHOLDERS
1.3.KEY MARKET SEGMENTS
1.4.RESEARCH METHODOLOGY
1.4.1.Secondary research
1.4.2.Primary research
1.4.3.Analyst tools & models
CHAPTER 2:EXECUTIVE SUMMARY
2.1.KEY FINDINGS
2.1.1.Top impacting factors
2.1.2.Top investment pockets
2.2.CXO PERSPECTIVE
CHAPTER 3:MARKET OVERVIEW
3.1.MARKET DEFINITION AND SCOPE
3.2.KEY FORCES SHAPING ASIA-PACIFIC BIG DATA ANALYTICS IN SEMICONDUCTOR & ELECTRONICS MARKET
3.3.CASE STUDY
3.3.1.Honeywell International Inc. adopted data and business analytics platform of Expedien Inc. to increase productivity, lower risk costs, accelerate growth, and lower risk of organizations
3.4.MARKET DYNAMICS
3.4.1.Drivers
3.4.1.1.Surge in the adoption of big data analytics solutions by multiple organizations
3.4.1.2.Increase in demand for cloud-based big data analytics solutions
3.4.1.3.Growing adoption due to numerous benefits provided by big data and business analytics solutions among emerging economies
3.4.2.Restraints
3.4.2.1.High implementation cost
3.4.2.2.Lack of skilled workforce
3.4.3.Opportunities
3.4.3.1.Increase in need to gain insights for business planning
3.4.3.2.Emerging advanced process control analytics applications and trends in semiconductor manufacturing facilities
3.4.3.3.Increase in adoption of IoT devices coupled with the ongoing Industry 4.0 trend
3.5.COVID-19 IMPACT ANALYSIS ON BIG DATA ANALYTICS IN SEMICONDUCTOR & ELECTRONICS MARKET
3.5.1.Impact on market size
3.5.2.Consumer trends, preferences, and budget impact
3.5.3.Economic impact
3.5.4.Strategies to tackle negative impact
3.5.5.Opportunity window
3.6.KEY FUTURE INITIATIVES
CHAPTER 4:ASIA-PACIFIC BIG DATA ANALYTICS IN SEMICONDUCTOR & ELECTRONICS MARKET, BY COMPONENT
4.1.OVERVIEW
4.2.SOLUTION
4.2.1.Key market trends, growth factors, and opportunities
4.2.2.Market size and forecast, by country
4.2.3.Market analysis, by country
4.3.SERVICES
4.3.1.Key market trends, growth factors, and opportunities
4.3.2.Market size and forecast, by country.
4.3.3.Market analysis, by country
CHAPTER 5:ASIA-PACIFIC BIG DATA ANALYTICS IN SEMICONDUCTOR & ELECTRONICS MARKET, BY DEPLOYMENT MODE
5.1.OVERVIEW
5.2.ON-PREMISE
5.2.1.Key market trends, growth factors, and opportunities
5.2.2.Market size and forecast, by country
5.2.3.Market analysis, by country
5.3.CLOUD
5.3.1.Key market trends, growth factors, and opportunities
5.3.2.Market size and forecast, by country.
5.3.3.Market analysis, by country
CHAPTER 6:ASIA-PACIFIC BIG DATA ANALYTICS IN SEMICONDUCTOR & ELECTRONICS MARKET, BY END USER
6.1.OVERVIEW
6.2.SEMICONDUCTOR
6.2.1.Key market trends, growth factors, and opportunities
6.2.2.Market size and forecast, by country
6.2.3.Market analysis, by country
6.3.ELECTRONICS
6.3.1.Key market trends, growth factors, and opportunities
6.3.2.Market size and forecast, by country
6.3.3.Market analysis, by country
CHAPTER 7:ASIA-PACIFIC BIG DATA ANALYTICS IN SEMICONDUCTOR & ELECTRONICS MARKET, BY ANALYTICS TOOL
7.1.OVERVIEW
7.2.DASHBOARD & DATA VISUALIZATION
7.2.1.Key market trends, growth factors, and opportunities
7.2.2.Market size and forecast, by country
7.2.3.Market analysis, by country
7.3.REPORTING TOOLS
7.3.1.Key market trends, growth factors, and opportunities
7.3.2.Market size and forecast, by country
7.3.3.Market analysis, by country
7.4.SELF-SERVICE TOOLS
7.4.1.Key market trends, growth factors, and opportunities
7.4.2.Big data analytics in semiconductor & electronics market, by self-service tool type
7.4.2.1.Role-based dashboards
7.4.2.2.Data governance
7.4.2.3.Metadata management
7.4.2.4.Data mashup
7.4.2.5.Visual data exploration
7.4.3.Market size and forecast, by country.
7.4.4.Market analysis, by country
7.5.DATA MINING & WAREHOUSING
7.5.1.Key market trends, growth factors, and opportunities
7.5.2.Market size and forecast, by country
7.5.3.Market analysis, by country
7.6.OTHERS
7.6.1.Key market trends, growth factors, and opportunities
7.6.2.Market size and forecast, by country
7.6.3.Market analysis, by country
CHAPTER 8:ASIA-PACIFIC BIG DATA ANALYTICS IN SEMICONDUCTOR & ELECTRONICS MARKET, BY APPLICATION
8.1.OVERVIEW
8.2.CUSTOMER ANALYTICS
8.2.1.Key market trends, growth factors, and opportunities
8.2.2.Market size and forecast, by country
8.2.3.Market analysis, by country
8.3.SUPPLY CHAIN ANALYTICS
8.3.1.Key market trends, growth factors, and opportunities
8.3.2.Market size and forecast, by country
8.3.3.Market analysis, by country
8.4.MARKETING ANALYTICS
8.4.1.Key market trends, growth factors, and opportunities
8.4.2.Market size and forecast, by country
8.4.3.Market analysis, by country
8.5.PRICING ANALYTICS
8.5.1.Key market trends, growth factors, and opportunities
8.5.2.Market size and forecast, by region
8.5.3.Market analysis, by country
8.6.WORKFORCE ANALYTICS
8.6.1.Key market trends, growth factors, and opportunities
8.6.2.Market size and forecast, by country
8.6.3.Market analysis, by country
8.7.OTHERS
8.7.1.Key market trends, growth factors, and opportunities
8.7.2.Market size and forecast, by country
8.7.3.Market analysis, by country
CHAPTER 9:ASIA-PACIFIC BIG DATA ANALYTICS IN SEMICONDUCTOR & ELECTRONICS MARKET, BY USAGE
9.1.OVERVIEW
9.2.SALES & MARKETING
9.2.1.Key market trends, growth factors, and opportunities
9.2.2.Market size and forecast, by country
9.2.3.Market analysis, by country
9.3.FAULT DETECTION & CLASSIFICATION
9.3.1.Key market trends, growth factors, and opportunities
9.3.2.Market size and forecast, by country
9.3.3.Market analysis, by country
9.4.PREDICTIVE MAINTENANCE
9.4.1.Key market trends, growth factors, and opportunities
9.4.2.Market size and forecast, by country
9.4.3.Market analysis, by country
9.5.VIRTUAL METROLOGY
9.5.1.Key market trends, growth factors, and opportunities
9.5.2.Market size and forecast, by country
9.5.3.Market analysis, by country
9.6.PROCESS OPTIMIZATION
9.6.1.Key market trends, growth factors, and opportunities
9.6.2.Market size and forecast, by country
9.6.3.Market analysis, by country
9.7.YIELD PREDICTION
9.7.1.Key market trends, growth factors, and opportunities
9.7.2.Market size and forecast, by country
9.7.3.Market analysis, by country
9.8.OTHERS
9.8.1.Key market trends, growth factors, and opportunities
9.8.2.Market size and forecast, by country
9.8.3.Market analysis, by country
CHAPTER 10:ASIA-PACIFIC BIG DATA ANALYTICS IN SEMICONDUCTOR & ELECTRONICS MARKET, BY COUNTRY
10.1.OVERVIEW
10.1.1.Market size and forecast, by country
10.1.1.1.China
10.1.1.1.1.Market size and forecast, by component
10.1.1.1.2.Market size and forecast, by deployment mode
10.1.1.1.3.Market size and forecast, by end user
10.1.1.1.4.Market size and forecast, by analytics tool
10.1.1.1.5.Market size and forecast, by application
10.1.1.1.6.Market size and forecast, by usage
10.1.1.2.India
10.1.1.2.1.Market size and forecast, by component
10.1.1.2.2.Market size and forecast, by deployment mode
10.1.1.2.3.Market size and forecast, by end user
10.1.1.2.4.Market size and forecast, by analytics tool
10.1.1.2.5.Market size and forecast, by application
10.1.1.2.6.Market size and forecast, by usage
10.1.1.3.Japan
10.1.1.3.1.Market size and forecast, by component
10.1.1.3.2.Market size and forecast, by deployment mode
10.1.1.3.3.Market size and forecast, by end user
10.1.1.3.4.Market size and forecast, by analytics tool
10.1.1.3.5.Market size and forecast, by application
10.1.1.3.6.Market size and forecast, by usage
10.1.1.4.South Korea
10.1.1.4.1.Market size and forecast, by component
10.1.1.4.2.Market size and forecast, by deployment mode
10.1.1.4.3.Market size and forecast, by end user
10.1.1.4.4.Market size and forecast, by analytics tool
10.1.1.4.5.Market size and forecast, by application
10.1.1.4.6.Market size and forecast, by usage
10.1.1.5.Taiwan
10.1.1.5.1.Market size and forecast, by component
10.1.1.5.2.Market size and forecast, by deployment mode
10.1.1.5.3.Market size and forecast, by end user
10.1.1.5.4.Market size and forecast, by analytics tool
10.1.1.5.5.Market size and forecast, by application
10.1.1.5.6.Market size and forecast, by usage
10.1.1.6.Singapore
10.1.1.6.1.Market size and forecast, by component
10.1.1.6.2.Market size and forecast, by deployment mode
10.1.1.6.3.Market size and forecast, by end user
10.1.1.6.4.Market size and forecast, by analytics tool
10.1.1.6.5.Market size and forecast, by application
10.1.1.6.6.Market size and forecast, by usage
10.1.1.7.Malaysia
10.1.1.7.1.Market size and forecast, by component
10.1.1.7.2.Market size and forecast, by deployment mode
10.1.1.7.3.Market size and forecast, by end user
10.1.1.7.4.Market size and forecast, by analytics tool
10.1.1.7.5.Market size and forecast, by application
10.1.1.7.6.Market size and forecast, by usage
10.1.1.8.Philippines
10.1.1.8.1.Market size and forecast, by component
10.1.1.8.2.Market size and forecast, by deployment mode
10.1.1.8.3.Market size and forecast, by end user
10.1.1.8.4.Market size and forecast, by analytics tool
10.1.1.8.5.Market size and forecast, by application
10.1.1.8.6.Market size and forecast, by usage
10.1.1.9.Thailand
10.1.1.9.1.Market size and forecast, by component
10.1.1.9.2.Market size and forecast, by deployment mode
10.1.1.9.3.Market size and forecast, by end user
10.1.1.9.4.Market size and forecast, by analytics tool
10.1.1.9.5.Market size and forecast, by application
10.1.1.9.6.Market size and forecast, by usage
10.1.1.10.Vietnam
10.1.1.10.1.Market size and forecast, by component
10.1.1.10.2.Market size and forecast, by deployment mode
10.1.1.10.3.Market size and forecast, by end user
10.1.1.10.4.Market size and forecast, by analytics tool
10.1.1.10.5.Market size and forecast, by application
10.1.1.10.6.Market size and forecast, by usage
10.1.1.11.Rest of Asia-Pacific
10.1.1.11.1.Market size and forecast, by component
10.1.1.11.2.Market size and forecast, by deployment mode
10.1.1.11.3.Market size and forecast, by end user
10.1.1.11.4.Market size and forecast, by analytics tool
10.1.1.11.5.Market size and forecast, by application
10.1.1.11.6.Market size and forecast, by usage
CHAPTER 11:COMPETITIVE LANDSCAPE
11.1.KEY PLAYERS POSITIONING ANALYSIS, 2019
11.2.COMPETITIVE DASHBOARD
11.3.TOP WINNING STRATEGIES
11.4.KEY DEVELOPMENTS
11.4.1.Partnership
11.4.2.Collaboration
11.4.3.Acquisition
11.4.4.Product development
11.4.5.Business Expansion
CHAPTER 12:COMPANY PROFILES
12.1.AMAZON WEB SERVICES, INC.
12.1.1.Company overview
12.1.2.Key executives
12.1.3.Company snapshot
12.1.4.Operating business segments
12.1.5.Product portfolio
12.1.6.Business performance
12.1.7.Key strategic moves and developments
12.2.CISCO SYSTEMS, INC.
12.2.1.Company overview
12.2.2.Key executives
12.2.3.Company snapshot
12.2.4.Operating business segments
12.2.5.Product portfolio
12.2.6.R&D expenditure
12.2.7.Business performance
12.2.8.Key strategic moves and developments
12.3.DELL EMC
12.3.1.Company overview
12.3.2.Key executive
12.3.3.Company snapshot
12.3.4.Operating business segments
12.3.5.Product portfolio
12.3.6.R&D expenditure
12.3.7.Business performance
12.3.8.Key strategic moves and developments
12.4.INTERNATIONAL BUSINESS MACHINES CORPORATION
12.4.1.Company overview
12.4.2.Key executive
12.4.3.Company snapshot
12.4.4.Operating business segments
12.4.5.Product portfolio
12.4.6.R&D expenditure
12.4.7.Business performance
12.4.8.Key strategic moves and developments
12.5.KX SYSTEMS INC.
12.5.1.Company overview
12.5.2.Key executive
12.5.3.Company snapshot
12.5.4.Operating business segments
12.5.5.Product portfolio
12.5.6.R&D expenditure
12.5.7.Business performance
12.5.8.Key strategic moves and developments
12.6.MICROSOFT CORPORATION
12.6.1.Company overview
12.6.2.Key executives
12.6.3.Company snapshot
12.6.4.Operating business segments
12.6.5.Product portfolio
12.6.6.R&D expenditure
12.6.7.Business performance
12.6.8.Key strategic moves and developments
12.7.SAP SE
12.7.1.Company overview
12.7.2.Key executive
12.7.3.Company snapshot
12.7.4.Operating business segments
12.7.5.Product portfolio
12.7.6.R&D expenditure
12.7.7.Business performance
12.7.8.Key strategic moves and developments
12.8.SAS INSTITUTE INC.
12.8.1.Company overview
12.8.2.Key executive
12.8.3.Company snapshot
12.8.4.Product portfolio
12.8.5.Business performance
12.8.6.Key strategic moves and developments
12.9.SPLUNK INC.
12.9.1.Company overview
12.9.2.Key executive
12.9.3.Company snapshot
12.9.4.Product portfolio
12.9.5.R&D expenditure
12.9.6.Business performance
12.9.7.Key strategic moves and developments
12.10.TIBCO SOFTWARE INC.
12.10.1.Company overview
12.10.2.Key executive
12.10.3.Company snapshot
12.10.4.Product portfolio
12.10.5.Key strategic moves and development
LIST OF TABLES

TABLE 01.ASIA-PACIFIC BIG DATA ANALYTICS IN SEMICONDUCTOR & ELECTRONICS MARKET REVENUE, BY COMPONENT, 2019–2027 ($MILLION)
TABLE 02.ASIA-PACIFIC BIG DATA ANALYTICS SOLUTION IN SEMICONDUCTOR & ELECTRONICS MARKET REVENUE, BY COUNTRY, 2019–2027 ($MILLION)
TABLE 03.ASIA- PACIFIC BIG DATA ANALYTICS IN SEMICONDUCTOR & ELECTRONICS MARKET SERVICE REVENUE, BY COUNTRY, 2019–2027 ($MILLION)
TABLE 04.ASIA-PACIFIC BIG DATA ANALYTICS IN SEMICONDUCTOR & ELECTRONICS MARKET REVENUE, BY DEPLOYMENT MODE, 2019–2027 ($MILLION)
TABLE 05.ASIA-PACIFIC BIG DATA ANALYTICS SOFTWARE IN SEMICONDUCTOR & ELECTRONICS MARKET REVENUE FOR ON-PREMISE DEPLOYMENT, BY COUNTRY, 2019–2027 ($MILLION)
TABLE 06.ASIA-PACIFIC BIG DATA ANALYTICS IN SEMICONDUCTOR & ELECTRONICS MARKET REVENUE FOR CLOUD-BASED DEPLOYMENT, BY COUNTRY, 2019–2027 ($MILLION)
TABLE 07.ASIA-PACIFIC BIG DATA ANALYTICS IN SEMICONDUCTOR & ELECTRONICS MARKET REVENUE, BY END USER, 2019-2027 ($MILLION)
TABLE 08.ASIA-PACIFIC BIG DATA ANALYTICS IN SEMICONDUCTOR & ELECTRONICS MARKET FOR SEMICONDUCTOR, BY COUNTRY, 2019–2027 ($MILLION)
TABLE 09.ASIA-PACIFIC BIG DATA ANALYTICS IN SEMICONDUCTOR & ELECTRONICS MARKET REVENUE FOR ELECTRONICS, BY COUNTRY, 2019-2027 ($MILLION)
TABLE 10.ASIA PACIFIC BIG DATA ANALYTICS IN SEMICONDUCTOR & ELECTRONICS MARKET REVENUE, BY ANALYTICS TOOL, 2019–2027 ($MILLION)
TABLE 11.ASIA-PACIFIC BIG DATA ANALYTICS IN SEMICONDUCTOR & ELECTRONICS MARKET REVENUE FOR DASHBOARD & DATA VISUALIZATION, BY COUNTRY, 2019–2027 ($MILLION)
TABLE 12.ASIA-PACIFIC BIG DATA ANALYTICS IN SEMICONDUCTOR & ELECTRONICS MARKET REVENUE FOR REPORTING TOOLS, BY COUNTRY, 2019–2027 ($MILLION)
TABLE 13.ASIA-PACIFIC BIG DATA ANALYTICS IN SEMICONDUCTOR & ELECTRONICS MARKET REVENUE FOR SELF-SERVICE TOOLS, BY COUNTRY, 2019–2027 ($MILLION)
TABLE 14.ASIA-PACIFIC BIG DATA ANALYTICS IN SEMICONDUCTOR & ELECTRONICS MARKET REVENUE FOR DATA MINING & WAREHOUSING, BY COUNTRY, 2019–2027 ($MILLION)
TABLE 15.ASIA-PACIFIC BIG DATA ANALYTICS IN SEMICONDUCTOR & ELECTRONICS MARKET REVENUE FOR OTHERS, BY COUNTRY, 2019–2027 ($MILLION)
TABLE 16.ASIS PACIFIC BIG DATA ANALYTICS IN SEMICONDUCTOR & ELECTRONICS MARKET REVENUE, BY APPLICATION, 2019-2027 ($MILLION)
TABLE 17.ASIA-PACIFIC BIG DATA ANALYTICS IN SEMICONDUCTOR & ELECTRONICS MARKET REVENUE FOR CUSTOMER ANALYTICS, BY COUNTRY, 2019-2027 ($MILLION)
TABLE 18.ASIA-PACIFIC BIG DATA ANALYTICS IN SEMICONDUCTOR & ELECTRONICS MARKET REVENUE FOR SUPPLY CHAIN ANALYTICS, BY COUNTRY, 2019-2027 ($MILLION)
TABLE 19.ASIA-PACIFIC BIG DATA ANALYTICS IN SEMICONDUCTOR & ELECTRONICS MARKET REVENUE FOR MARKETING ANALYTICS, BY COUNTRY, 2019-2027 ($MILLION)
TABLE 20.ASIA-PACIFIC BIG DATA ANALYTICS IN SEMICONDUCTOR & ELECTRONICS MARKET REVENUE FOR OF PRICING ANALYTICS, BY REGION, 2019-2027 ($MILLION)
TABLE 21.ASIA-PACIFIC BIG DATA ANALYTICS IN SEMICONDUCTOR & ELECTRONICS MARKET REVENUE FOR WORKFORCE ANALYTICS, BY COUNTRY, 2019-2027 ($MILLION)
TABLE 22.ASIA-PACIFIC BIG DATA ANALYTICS IN SEMICONDUCTOR & ELECTRONICS MARKET REVENUE FOR OTHERS, BY COUNTRY, 2019-2027 ($MILLION)
TABLE 23.ASIS-PACIFIC BIG DATA ANALYTICS IN SEMICONDUCTOR & ELECTRONICS MARKET REVENUE, BY USAGE, 2019-2027 ($MILLION)
TABLE 24.ASIA-PACIFIC BIG DATA ANALYTICS IN SEMICONDUCTOR & ELECTRONICS MARKET REVENUE FOR SALES AND MARKETING, COUNTRY, 2019-2027 ($MILLION)
TABLE 25.ASIA-PACIFIC BIG DATA ANALYTICS IN SEMICONDUCTOR & ELECTRONICS MARKET REVENUE FOR FAULT DETECTION AND CLASSIFICATION, BY COUNTRY, 2019-2027 ($MILLION)
TABLE 26.ASIA-PACIFIC BIG DATA ANALYTICS IN SEMICONDUCTOR & ELECTRONICS MARKET REVENUE FOR PREDICTIVE MAINTENANCE, BY COUNTRY, 2019-2027 ($MILLION)
TABLE 27.ASIA-PACIFIC BIG DATA ANALYTICS IN SEMICONDUCTOR & ELECTRONICS MARKET REVENUE FOR OF VIRTUAL METROLOGY, BY REGION, 2019-2027 ($MILLION)
TABLE 28.ASIA-PACIFIC BIG DATA ANALYTICS IN SEMICONDUCTOR & ELECTRONICS MARKET REVENUE FOR PROCESS OPTIMIZATION, BY COUNTRY, 2019-2027 ($MILLION)
TABLE 29.ASIA-PACIFIC BIG DATA ANALYTICS IN SEMICONDUCTOR & ELECTRONICS MARKET REVENUE FOR YIELD PREICTION, BY COUNTRY, 2019-2027 ($MILLION)
TABLE 30.ASIA-PACIFIC BIG DATA ANALYTICS IN SEMICONDUCTOR & ELECTRONICS MARKET REVENUE FOR OTHERS, BY COUNTRY, 2019-2027 ($MILLION)
TABLE 31.ASIA-PACIFIC BIG DATA ANALYTICS IN SEMICONDUCTOR & ELECTRONICS MARKET REVENUE, BY COUNTRY, 2019–2027 ($MILLION)
TABLE 32.CHINA BIG DATA ANALYTICS IN SEMICONDUCTOR & ELECTRONICS MARKET REVENUE, BY COMPONENT, 2019–2027 ($MILLION)
TABLE 33.CHINA BIG DATA ANALYTICS IN SEMICONDUCTOR & ELECTRONICS MARKET REVENUE, BY DEPLOYMENT MODE, 2019–2027 ($MILLION)
TABLE 34.CHINA BIG DATA ANALYTICS IN SEMICONDUCTOR & ELECTRONICS MARKET REVENUE, BY END USER, 2019–2027 ($MILLION)
TABLE 35.CHINA BIG DATA ANALYTICS IN SEMICONDUCTOR & ELECTRONICS MARKET REVENUE, BY ANALYTICS TOOL, 2019–2027 ($MILLION)
TABLE 36.CHINA BIG DATA ANALYTICS IN SEMICONDUCTOR & ELECTRONICS MARKET REVENUE, BY APPLICATION, 2019–2027 ($MILLION)
TABLE 37.CHINA BIG DATA ANALYTICS IN SEMICONDUCTOR & ELECTRONICS MARKET REVENUE, BY USAGE, 2019–2027 ($MILLION)
TABLE 38.INDIA BIG DATA ANALYTICS IN SEMICONDUCTOR & ELECTRONICS MARKET REVENUE, BY COMPONENT, 2019–2027 ($MILLION)
TABLE 39.INDIA BIG DATA ANALYTICS IN SEMICONDUCTOR & ELECTRONICS MARKET REVENUE, BY DEPLOYMENT MODE, 2019–2027 ($MILLION)
TABLE 40.INDIA BIG DATA ANALYTICS IN SEMICONDUCTOR & ELECTRONICS MARKET REVENUE, BY END USER, 2019–2027 ($MILLION)
TABLE 41.INDIA BIG DATA ANALYTICS IN SEMICONDUCTOR & ELECTRONICS MARKET REVENUE, BY ANALYTICS TOOL, 2019–2027 ($MILLION)
TABLE 42.INDIA BIG DATA ANALYTICS IN SEMICONDUCTOR & ELECTRONICS MARKET REVENUE, BY APPLICATION, 2019–2027 ($MILLION)
TABLE 43.INDIA BIG DATA ANALYTICS IN SEMICONDUCTOR & ELECTRONICS MARKET REVENUE, BY USAGE, 2019–2027 ($MILLION)
TABLE 44.JAPAN BIG DATA ANALYTICS IN SEMICONDUCTOR & ELECTRONICS MARKET REVENUE, BY COMPONENT, 2019–2027 ($MILLION)
TABLE 45.JAPAN BIG DATA ANALYTICS IN SEMICONDUCTOR & ELECTRONICS MARKET REVENUE, BY DEPLOYMENT MODE, 2019–2027 ($MILLION)
TABLE 46.JAPAN BIG DATA ANALYTICS IN SEMICONDUCTOR & ELECTRONICS MARKET REVENUE, BY END USER, 2019–2027 ($MILLION)
TABLE 47.JAPAN BIG DATA ANALYTICS IN SEMICONDUCTOR & ELECTRONICS MARKET REVENUE, BY ANALYTICS TOOL, 2019–2027 ($MILLION)
TABLE 48.JAPAN BIG DATA ANALYTICS IN SEMICONDUCTOR & ELECTRONICS MARKET REVENUE, BY APPLICATION, 2019–2027 ($MILLION)
TABLE 49.JAPAN BIG DATA ANALYTICS IN SEMICONDUCTOR & ELECTRONICS MARKET REVENUE, BY USAGE, 2019–2027 ($MILLION)
TABLE 50.SOUTH KOREA BIG DATA ANALYTICS IN SEMICONDUCTOR & ELECTRONICS MARKET REVENUE, BY COMPONENT, 2019–2027 ($MILLION)
TABLE 51.SOUTH KOREA BIG DATA ANALYTICS IN SEMICONDUCTOR & ELECTRONICS MARKET REVENUE, BY DEPLOYMENT MODE, 2019–2027 ($MILLION)
TABLE 52.SOUTH KOREA BIG DATA ANALYTICS IN SEMICONDUCTOR & ELECTRONICS MARKET REVENUE, BY END USER, 2019–2027 ($MILLION)
TABLE 53.SOUTH KOREA BIG DATA ANALYTICS IN SEMICONDUCTOR & ELECTRONICS MARKET REVENUE, BY ANALYTICS TOOL, 2019–2027 ($MILLION)
TABLE 54.SOUTH KOREA BIG DATA ANALYTICS IN SEMICONDUCTOR & ELECTRONICS MARKET REVENUE, BY APPLICATION, 2019–2027 ($MILLION)
TABLE 55.SOUTH KOREA BIG DATA ANALYTICS IN SEMICONDUCTOR & ELECTRONICS MARKET REVENUE, BY USAGE, 2019–2027 ($MILLION)
TABLE 56.TAIWAN BIG DATA ANALYTICS IN SEMICONDUCTOR & ELECTRONICS MARKET REVENUE, BY COMPONENT, 2019–2027 ($MILLION)
TABLE 57.TAIWAN BIG DATA ANALYTICS IN SEMICONDUCTOR & ELECTRONICS MARKET REVENUE, BY DEPLOYMENT MODE, 2019–2027 ($MILLION)
TABLE 58.TAIWAN BIG DATA ANALYTICS IN SEMICONDUCTOR & ELECTRONICS MARKET REVENUE, BY END USER, 2019–2027 ($MILLION)
TABLE 59.TAIWAN BIG DATA ANALYTICS IN SEMICONDUCTOR & ELECTRONICS MARKET REVENUE, BY ANALYTICS TOOL, 2019–2027 ($MILLION)
TABLE 60.TAIWAN BIG DATA ANALYTICS IN SEMICONDUCTOR & ELECTRONICS MARKET REVENUE, BY APPLICATION, 2019–2027 ($MILLION)
TABLE 61.TAIWAN BIG DATA ANALYTICS IN SEMICONDUCTOR & ELECTRONICS MARKET REVENUE, BY USAGE, 2019–2027 ($MILLION)
TABLE 62.SINGAPORE BIG DATA ANALYTICS IN SEMICONDUCTOR & ELECTRONICS MARKET REVENUE, BY COMPONENT, 2019–2027 ($MILLION)
TABLE 63.SINGAPORE BIG DATA ANALYTICS IN SEMICONDUCTOR & ELECTRONICS MARKET REVENUE, BY DEPLOYMENT MODE, 2019–2027 ($MILLION)
TABLE 64.SINGAPORE BIG DATA ANALYTICS IN SEMICONDUCTOR & ELECTRONICS MARKET REVENUE, BY END USER, 2019–2027 ($MILLION)
TABLE 65.SINGAPORE BIG DATA ANALYTICS IN SEMICONDUCTOR & ELECTRONICS MARKET REVENUE, BY ANALYTICS TOOL, 2019–2027 ($MILLION)
TABLE 66.SINGAPORE BIG DATA ANALYTICS IN SEMICONDUCTOR & ELECTRONICS MARKET REVENUE, BY APPLICATION, 2019–2027 ($MILLION)
TABLE 67.SINGAPORE BIG DATA ANALYTICS IN SEMICONDUCTOR & ELECTRONICS MARKET REVENUE, BY USAGE, 2019–2027 ($MILLION)
TABLE 68.MALAYSIA BIG DATA ANALYTICS IN SEMICONDUCTOR & ELECTRONICS MARKET REVENUE, BY COMPONENT, 2019–2027 ($MILLION)
TABLE 69.MALAYSIA BIG DATA ANALYTICS IN SEMICONDUCTOR & ELECTRONICS MARKET REVENUE, BY DEPLOYMENT MODE, 2019–2027 ($MILLION)
TABLE 70.MALAYSIA BIG DATA ANALYTICS IN SEMICONDUCTOR & ELECTRONICS MARKET REVENUE, BY END USER, 2019–2027 ($MILLION)
TABLE 71.MALAYSIA BIG DATA ANALYTICS IN SEMICONDUCTOR & ELECTRONICS MARKET REVENUE, BY ANALYTICS TOOL, 2019–2027 ($MILLION)
TABLE 72.MALAYSIA BIG DATA ANALYTICS IN SEMICONDUCTOR & ELECTRONICS MARKET REVENUE, BY APPLICATION, 2019–2027 ($MILLION)
TABLE 73.MALAYSIA BIG DATA ANALYTICS IN SEMICONDUCTOR & ELECTRONICS MARKET REVENUE, BY USAGE, 2019–2027 ($MILLION)
TABLE 74.PHILIPPINES BIG DATA ANALYTICS IN SEMICONDUCTOR & ELECTRONICS MARKET REVENUE, BY COMPONENT, 2019–2027 ($MILLION)
TABLE 75.PHILIPPINES BIG DATA ANALYTICS IN SEMICONDUCTOR & ELECTRONICS MARKET REVENUE, BY DEPLOYMENT MODE, 2019–2027 ($MILLION)
TABLE 76.PHILIPPINES BIG DATA ANALYTICS IN SEMICONDUCTOR & ELECTRONICS MARKET REVENUE, BY END USER, 2019–2027 ($MILLION)
TABLE 77.PHILIPPINES BIG DATA ANALYTICS IN SEMICONDUCTOR & ELECTRONICS MARKET REVENUE, BY ANALYTICS TOOL, 2019–2027 ($MILLION)
TABLE 78.PHILIPPINES BIG DATA ANALYTICS IN SEMICONDUCTOR & ELECTRONICS MARKET REVENUE, BY APPLICATION, 2019–2027 ($MILLION)
TABLE 79.PHILIPPINES BIG DATA ANALYTICS IN SEMICONDUCTOR & ELECTRONICS MARKET REVENUE, BY USAGE, 2019–2027 ($MILLION)
TABLE 80.THAILAND BIG DATA ANALYTICS IN SEMICONDUCTOR & ELECTRONICS MARKET REVENUE, BY COMPONENT, 2019–2027 ($MILLION)
TABLE 81.THAILAND BIG DATA ANALYTICS IN SEMICONDUCTOR & ELECTRONICS MARKET REVENUE, BY DEPLOYMENT MODE, 2019–2027 ($MILLION)
TABLE 82.THAILAND BIG DATA ANALYTICS IN SEMICONDUCTOR & ELECTRONICS MARKET REVENUE, BY END USER, 2019–2027 ($MILLION)
TABLE 83.THAILAND BIG DATA ANALYTICS IN SEMICONDUCTOR & ELECTRONICS MARKET REVENUE, BY ANALYTICS TOOL, 2019–2027 ($MILLION)
TABLE 84.THAILAND BIG DATA ANALYTICS IN SEMICONDUCTOR & ELECTRONICS MARKET REVENUE, BY APPLICATION, 2019–2027 ($MILLION)
TABLE 85.THAILAND BIG DATA ANALYTICS IN SEMICONDUCTOR & ELECTRONICS MARKET REVENUE, BY USAGE, 2019–2027 ($MILLION)
TABLE 86.VIETNAM BIG DATA ANALYTICS IN SEMICONDUCTOR & ELECTRONICS MARKET REVENUE, BY COMPONENT, 2019–2027 ($MILLION)
TABLE 87.VIETNAM BIG DATA ANALYTICS IN SEMICONDUCTOR & ELECTRONICS MARKET REVENUE, BY DEPLOYMENT MODE, 2019–2027 ($MILLION)
TABLE 88.VIETNAM BIG DATA ANALYTICS IN SEMICONDUCTOR & ELECTRONICS MARKET REVENUE, BY END USER, 2019–2027 ($MILLION)
TABLE 89.VIETNAM BIG DATA ANALYTICS IN SEMICONDUCTOR & ELECTRONICS MARKET REVENUE, BY ANALYTICS TOOL, 2019–2027 ($MILLION)
TABLE 90.VIETNAM BIG DATA ANALYTICS IN SEMICONDUCTOR & ELECTRONICS MARKET REVENUE, BY APPLICATION, 2019–2027 ($MILLION)
TABLE 91.VIETNAM BIG DATA ANALYTICS IN SEMICONDUCTOR & ELECTRONICS MARKET REVENUE, BY USAGE, 2019–2027 ($MILLION)
TABLE 92.REST OF ASIA-PACIFIC BIG DATA ANALYTICS IN SEMICONDUCTOR & ELECTRONICS MARKET REVENUE, BY COMPONENT, 2019–2027 ($MILLION)
TABLE 93.REST OF ASIA-PACIFIC BIG DATA ANALYTICS IN SEMICONDUCTOR & ELECTRONICS MARKET REVENUE, BY DEPLOYMENT MODE, 2019–2027 ($MILLION)
TABLE 94.REST OF ASIA-PACIFIC BIG DATA ANALYTICS IN SEMICONDUCTOR & ELECTRONICS MARKET REVENUE, BY END USER, 2019–2027 ($MILLION)
TABLE 95.REST OF ASIA-PACIFIC BIG DATA ANALYTICS IN SEMICONDUCTOR & ELECTRONICS MARKET REVENUE, BY ANALYTICS TOOL, 2019–2027 ($MILLION)
TABLE 96.REST OF ASIA-PACIFIC BIG DATA ANALYTICS IN SEMICONDUCTOR & ELECTRONICS MARKET REVENUE, BY APPLICATION, 2019–2027 ($MILLION)
TABLE 97.REST OF ASIA-PACIFIC BIG DATA ANALYTICS IN SEMICONDUCTOR & ELECTRONICS MARKET REVENUE, BY USAGE, 2019–2027 ($MILLION)
TABLE 98.KEY NEW PRODUCT LAUNCHES (2017-2020)
TABLE 99.PARTNERSHIP (2017-2020)
TABLE 100.COLLABORATION (2017-2020)
TABLE 101.ACQUISITION (2017-2020)
TABLE 102.PRODUCT DEVELOPMENT (2017-2020)
TABLE 103.BUSINESS EXPANSION (2017-2020)
TABLE 104.AMAZON WEB SERVICES, INC.: KEY EXECUTIVE
TABLE 105.AMAZON WEB SERVICES, INC.: COMPANY SNAPSHOT
TABLE 106.AMAZON WEB SERVICES, INC.: OPERATING SEGMENTS
TABLE 107.AMAZON WEB SERVICES, INC.: PRODUCT PORTFOLIO
TABLE 108.CISCO SYSTEMS, INC.: KEY EXECUTIVE
TABLE 109.CISCO SYSTEMS, INC.: COMPANY SNAPSHOT
TABLE 110.CISCO SYSTEMS, INC.: OPERATING SEGMENTS
TABLE 111.CISCO SYSTEMS, INC.: PRODUCT PORTFOLIO
TABLE 112.DELL EMC: KEY EXECUTIVE
TABLE 113.DELL EMC: COMPANY SNAPSHOT
TABLE 114.DELL EMC: OPERATING SEGMENTS
TABLE 115.DELL EMC: PRODUCT PORTFOLIO
TABLE 116.INTERNATIONAL BUSINESS MACHINES CORPORATION: KEY EXECUTIVE
TABLE 117.INTERNATIONAL BUSINESS MACHINES CORPORATION: COMPANY SNAPSHOT
TABLE 118.INTERNATIONAL BUSINESS MACHINES CORPORATION: OPERATING SEGMENTS
TABLE 119.INTERNATIONAL BUSINESS MACHINES CORPORATION: PRODUCT PORTFOLIO
TABLE 120.KX SYSTEMS, INC.: KEY EXECUTIVE
TABLE 121.KX SYSTEMS, INC.: COMPANY SNAPSHOT
TABLE 122.KX SYSTEMS, INC.: REVENUE STREAMS
TABLE 123.KX SYSTEMS, INC.: PRODUCT PORTFOLIO
TABLE 124.MICROSOFT CORPORATION: KEY EXECUTIVE
TABLE 125.MICROSOFT CORPORATION: COMPANY SNAPSHOT
TABLE 126.MICROSOFT CORPORATION: OPERATING SEGMENTS
TABLE 127.MICROSOFT CORPORATION: PRODUCT PORTFOLIO
TABLE 128.SAP SE: KEY EXECUTIVE
TABLE 129.SAP SE: COMPANY SNAPSHOT
TABLE 130.SAP SE: OPERATING SEGMENTS
TABLE 131.SAP SE: PRODUCT PORTFOLIO
TABLE 132.SAS INSTITUTE INC.: KEY EXECUTIVE
TABLE 133.SAS INSTITUTE INC.: COMPANY SNAPSHOT
TABLE 134.SAS INSTITUTE INC.: PRODUCT PORTFOLIO
TABLE 135.SPLUNK INC.: KEY EXECUTIVE
TABLE 136.SPLUNK INC.: COMPANY SNAPSHOT
TABLE 137.SPLUNK INC.: PRODUCT PORTFOLIO
TABLE 138.SPLUNK INC.: KEY STRATEGIC MOVES AND DEVELOPMENTS
TABLE 139.TIBCO SOFTWARE INC.: KEY EXECUTIVE
TABLE 140.TIBCO SOFTWARE INC.: COMPANY SNAPSHOT
TABLE 141.TIBCO SOFTWARE INC.: PRODUCT PORTFOLIO LIST OF FIGURES

FIGURE 01.KEY MARKET SEGMENTS
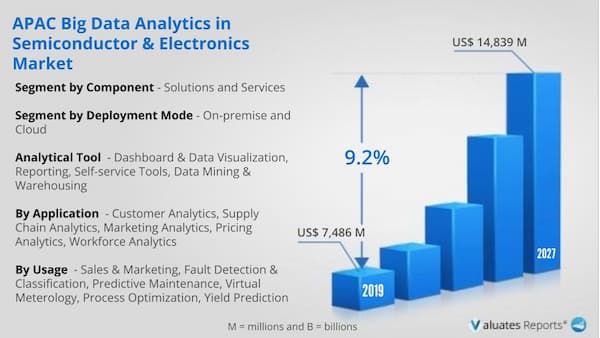
FIGURE 02.ASIA-PACIFIC BIG DATA ANALYTICS IN SEMICONDUCTOR & ELECTRONICS MARKET SNAPSHOT, BY SEGMENTATION, 2019–2027
FIGURE 03.ASIA-PACIFIC BIG DATA ANALYTICS IN SEMICONDUCTOR & ELECTRONICS MARKET SNAPSHOT, BY SEGMENTATION, 2019–2027
FIGURE 04.BIG DATA ANALYTICS IN SEMICONDUCTOR & ELECTRONICS MARKET SNAPSHOT, BY COUNTRY, 2019–2027
FIGURE 05.BIG DATA ANALYTICS IN SEMICONDUCTOR & ELECTRONICS MARKET: TOP IMPACTING FACTOR
FIGURE 06.TOP INVESTMENT POCKETS
FIGURE 07.MODERATE BARGAINING POWER OF SUPPLIERS
FIGURE 08.MODERATE-TO-HIGH BARGAINING POWER OF BUYERS
FIGURE 09.MODERATE THREAT OF SUBSTITUTES
FIGURE 10.MODERATE THREAT OF NEW ENTRANTS
FIGURE 11.HIGH COMPETITIVE RIVALRY
FIGURE 12.MARKET DYNAMICS
FIGURE 13.ASIA-PACIFIC BIG DATA ANALYTICS IN SEMICONDUCTOR & ELECTRONICS MARKET, BY DEPLOYMENT MODE, 2019-2027
FIGURE 14.COMPARATIVE SHARE ANALYSIS OF ASIA-PACIFIC BIG DATA ANALYTICS SOLUTION IN SEMICONDUCTOR & ELECTRONICS MARKET, BY COUNTRY, 2019 & 2027(%)
FIGURE 15.COMPARATIVE SHARE ANALYSIS OF ASIA-PACIFIC BIG DATA AND BUSINESS ANALYTICS SERVICES MARKET, BY COUNTRY, 2019 & 2027(%)
FIGURE 16.ASIA-PACIFIC BIG DATA ANALYTICS IN SEMICONDUCTOR & ELECTRONICS MARKET, BY DEPLOYMENT MODE, 2019-2027
FIGURE 17.COMPARATIVE SHARE ANALYSIS OF ASIA-PACIFIC BIG DATA ANALYTICS SOFTWARE IN SEMICONDUCTOR & ELECTRONICS MARKET FOR ON-PREMISE DEPLOYMENT, BY COUNTRY, 2019 & 2027(%)
FIGURE 18.COMPARATIVE SHARE ANALYSIS OF ASIA-PACIFIC BIG DATA ANALYTICS SERVICE MARKET FOR CLOUD-BASED DEPLOYMENT, BY COUNTRY, 2019 & 2027(%)
FIGURE 19.ASIA-PACIFIC BIG DATA ANALYTICS IN SEMICONDUCTOR & ELECTRONICS MARKET REVENUE, BY END USER, 2019–2027 ($MILLION)
FIGURE 20.COMPARATIVE SHARE ANALYSIS OF ASIA-PACIFIC BIG DATA ANALYTICS IN SEMICONDUCTOR & ELECTRONICS MARKET FOR SEMICONDUCTOR, BY COUNTRY, 2019 & 2027(%)
FIGURE 21.COMPARATIVE SHARE ANALYSIS ASIA-PACIFIC BIG DATA ANALYTICS IN SEMICONDUCTOR & ELECTRONICS MARKET FOR ELECTRONICS, BY COUNTRY, 2019 & 2027(%)
FIGURE 22.ASIA PACIFIC BIG DATA ANALYTICS IN SEMICONDUCTOR & ELECTRONICS MARKET, BY ANALYTICS TOOL, 2019-2027
FIGURE 23.COMPARATIVE SHARE ANALYSIS OF ASIA-PACIFIC BIG DATA ANALYTICS IN SEMICONDUCTOR & ELECTRONICS MARKET FOR DASHBOARD & DATA VISUALIZATION, BY COUNTRY, 2019 & 2027 (%)
FIGURE 24.COMPARATIVE SHARE ANALYSIS OF ASIA-PACIFIC BIG DATA ANALYTICS IN SEMICONDUCTOR & ELECTRONICS MARKET FOR DATA MINING & WAREHOUSING, BY COUNTRY, 2019 & 2027 (%)
FIGURE 25.COMPARATIVE SHARE ANALYSIS OF ASIA-PACIFIC BIG DATA ANALYTICS IN SEMICONDUCTOR & ELECTRONICS MARKET FOR SELF-SERVICE TOOLS, BY COUNTRY, 2019 & 2027 (%)
FIGURE 26.COMPARATIVE SHARE ANALYSIS OF ASIA-PACIFIC BIG DATA ANALYTICS IN SEMICONDUCTOR & ELECTRONICS MARKET FOR DATA MINING & WAREHOUSING, BY COUNTRY, 2019 & 2027 (%)
FIGURE 27.COMPARATIVE SHARE ANALYSIS OF ASIA-PACIFIC BIG DATA ANALYTICS IN SEMICONDUCTOR & ELECTRONICS MARKET FOR OTHERS, BY COUNTRY, 2019 & 2027(%)
FIGURE 28.ASIA PACIFIC BIG DATA ANALYTICS IN SEMICONDUCTOR & ELECTRONICS MARKET, BY APPLICATION, 2019-2027
FIGURE 29.COMPARATIVE SHARE ANALYSIS OF ASIA-PACIFIC BIG DATA ANALYTICS IN SEMICONDUCTOR & ELECTRONICS MARKET FOR CUSTOMER ANALYTICS, BY COUNTRY, 2019 & 2027(%)
FIGURE 30.COMPARATIVE SHARE ANALYSIS OF ASIA-PACIFIC BIG DATA ANALYTICS IN SEMICONDUCTOR & ELECTRONICS MARKET FOR SUPLLY CHAIN ANALYTICS, BY COUNTRY, 2019 & 2027(%)
FIGURE 31.COMPARATIVE SHARE ANALYSIS OF ASIA-PACIFIC BIG DATA ANALYTICS IN SEMICONDUCTOR & ELECTRONICS MARKET FOR MARKETING ANALYTICS, BY COUNTRY, 2019 & 2027(%)
FIGURE 32.COMPARATIVE SHARE ANALYSIS OF ASIA-PACIFIC BIG DATA ANALYTICS IN SEMICONDUCTOR & ELECTRONICS MARKET FOR PRICING ANALYTICS, BY COUNTRY, 2019 & 2027(%)
FIGURE 33.COMPARATIVE SHARE ANALYSIS OF ASIA-PACIFIC BIG DATA ANALYTICS IN SEMICONDUCTOR & ELECTRONICS MARKET FOR WORKFORCE ANALYTICS, BY COUNTRY, 2019 & 2027(%)
FIGURE 34.COMPARATIVE SHARE ANALYSIS OF ASIA-PACIFIC BIG DATA ANALYTICS IN SEMICONDUCTOR & ELECTRONICS MARKET FOR OTHERS, BY COUNTRY, 2019 & 2027(%)
FIGURE 35.ASIA-PACIFIC BIG DATA ANALYTICS IN SEMICONDUCTOR & ELECTRONICS MARKET, BY USAGE, 2019-2027
FIGURE 36.COMPARATIVE SHARE ANALYSIS OF ASIA-PACIFIC BIG DATA ANALYTICS IN SEMICONDUCTOR & ELECTRONICS MARKET FOR SALES AND MARKETING, BY COUNTRY, 2019 & 2027(%)
FIGURE 37.COMPARATIVE SHARE ANALYSIS OF ASIA-PACIFIC BIG DATA ANALYTICS IN SEMICONDUCTOR & ELECTRONICS MARKET FOR FAULT DETECTION AND CLASSIFICATION, BY COUNTRY, 2019 & 2027(%)
FIGURE 38.COMPARATIVE SHARE ANALYSIS OF ASIA-PACIFIC BIG DATA ANALYTICS IN SEMICONDUCTOR & ELECTRONICS MARKET FOR PREDECTIVE MAINTENANCE, BY COUNTRY, 2019 & 2027(%)
FIGURE 39.COMPARATIVE SHARE ANALYSIS OF ASIA-PACIFIC BIG DATA ANALYTICS IN SEMICONDUCTOR & ELECTRONICS MARKET FOR VIRTUAL METROLOGY, BY COUNTRY, 2019 & 2027(%)
FIGURE 40.COMPARATIVE SHARE ANALYSIS OF ASIA-PACIFIC BIG DATA ANALYTICS IN SEMICONDUCTOR & ELECTRONICS MARKET FOR PROCESS OPTIMIZATION, BY COUNTRY, 2019 & 2027(%)
FIGURE 41.COMPARATIVE SHARE ANALYSIS OF ASIA-PACIFIC BIG DATA ANALYTICS IN SEMICONDUCTOR & ELECTRONICS MARKET FOR YIELD PREDICTION, BY COUNTRY, 2019 & 2027(%)
FIGURE 42.COMPARATIVE SHARE ANALYSIS OF ASIA-PACIFIC BIG DATA ANALYTICS IN SEMICONDUCTOR & ELECTRONICS MARKET FOR OTHERS, BY COUNTRY, 2019 & 2027(%)
FIGURE 43.CHINA BIG DATA ANALYTICS IN SEMICONDUCTOR & ELECTRONICS MARKET REVENUE, 2019-2027 ($MILLION)
FIGURE 44.INDIA BIG DATA ANALYTICS IN SEMICONDUCTOR & ELECTRONICS MARKET REVENUE, 2019-2027 ($MILLION)
FIGURE 45.JAPAN BIG DATA ANALYTICS IN SEMICONDUCTOR & ELECTRONICS MARKET REVENUE, 2019-2027 ($MILLION)
FIGURE 46.SOUTH KOREA BIG DATA ANALYTICS IN SEMICONDUCTOR & ELECTRONICS MARKET REVENUE, 2019-2027 ($MILLION)
FIGURE 47.TAIWAN BIG DATA ANALYTICS IN SEMICONDUCTOR & ELECTRONICS MARKET REVENUE, 2019-2027 ($MILLION)
FIGURE 48.SINGAPORE BIG DATA ANALYTICS IN SEMICONDUCTOR & ELECTRONICS MARKET REVENUE, 2019-2027 ($MILLION)
FIGURE 49.MALAYSIA BIG DATA ANALYTICS IN SEMICONDUCTOR & ELECTRONICS MARKET REVENUE, 2019-2027 ($MILLION)
FIGURE 50.PHILIPPINES BIG DATA ANALYTICS IN SEMICONDUCTOR & ELECTRONICS MARKET REVENUE, 2019-2027 ($MILLION)
FIGURE 51.THAILAND BIG DATA ANALYTICS IN SEMICONDUCTOR & ELECTRONICS MARKET REVENUE, 2019-2027 ($MILLION)
FIGURE 52.VIETNAM BIG DATA ANALYTICS IN SEMICONDUCTOR & ELECTRONICS MARKET REVENUE, 2019-2027 ($MILLION)
FIGURE 53.REST OF ASIA-PACIFIC BIG DATA ANALYTICS IN SEMICONDUCTOR & ELECTRONICS MARKET REVENUE, 2019-2027 ($MILLION)
FIGURE 54.KEY PLAYER POSITIONING
FIGURE 55.COMPETITIVE DASHBOARD
FIGURE 56.COMPETITIVE DASHBOARD
FIGURE 57.COMPETITIVE HEATMAP OF KEY PLAYERS
FIGURE 58.TOP WINNING STRATEGIES, BY YEAR, 2018–2020
FIGURE 59.TOP WINNING STRATEGIES, BY DEVELOPMENT, 2018-2020
FIGURE 60.TOP WINNING STRATEGIES, BY COMPANY, 2018-2020
FIGURE 61.AMAZON.COM, INC.: REVENUE, 2017–2019 ($MILLION)
FIGURE 62.AMAZON.COM, INC.: REVENUE SHARE BY SEGMENT, 2019 (%)
FIGURE 63.AMAZON.COM, INC.: REVENUE SHARE BY REGION, 2019 (%)
FIGURE 64.R&D EXPENDITURE, 2017–2019 ($MILLION)
FIGURE 68.R&D EXPENDITURE, 2018–2020 ($MILLION)
FIGURE 69.DELL TECHNOLOGY REVENUE, 2018–2020 ($MILLION)
FIGURE 70.DELL TECHNOLOGY: REVENUE SHARE BY SEGMENT, 2020 (%)
FIGURE 71.DELL TECHNOLOGY: REVENUE SHARE BY REGION, 2020 (%)
FIGURE 72.R&D EXPENDITURE, 2017–2019 ($MILLION)
FIGURE 73.INTERNATIONAL BUSINESS MACHINES CORPORATION: REVENUE, 2017–2019 ($MILLION)
FIGURE 74.INTERNATIONAL BUSINESS MACHINES CORPORATION: REVENUE SHARE BY SEGMENT, 2019 (%)
FIGURE 75.INTERNATIONAL BUSINESS MACHINES CORPORATION: REVENUE SHARE BY REGION, 2019 (%)
FIGURE 76.R&D EXPENDITURE, 2018–2020 ($MILLION)
FIGURE 77.KX SYSTEMS, INC.: REVENUE, 2018–2020 ($MILLION)
FIGURE 78.KX SYSTEMS, INC.: REVENUE SHARE BY SEGMENT, 2020 (%)
FIGURE 79.KX SYSTEMS, INC.: REVENUE SHARE BY GEOGRAPHY, 2020 (%)
FIGURE 80.R&D EXPENDITURE, 2017–2019 ($MILLION)
FIGURE 81.MICROSOFT CORPORATION: REVENUE, 2017–2019 ($MILLION)
FIGURE 82.MICROSOFT CORPORATION: REVENUE SHARE BY SEGMENT, 2019 (%)
FIGURE 83.MICROSOFT CORPORATION: REVENUE SHARE BY REGION, 2019 (%)
FIGURE 84.R&D EXPENDITURE, 2017–2019 ($MILLION)
FIGURE 85.SAP SE: REVENUE, 2017–2019 ($MILLION)
FIGURE 86.SAP SE: REVENUE SHARE BY SEGMENT, 2019 (%)
FIGURE 87.SAP SE: REVENUE SHARE BY REGION, 2019 (%)
FIGURE 88.SAS INSTITUTE INC.: REVENUE, 2016–2018 ($MILLION)
FIGURE 89.R&D EXPENDITURE, 2018–2020 ($MILLION)
FIGURE 90.SPLUNK INC.: REVENUE, 2018–2020 ($MILLION)
FIGURE 91.SPLUNK INC.: REVENUE SHARE BY REGION, 2020 (%
SELECT A FORMAT
Added to Cart
Electronic (PDF)

$3890

This license allows only one user to access the PDF.
Electronic (PDF)

$7516

This license allows users/teams in a same Enterprise to use this report, various departments within an enterpise can use this report
Add to Cart
Buy Now (15% Discount)

OUR CUSTOMER

Accenture

SIMILAR REPORTS


RELATED REPORTS

Global Open Source Database Solution Market Research Report 2024

120 Pages
Type: Report
Code: QYRE-Auto-9M13419
Wed May 08 00:00:00 UTC 2024

Add to Cart

Global Unified Data Management Solution Market Research Report 2024

120 Pages
Type: Report
Code: QYRE-Auto-10E5904
Mon Apr 29 00:00:00 UTC 2024

Add to Cart

Global Relational Database Management System Market Research Report 2024

120 Pages
Type: Report
Code: QYRE-Auto-30B5576
Mon Apr 29 00:00:00 UTC 2024

Add to Cart

Global Liquid Cooled Data Center Solutions Market Research Report 2024

120 Pages
Type: Report
Code: QYRE-Auto-18N10595
Wed Apr 17 00:00:00 UTC 2024

Add to Cart