0
U.S. (TOLL FREE)
+1 (315) 215-3225
Automative

0
U.S. (TOLL FREE)
+1 (315) 215-3225
Insomnia Market By Therapy Type (Non pharmacological Therapy, Pharmacological Therapy): Global Opportunity Analysis and Industry Forecast, 2020-2030
Published Date: April 2022
|
Report Code: ALLI-Auto-1D190
Home | Market Reports | Health| Health Conditions| Sleep Disorders
Insomnia Market by Therapy Type Non pharmacological Therapy Hypnotherapy Cognitive Behavioral Therapy Medical Devices and Other Non pharmacological Therapy and Pharmacological Therapy Prescription Sleep Aids and Over The Counter Sleep Aids Global Opportunity Analysis and Industry Forecast 2017 2023
BUY CHAPTERS

Insomnia Market By Therapy Type (Non pharmacological Therapy, Pharmacological Therapy): Global Opportunity Analysis and Industry Forecast, 2020-2030

Code: ALLI-Auto-1D190
Report
April 2022
Pages:150
Allied Market Research
Buy Now with 15% Discount
DESCRIPTION
TABLE OF CONTENT
TABLES & FIGURES

Insomnia Market Size

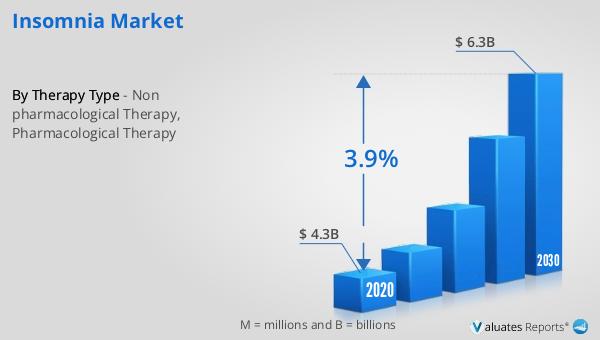
According to a new report published by , titled, “Insomnia Market," The insomnia market size was valued at $4.3 billion in 2020, and is estimated to reach $6.3 billion by 2030, growing at a CAGR of 3.9% from 2021 to 2030. 

Insomnia Market

Insomnia Market

Insomnia is a sleep disorder wherein people face problem to fall asleep or remain asleep. The major causes of insomnia, include high stress levels, mental disorders, excessive consumption of caffeine and alcohol, and other medical conditions. Insomnia is categorized into three types depending on the duration of the disorder, namely, transient (few days), acute (few weeks), and chronic insomnia (few months or even years).
The global insomnia market size is driven by rise in demand for over-the-counter (OTC) sleep aids and emergence of therapeutics with fewer side effects. The rise in incidence of chronic diseases is expected to boost the market growth during the insomnia market analysis period. Drugs used for the treatment of chronic diseases casue some side effects, which also affect the patient’s quality of sleep. Furthermore, rise in stress level among youngsters also affects the quality of sleep and increase in demand for drugs propel the insomnia market growth. Moreover, rise in geriatric population, increase in healthcare expenditure, and growth in disposable income are expected to fuel the insomnia industry, and drive the growth of the market. For instance, as per the Americas Health Rankings (AHR) report, around more than 54 million adults ages 65 and older lived in the U.S. in 2020. People aged 60 and older are more susceptible to insomnia. However, side effects caused due to excessive use of sleep medication in the market are expected to hinder the market growth.
The insomnia market share is segmented into therapy type and region. By therapy type, the market is categorized into non-pharmacological therapy and pharmacological therapy. The pharmacological therapy segment is the highest contributor to the market growth due to increase in prevalence of insomnia. The non-pharmacological therapy segment was the major contributor in 2020, and is expected to maintain its lead during the insomnia market forecast period, owing to fewer side effects as compared to pharmacological therapy.
North America was the leading revenue contributor to the insomnia market share in 2020, and is expected to remain dominant during the forecast period. This is attributed increase in development of insomnia industry, increase in work related stress, and high prevalence rate of insomnia. However, Asia-Pacific is expected to grow at the highest CAGR of 5.5% during the forecast period, due to increase in the number of people working at odd hours, increase in number of key players, and growth in disposable income in the region.
The COVID-19 outbreak is anticipated to have a positive impact on the growth of the insomnia market. The COVID-19 pandemic resulted in job losses for many workers as industries were not operating properly, which contributed in rise in stress in people. Furthermore, fear of the pandemic led to depression in some people gobally. Thus, increase in coronasomnia, a stress and depression associated with COVID-19 pandemic, surge the demand for insomnia drugs and drive the growth of the market. For instance, according to World Health Organization (WHO) report, as of 6 April 2022, there have been 492,189,439 confirmed cases of COVID-19 globally. In addition, according to a Sleep Foundation report published on March 2022, people and healthcare workers globally suffered with coronasomnia, which is insomnia associated with stress related to the COVID-19 pandemic.
Key Findings of Study
By therapy type, the pharmacological therapy segment was the highest contributor to the market in 2020.
Region-wise, North America garnered the largest revenue share in 2020, whereas Asia-Pacific is anticipated to grow at the highest CAGR during the forecast period.

Overview

The global insomnia market was valued at $ 4,318.9 million in 2020, and is projected to reach $ 6,315.9 million by 2030, registering a CAGR of 3.9% from 2021 to 2030. Insomnia is a sleep disorder wherein people find it difficult to sleep or remain asleep. The symptoms for insomnia include, low stamina, daytime sleepiness, depression, and irritability. It is a highly prevalent disorder that affects millions of people globally. Insomnia-related conditions are caused due to disruption in circadian rhythm, chronic pain, hyperthyroidism, menopause, psychological stress, and other medical conditions. This disorder can be diagnosed in sleep laboratories by using various diagnostic devices.
The global insomnia market is expected to register substantial growth in the near future, owing to rise in depression and sleep disorders in growing number of population. For instance, according to World Health Organization (WHO), approximately 280 million population across the globe were diagnosed with depression in 2020. People diagnosed with depression usually suffer from insomnia and excessive thinking.  Furthermore, rise in stress levels among youngsters have affected the quality of sleep and hence, led to an increase in growth of the insomnia market. However, side effects caused due to excessive use of sleep medication are expected to hamper the market growth during the forecast period. Conversely, increase in funding for R&D activities in the sleep disorders sector is expected to offer remunerative opportunities for market players.
The insomnia market is segmented into therapy type and region. By therapy type, the market is categorized into non-pharmacological therapy and pharmacological therapy. Depending on non-pharmacological therapy, it is further fragmented into hypnotherapy, cognitive behavioral therapy, medical devices, and other non-pharmacological therapy. On the basis of pharmacological therapy, it is segregated into prescription sleep aids and over-the-counter sleep aids.
Region-wise, it is analyzed across North America (the U.S., Canada, Mexico) Europe (Germany, France, UK, Italy, Spain, Rest of Europe) Asia-Pacific (Japan, China, Australia, India, South Korea, Taiwan and rest of Asia-Pacific) and LAMEA (Brazil, Saudi Arabia, South Africa, and Rest of LAMEA).
The key players operating in the global insomnia market include, Minerva Neurosciences Inc., Currax Pharmaceuticals LLC, Eisai, Co. Ltd., Merck & Co. Inc., Pfizer, Inc., Sanofi, Takeda Pharmaceutical Company Ltd., Vanda Pharmaceuticals, Viatris (Mylan NV), and Zydus Cadila.

Key Benefits For Stakeholders

This report provides a quantitative analysis of the market segments, current trends, estimations, and dynamics of the insomnia market analysis from 2020 to 2030 to identify the prevailing insomnia market opportunity.
The market research is offered along with information related to key drivers, restraints, and opportunities.
Porter's five forces analysis highlights the potency of buyers and suppliers to enable stakeholders make profit-oriented business decisions and strengthen their supplier-buyer network.
In-depth analysis of the insomnia market segmentation assists to determine the prevailing market opportunities.
Major countries in each region are mapped according to their revenue contribution to the global market.
The report includes the analysis of the regional as well as global insomnia market trends, key players, market segments, application areas, and market growth strategies.
Key Market Segments
zydus cadil

Scope of Insomnia Market Report

Report Metric Details
Report Name Insomnia Market
Accounted market size in 2020 $ 4.3 in billion
Forecasted market size in 2030 $ 6.3 billion
CAGR 3.9%
Base Year 2020
Forecasted years 2024 - 2030
By Therapy Type
  • Non pharmacological Therapy
  • Pharmacological Therapy
By Region
  • North America (United States, Canada)
  • Europe (Germany, France, UK, Italy, Russia) Rest of Europe
  • Nordic Countries
  • Asia-Pacific (China, Japan, South Korea)
  • Southeast Asia (India, Australia)
  • Rest of Asia
  • Latin America (Mexico, Brazil)
  • Rest of Latin America
  • Middle East & Africa (Turkey, Saudi Arabia, UAE, Rest of MEA)
Forecast units USD million in value
Report coverage Revenue and volume forecast, company share, competitive landscape, growth factors and trends

FAQ for this report

How fast is Insomnia Market growing?

Ans: The Insomnia Market witnessing a CAGR of 3.9% during the forecast period 2024-2030.

What is the Insomnia Market size in 2030?

Ans: The Insomnia Market size in 2030 will be $ 6.3 billion.

What are the Type segmentation covered in the Insomnia Market report?

Ans: The Types covered in the Insomnia Market report are Non pharmacological Therapy, Pharmacological Therapy

CHAPTER 1:INTRODUCTION
1.1.Report description
1.2.Key market segments
1.3.Key benefits to the stakeholders
1.4.Research Methodology
1.4.1.Secondary research
1.4.2.Primary research
1.4.3.Analyst tools and models
CHAPTER 2:EXECUTIVE SUMMARY
2.1.Key findings of the study
2.2.CXO Perspective
CHAPTER 3:MARKET OVERVIEW
3.1.Market definition and scope
3.2.Key findings
3.2.1.Top investment pockets
3.3.Porter’s five forces analysis
3.4.Top player positioning
3.5.Market dynamics
3.5.1.Drivers
3.5.2.Restraints
3.5.3.Opportunities
3.6.COVID-19 Impact Analysis on the market
CHAPTER 4: INSOMNIA MARKET, BY THERAPY TYPE
4.1 Overview
4.1.1 Market size and forecast
4.2 Non pharmacological Therapy
4.2.1 Key market trends, growth factors and opportunities
4.2.2 Market size and forecast, by region
4.2.3 Market analysis by country
4.3 Pharmacological Therapy
4.3.1 Key market trends, growth factors and opportunities
4.3.2 Market size and forecast, by region
4.3.3 Market analysis by country
CHAPTER 5: INSOMNIA MARKET, BY REGION
5.1 Overview
5.1.1 Market size and forecast
5.2 North America
5.2.1 Key trends and opportunities
5.2.2 North America Market size and forecast, by Therapy Type
5.2.3 North America Market size and forecast, by country
5.2.3.1 U.S.
5.2.3.1.1 Market size and forecast, by Therapy Type
5.2.3.2 Canada
5.2.3.2.1 Market size and forecast, by Therapy Type
5.2.3.3 Mexico
5.2.3.3.1 Market size and forecast, by Therapy Type
5.3 Europe
5.3.1 Key trends and opportunities
5.3.2 Europe Market size and forecast, by Therapy Type
5.3.3 Europe Market size and forecast, by country
5.3.3.1 Germany
5.3.3.1.1 Market size and forecast, by Therapy Type
5.3.3.2 France
5.3.3.2.1 Market size and forecast, by Therapy Type
5.3.3.3 United Kingdom
5.3.3.3.1 Market size and forecast, by Therapy Type
5.3.3.4 Italy
5.3.3.4.1 Market size and forecast, by Therapy Type
5.3.3.5 Spain
5.3.3.5.1 Market size and forecast, by Therapy Type
5.3.3.6 Rest of Europe
5.3.3.6.1 Market size and forecast, by Therapy Type
5.4 Asia-Pacific
5.4.1 Key trends and opportunities
5.4.2 Asia-Pacific Market size and forecast, by Therapy Type
5.4.3 Asia-Pacific Market size and forecast, by country
5.4.3.1 Japan
5.4.3.1.1 Market size and forecast, by Therapy Type
5.4.3.2 China
5.4.3.2.1 Market size and forecast, by Therapy Type
5.4.3.3 Australia
5.4.3.3.1 Market size and forecast, by Therapy Type
5.4.3.4 India
5.4.3.4.1 Market size and forecast, by Therapy Type
5.4.3.5 South Korea
5.4.3.5.1 Market size and forecast, by Therapy Type
5.4.3.6 Taiwan
5.4.3.6.1 Market size and forecast, by Therapy Type
5.4.3.7 Rest of Asia-Pacific
5.4.3.7.1 Market size and forecast, by Therapy Type
5.5 LAMEA
5.5.1 Key trends and opportunities
5.5.2 LAMEA Market size and forecast, by Therapy Type
5.5.3 LAMEA Market size and forecast, by country
5.5.3.1 Brazil
5.5.3.1.1 Market size and forecast, by Therapy Type
5.5.3.2 Turkey
5.5.3.2.1 Market size and forecast, by Therapy Type
5.5.3.3 Saudi Arabia
5.5.3.3.1 Market size and forecast, by Therapy Type
5.5.3.4 Republic Of South Africa
5.5.3.4.1 Market size and forecast, by Therapy Type
5.5.3.5 Rest of LAMEA
5.5.3.5.1 Market size and forecast, by Therapy Type
CHAPTER 6: COMPANY LANDSCAPE
6.1. Introduction
6.2. Top winning strategies
6.3. Product Mapping of Top 10 Player
6.4. Competitive Dashboard
6.5. Competitive Heatmap
6.6. Key developments
CHAPTER 7: COMPANY PROFILES
7.1 CURRAX PHARMACEUTICALS LLC
7.1.1 Company overview
7.1.2 Company snapshot
7.1.3 Operating business segments
7.1.4 Product portfolio
7.1.5 Business performance
7.1.6 Key strategic moves and developments
7.2 EISAI, CO. LTD
7.2.1 Company overview
7.2.2 Company snapshot
7.2.3 Operating business segments
7.2.4 Product portfolio
7.2.5 Business performance
7.2.6 Key strategic moves and developments
7.3 merck kgaa, darmstadt, germany
7.3.1 Company overview
7.3.2 Company snapshot
7.3.3 Operating business segments
7.3.4 Product portfolio
7.3.5 Business performance
7.3.6 Key strategic moves and developments
7.4 MINERVA NEUROSCIENCES INC
7.4.1 Company overview
7.4.2 Company snapshot
7.4.3 Operating business segments
7.4.4 Product portfolio
7.4.5 Business performance
7.4.6 Key strategic moves and developments
7.5 Pfizer Inc.
7.5.1 Company overview
7.5.2 Company snapshot
7.5.3 Operating business segments
7.5.4 Product portfolio
7.5.5 Business performance
7.5.6 Key strategic moves and developments
7.6 Sanofi
7.6.1 Company overview
7.6.2 Company snapshot
7.6.3 Operating business segments
7.6.4 Product portfolio
7.6.5 Business performance
7.6.6 Key strategic moves and developments
7.7 Takeda Pharmaceutical Company Ltd
7.7.1 Company overview
7.7.2 Company snapshot
7.7.3 Operating business segments
7.7.4 Product portfolio
7.7.5 Business performance
7.7.6 Key strategic moves and developments
7.8 Vanda Pharmaceuticals Inc.
7.8.1 Company overview
7.8.2 Company snapshot
7.8.3 Operating business segments
7.8.4 Product portfolio
7.8.5 Business performance
7.8.6 Key strategic moves and developments
7.9 VIATRIS INC
7.9.1 Company overview
7.9.2 Company snapshot
7.9.3 Operating business segments
7.9.4 Product portfolio
7.9.5 Business performance
7.9.6 Key strategic moves and developments
7.10 zydus cadila
7.10.1 Company overview
7.10.2 Company snapshot
7.10.3 Operating business segments
7.10.4 Product portfolio
7.10.5 Business performance
7.10.6 Key strategic moves and development
LIST OF TABLES
TABLE 1. GLOBAL INSOMNIA MARKET, BY THERAPY TYPE, 2020-2030,($MILLION)
TABLE 2. INSOMNIA MARKET REVENUE, FOR NON PHARMACOLOGICAL THERAPY, BY REGION , 2020-2030,($MILLION)
TABLE 3. INSOMNIA MARKET NON PHARMACOLOGICAL THERAPY BY COUNTRY, 2020-2030,($MILLION)
TABLE 4. INSOMNIA MARKET REVENUE, FOR PHARMACOLOGICAL THERAPY, BY REGION , 2020-2030,($MILLION)
TABLE 5. INSOMNIA MARKET PHARMACOLOGICAL THERAPY BY COUNTRY, 2020-2030,($MILLION)
TABLE 6. INSOMNIA MARKET, BY REGION, 2020-2030,($MILLION)
TABLE 7. NORTH AMERICA INSOMNIA MARKET, BY THERAPY TYPE, 2020-2030,($MILLION)
TABLE 8. NORTH AMERICA INSOMNIA MARKET, BY COUNTRY, 2020-2030,($MILLION)
TABLE 9. U.S. INSOMNIA MARKET BY THERAPY TYPE 2020-2030,($MILLION)
TABLE 10. CANADA INSOMNIA MARKET BY THERAPY TYPE 2020-2030,($MILLION)
TABLE 11. MEXICO INSOMNIA MARKET BY THERAPY TYPE 2020-2030,($MILLION)
TABLE 12. EUROPE INSOMNIA MARKET, BY THERAPY TYPE, 2020-2030,($MILLION)
TABLE 13. EUROPE INSOMNIA MARKET, BY COUNTRY, 2020-2030,($MILLION)
TABLE 14. GERMANY INSOMNIA MARKET BY THERAPY TYPE 2020-2030,($MILLION)
TABLE 15. FRANCE INSOMNIA MARKET BY THERAPY TYPE 2020-2030,($MILLION)
TABLE 16. UNITED KINGDOM INSOMNIA MARKET BY THERAPY TYPE 2020-2030,($MILLION)
TABLE 17. ITALY INSOMNIA MARKET BY THERAPY TYPE 2020-2030,($MILLION)
TABLE 18. SPAIN INSOMNIA MARKET BY THERAPY TYPE 2020-2030,($MILLION)
TABLE 19. REST OF EUROPE INSOMNIA MARKET BY THERAPY TYPE 2020-2030,($MILLION)
TABLE 20. ASIA-PACIFIC INSOMNIA MARKET, BY THERAPY TYPE, 2020-2030,($MILLION)
TABLE 21. ASIA-PACIFIC INSOMNIA MARKET, BY COUNTRY, 2020-2030,($MILLION)
TABLE 22. JAPAN INSOMNIA MARKET BY THERAPY TYPE 2020-2030,($MILLION)
TABLE 23. CHINA INSOMNIA MARKET BY THERAPY TYPE 2020-2030,($MILLION)
TABLE 24. AUSTRALIA INSOMNIA MARKET BY THERAPY TYPE 2020-2030,($MILLION)
TABLE 25. INDIA INSOMNIA MARKET BY THERAPY TYPE 2020-2030,($MILLION)
TABLE 26. SOUTH KOREA INSOMNIA MARKET BY THERAPY TYPE 2020-2030,($MILLION)
TABLE 27. TAIWAN INSOMNIA MARKET BY THERAPY TYPE 2020-2030,($MILLION)
TABLE 28. REST OF ASIA-PACIFIC INSOMNIA MARKET BY THERAPY TYPE 2020-2030,($MILLION)
TABLE 29. LAMEA INSOMNIA MARKET, BY THERAPY TYPE, 2020-2030,($MILLION)
TABLE 30. LAMEA INSOMNIA MARKET, BY COUNTRY, 2020-2030,($MILLION)
TABLE 31. BRAZIL INSOMNIA MARKET BY THERAPY TYPE 2020-2030,($MILLION)
TABLE 32. TURKEY INSOMNIA MARKET BY THERAPY TYPE 2020-2030,($MILLION)
TABLE 33. SAUDI ARABIA INSOMNIA MARKET BY THERAPY TYPE 2020-2030,($MILLION)
TABLE 34. REPUBLIC OF SOUTH AFRICA INSOMNIA MARKET BY THERAPY TYPE 2020-2030,($MILLION)
TABLE 35. REST OF LAMEA INSOMNIA MARKET BY THERAPY TYPE 2020-2030,($MILLION)
TABLE 36.CURRAX PHARMACEUTICALS LLC: COMPANY SNAPSHOT
TABLE 37.CURRAX PHARMACEUTICALS LLC: OPERATING SEGMENTS
TABLE 38.CURRAX PHARMACEUTICALS LLC: PRODUCT PORTFOLIO
TABLE 39.CURRAX PHARMACEUTICALS LLC: NET SALES,
TABLE 40.CURRAX PHARMACEUTICALS LLC: KEY STRATERGIES
TABLE 41.EISAI, CO. LTD: COMPANY SNAPSHOT
TABLE 42.EISAI, CO. LTD: OPERATING SEGMENTS
TABLE 43.EISAI, CO. LTD: PRODUCT PORTFOLIO
TABLE 44.EISAI, CO. LTD: NET SALES,
TABLE 45.EISAI, CO. LTD: KEY STRATERGIES
TABLE 46.MERCK KGAA, DARMSTADT, GERMANY: COMPANY SNAPSHOT
TABLE 47.MERCK KGAA, DARMSTADT, GERMANY: OPERATING SEGMENTS
TABLE 48.MERCK KGAA, DARMSTADT, GERMANY: PRODUCT PORTFOLIO
TABLE 49.MERCK KGAA, DARMSTADT, GERMANY: NET SALES,
TABLE 50.MERCK KGAA, DARMSTADT, GERMANY: KEY STRATERGIES
TABLE 51.MINERVA NEUROSCIENCES INC: COMPANY SNAPSHOT
TABLE 52.MINERVA NEUROSCIENCES INC: OPERATING SEGMENTS
TABLE 53.MINERVA NEUROSCIENCES INC: PRODUCT PORTFOLIO
TABLE 54.MINERVA NEUROSCIENCES INC: NET SALES,
TABLE 55.MINERVA NEUROSCIENCES INC: KEY STRATERGIES
TABLE 56.PFIZER INC.: COMPANY SNAPSHOT
TABLE 57.PFIZER INC.: OPERATING SEGMENTS
TABLE 58.PFIZER INC.: PRODUCT PORTFOLIO
TABLE 59.PFIZER INC.: NET SALES,
TABLE 60.PFIZER INC.: KEY STRATERGIES
TABLE 61.SANOFI: COMPANY SNAPSHOT
TABLE 62.SANOFI: OPERATING SEGMENTS
TABLE 63.SANOFI: PRODUCT PORTFOLIO
TABLE 64.SANOFI: NET SALES,
TABLE 65.SANOFI: KEY STRATERGIES
TABLE 66.TAKEDA PHARMACEUTICAL COMPANY LTD: COMPANY SNAPSHOT
TABLE 67.TAKEDA PHARMACEUTICAL COMPANY LTD: OPERATING SEGMENTS
TABLE 68.TAKEDA PHARMACEUTICAL COMPANY LTD: PRODUCT PORTFOLIO
TABLE 69.TAKEDA PHARMACEUTICAL COMPANY LTD: NET SALES,
TABLE 70.TAKEDA PHARMACEUTICAL COMPANY LTD: KEY STRATERGIES
TABLE 71.VANDA PHARMACEUTICALS INC.: COMPANY SNAPSHOT
TABLE 72.VANDA PHARMACEUTICALS INC.: OPERATING SEGMENTS
TABLE 73.VANDA PHARMACEUTICALS INC.: PRODUCT PORTFOLIO
TABLE 74.VANDA PHARMACEUTICALS INC.: NET SALES,
TABLE 75.VANDA PHARMACEUTICALS INC.: KEY STRATERGIES
TABLE 76.VIATRIS INC: COMPANY SNAPSHOT
TABLE 77.VIATRIS INC: OPERATING SEGMENTS
TABLE 78.VIATRIS INC: PRODUCT PORTFOLIO
TABLE 79.VIATRIS INC: NET SALES,
TABLE 80.VIATRIS INC: KEY STRATERGIES
TABLE 81.ZYDUS CADILA: COMPANY SNAPSHOT
TABLE 82.ZYDUS CADILA: OPERATING SEGMENTS
TABLE 83.ZYDUS CADILA: PRODUCT PORTFOLIO
TABLE 84.ZYDUS CADILA: NET SALES,
TABLE 85.ZYDUS CADILA: KEY STRATERGIES LIST OF FIGURES
FIGURE 1.INSOMNIA MARKET SEGMENTATION
FIGURE 2.INSOMNIA MARKET,2020-2030
FIGURE 3.INSOMNIA MARKET,2020-2030
FIGURE 4. TOP INVESTMENT POCKETS, BY REGION
FIGURE 5.PORTER FIVE-1
FIGURE 6.PORTER FIVE-2
FIGURE 7.PORTER FIVE-3
FIGURE 8.PORTER FIVE-4
FIGURE 9.PORTER FIVE-5
FIGURE 10.TOP PLAYER POSITIONING
FIGURE 11.INSOMNIA MARKET:DRIVERS, RESTRAINTS AND OPPORTUNITIES
FIGURE 12.INSOMNIA MARKET,BY THERAPY TYPE,2020(%)
FIGURE 13.COMPARATIVE SHARE ANALYSIS OF NON PHARMACOLOGICAL THERAPY INSOMNIA MARKET,2020-2030(%)
FIGURE 14.COMPARATIVE SHARE ANALYSIS OF PHARMACOLOGICAL THERAPY INSOMNIA MARKET,2020-2030(%)
FIGURE 15.INSOMNIA MARKET BY REGION,2020
FIGURE 16.U.S. INSOMNIA MARKET,2020-2030($MILLION)
FIGURE 17.CANADA INSOMNIA MARKET,2020-2030($MILLION)
FIGURE 18.MEXICO INSOMNIA MARKET,2020-2030($MILLION)
FIGURE 19.GERMANY INSOMNIA MARKET,2020-2030($MILLION)
FIGURE 20.FRANCE INSOMNIA MARKET,2020-2030($MILLION)
FIGURE 21.UNITED KINGDOM INSOMNIA MARKET,2020-2030($MILLION)
FIGURE 22.ITALY INSOMNIA MARKET,2020-2030($MILLION)
FIGURE 23.SPAIN INSOMNIA MARKET,2020-2030($MILLION)
FIGURE 24.REST OF EUROPE INSOMNIA MARKET,2020-2030($MILLION)
FIGURE 25.JAPAN INSOMNIA MARKET,2020-2030($MILLION)
FIGURE 26.CHINA INSOMNIA MARKET,2020-2030($MILLION)
FIGURE 27.AUSTRALIA INSOMNIA MARKET,2020-2030($MILLION)
FIGURE 28.INDIA INSOMNIA MARKET,2020-2030($MILLION)
FIGURE 29.SOUTH KOREA INSOMNIA MARKET,2020-2030($MILLION)
FIGURE 30.TAIWAN INSOMNIA MARKET,2020-2030($MILLION)
FIGURE 31.REST OF ASIA-PACIFIC INSOMNIA MARKET,2020-2030($MILLION)
FIGURE 32.BRAZIL INSOMNIA MARKET,2020-2030($MILLION)
FIGURE 33.TURKEY INSOMNIA MARKET,2020-2030($MILLION)
FIGURE 34.SAUDI ARABIA INSOMNIA MARKET,2020-2030($MILLION)
FIGURE 35.REPUBLIC OF SOUTH AFRICA INSOMNIA MARKET,2020-2030($MILLION)
FIGURE 36.REST OF LAMEA INSOMNIA MARKET,2020-2030($MILLION)
FIGURE 37. TOP WINNING STRATEGIES, BY YEAR
FIGURE 38. TOP WINNING STRATEGIES, BY DEVELOPMENT
FIGURE 39. TOP WINNING STRATEGIES, BY COMPANY
FIGURE 40.PRODUCT MAPPING OF TOP 10 PLAYERS
FIGURE 41.COMPETITIVE DASHBOARD
FIGURE 42.COMPETITIVE HEATMAP OF TOP 10 KEY PLAYERS
FIGURE 43.CURRAX PHARMACEUTICALS LLC.: NET SALES ,($MILLION)
FIGURE 44.EISAI, CO. LTD.: NET SALES ,($MILLION)
FIGURE 45.MERCK KGAA, DARMSTADT, GERMANY.: NET SALES ,($MILLION)
FIGURE 46.MINERVA NEUROSCIENCES INC.: NET SALES ,($MILLION)
FIGURE 47.PFIZER INC..: NET SALES ,($MILLION)
FIGURE 48.SANOFI.: NET SALES ,($MILLION)
FIGURE 49.TAKEDA PHARMACEUTICAL COMPANY LTD.: NET SALES ,($MILLION)
FIGURE 50.VANDA PHARMACEUTICALS INC..: NET SALES ,($MILLION)
FIGURE 51.VIATRIS INC.: NET SALES ,($MILLION)
FIGURE 52.ZYDUS CADILA.: NET SALES ,($MILLION
SELECT A FORMAT
Added to Cart
Electronic (PDF)

$5769

This license allows only one user to access the PDF.
Electronic (PDF)

$6450

This license allows 1 - 5 user to access the PDF, license is suitable for small groups of 5 users working together
Electronic (PDF)

$9995

This license allows users/teams in a same Enterprise to use this report, various departments within an enterpise can use this report
Electronic (PDF)

$3840

This license just provides quantitative data in a excel sheet
Add to Cart
Buy Now (15% Discount)

OUR CUSTOMER

SIS Group of Schools

SIMILAR REPORTS


RELATED REPORTS

Global Sleep Apnea Solutions Market Research Report 2024

120 Pages
Type: Report
Code: QYRE-Auto-36M10417
Sun Apr 07 00:00:00 UTC 2024

Add to Cart

Short Sleep Syndrome Treatment - Global Market Share and Ranking, Overall Sales and Demand Forecast 2024-2030

120 Pages
Type: Report
Code: QYRE-Auto-15Y14330
Sun Apr 07 00:00:00 UTC 2024

Add to Cart

Global Sleep Apnea Masks Market Research Report 2024

120 Pages
Type: Report
Code: QYRE-Auto-33A7862
Wed Apr 03 00:00:00 UTC 2024

Add to Cart

Add to Cart