0
U.S. (TOLL FREE)
+1 (315) 215-3225
Automative

0
U.S. (TOLL FREE)
+1 (315) 215-3225
Intraoral Scanners Market By Brand (Cadent iTero, 3M ESPE Lava COS, CEREC, E4D, TRIOS, CS, Others), By End User (Hospitals, Dental Clinics, Others): Global Opportunity Analysis and Industry Forecast, 2020-2030
Published Date: April 2022
|
Report Code: ALLI-Auto-1E205
Home | Market Reports | Health| Oral & Dental Care
Intraoral Scanners Market by Brand Cadent iTero 3M ESPE Lava COS CEREC E4D TRIOS and CS and End User Hospitals and Dental Clinics Global Opportunity Analysis and Industry Forecast 2017 2023
BUY CHAPTERS

Intraoral Scanners Market By Brand (Cadent iTero, 3M ESPE Lava COS, CEREC, E4D, TRIOS, CS, Others), By End User (Hospitals, Dental Clinics, Others): Global Opportunity Analysis and Industry Forecast, 2020-2030

Code: ALLI-Auto-1E205
Report
April 2022
Pages:185
Allied Market Research
Buy Now with 15% Discount
DESCRIPTION
TABLE OF CONTENT
TABLES & FIGURES

Intraoral Scanners Market Size

According to a new report published by , titled, “Intraoral Scanners Market," The intraoral scanners market size was valued at $382.52 million in 2020, and is estimated to reach $875.60 million by 2030, growing at a CAGR of 18.6% from 2021 to 2030. 

Intraoral Scanners Market

Intraoral Scanners Market

Orthodontists use intraoral scanners to take 3D images of the teeth and soft tissue of the intraoral areas. When compared to traditional approaches, intraoral scanner images are of higher quality, resulting in high-quality treatment results.
The intraoral scanners market trends like increase in geriatric population and rise in the number of patients suffering from the dental disorders are expected to drive the market growth. Moreover, benefits of the intraoral scanning method, such as reduced duration of the treatment, boost the market growth. However, high cost of the device and a dearth of skilled professionals are expected to impede the market growth.
Coronavirus (COVID-19) was discovered in late December in Hubei province of Wuhan city in China. The disease is caused by a virus, namely, severe acute respiratory syndrome coronavirus 2 (SARS-CoV-2), which is transmitted among humans. Amidst the initial outbreak of COVID-19, number of patients to undergo dental implant surgery declined, there could be a general fear of visiting dentists among the public after the COVID-19 outbreak settles down. Some patients encourage the use of digital intraoral scanners instead of conventional impressions and increase the demand for computer aided design and manufacturing (CAD/CAM) and 3D-printing technology. Moreover, the demand for the diagnostic devices and for intraoral scanner are expected to increase during the forecast period. The cost of providing dental treatment is expected to increase in the future because of increase in demand for more productive and cost-effective digital dentistry equipment, which in turn are expected to boost the intraoral scanners industry aspect of dentistry and flourishing engineering potentials by further investment from main stakeholders and investors. Thus, the outbreak of COVID-19 has positive impact on the intraoral scanners market growth.
On the basis of brand, the CEREC system segment is expected to dominate the global market during the forecast period, owing to increase in demand for technically advanced intraoral scanning devices. Cadent iTero segment is expected to exhibit the fastest growth rate during the forecast period owing to increase in geriatric population and rise in the number of patients suffering from the dental disorders.
By end-user, the global intraoral scanners market is segmented into hospitals, dental clinics, and others. In 2020, the hospitals segment held the largest share  of the global intraoral scanners market, mainly driven by the large number of patient visits to the hospitals for treatments than in clinics. Dental clinics segment is expected to exhibit the fastest growth rate during the forecast period owing to increase in the number of dental clinics that increase the demand for intraoral scanners.
Region-wise, the Europe intraoral scanners market share generated the highest revenue of $171.4 million in 2020 and it is expected to generate $372.1 million in 2030 growing with a CAGR of 8.5% during the forecast period. Asia-Pacific is expected to exhibit the fastest growth rate during the forecast period due to surge in demand for Intraoral Scanners products, availability of advanced healthcare facilities with trained medical professionals.
KEY FINDINGS OF STUDY
By brand, the CEREC segment is expected to grow at the highest CAGR of 7.7% during the forecast period.
By end user, the hospital segment accounted for nearly half of the share of the global intraoral scanners market in 2020.
Region-wise, Europe is expected to experience growth at the highest rate, registering a CAGR of 8.5% during the forecast period.

Overview

The global intraoral scanners market was valued at $382.5 million in 2020, and is estimated to reach $875.6 million by 2030, growing at a CAGR of 9.1% from 2021 to 2030. Intraoral scanners are used by orthodontists to capture 3D images of the dentition and soft tissue of intraoral areas. The images obtained from intraoral scanners are of superior quality as compared to conventional methods, leading to high-quality treatment results.
The global intraoral scanners market is driven by increase in geriatric population and rise in the number of patients suffering from dental disorders. Moreover, benefits of intraoral scanners, such as ease of handling, lightweight, and high precision of images, further boost the market growth. However, high cost of the devices and dearth of skilled professionals restrain the market growth. The growth of the intraoral scanners market is estimated to be catalysed by opportunities such as development of scanners, which are portable and easily fit in hands, allowing dentists to freely move in all angulations inside the mouth without causing discomfort to the patients.
The intraoral scanners market is segmented based on brand, end user, and region. On the basis of brand, it is divided into Cadent iTero, 3M ESPE Lava COS, CEREC, E4D, TRIOS, CS, and others. On the basis of end user, it is classified into hospitals, dental clinics, and others. Region-wise, it is analysed across North America, Europe, Asia-Pacific, and LAMEA.
The key market players operating in this market include, 3Shape A/S, Align Technology, Inc., Condor Technologies NV, Densys3D Ltd., Dental Wings Inc., Dentsply Sirona Inc., Envista Holdings Corporation, Guangdong Launca Medical Device Technology Co. Ltd., Midmark Corporation and Planmeca OY.


KEY BENEFITS FOR STAKEHOLDERS

This report provides a detailed quantitative analysis of the current market trends and future estimations from 2020 to 2030, which assists to identify the prevailing market opportunities.
An in-depth analysis of various regions is anticipated to provide a detailed understanding of the current trends to enable stakeholders to formulate region-specific plans.
A comprehensive analysis of the factors that drive and restrain the growth of the intraoral scanners market is provided.
An extensive analysis of various regions provides insights that allow companies to strategically plan their business moves.
Key market players and their strategies have been analyzed to understand the competitive outlook of the market.
Key Market Segments
planmeca o

Scope of Intraoral Scanners Market Report

Report Metric Details
Report Name Intraoral Scanners Market
Accounted market size in 2020 $ 382.52 million
Forecasted market size in 2030 $ 875.60 million
CAGR 18.6%
Base Year 2020
Forecasted years 2024 - 2030
By Brand
  • CEREC
  • E4D
  • TRIOS
  • CS
  • Others
  • Cadent iTero
  • 3M ESPE Lava COS
By End User
  • Hospitals
  • Dental Clinics
  • Others
By Region
  • North America (United States, Canada)
  • Europe (Germany, France, UK, Italy, Russia) Rest of Europe
  • Nordic Countries
  • Asia-Pacific (China, Japan, South Korea)
  • Southeast Asia (India, Australia)
  • Rest of Asia
  • Latin America (Mexico, Brazil)
  • Rest of Latin America
  • Middle East & Africa (Turkey, Saudi Arabia, UAE, Rest of MEA)
Forecast units USD million in value
Report coverage Revenue and volume forecast, company share, competitive landscape, growth factors and trends

FAQ for this report

How fast is Intraoral Scanners Market growing?

Ans: The Intraoral Scanners Market witnessing a CAGR of 18.6% during the forecast period 2024-2030.

What is the Intraoral Scanners Market size in 2030?

Ans: The Intraoral Scanners Market size in 2030 will be $ 875.60 million.

What are the End User segmentation covered in the Intraoral Scanners Market report?

Ans: The End users covered in the Intraoral Scanners Market report are Hospitals, Dental Clinics, Others

CHAPTER 1:INTRODUCTION
1.1.Report description
1.2.Key market segments
1.3.Key benefits to the stakeholders
1.4.Research Methodology
1.4.1.Secondary research
1.4.2.Primary research
1.4.3.Analyst tools and models
CHAPTER 2:EXECUTIVE SUMMARY
2.1.Key findings of the study
2.2.CXO Perspective
CHAPTER 3:MARKET OVERVIEW
3.1.Market definition and scope
3.2.Key findings
3.2.1.Top investment pockets
3.3.Porter’s five forces analysis
3.4.Top player positioning
3.5.Market dynamics
3.5.1.Drivers
3.5.2.Restraints
3.5.3.Opportunities
3.6.COVID-19 Impact Analysis on the market
CHAPTER 4: INTRAORAL SCANNERS MARKET, BY BRAND
4.1 Overview
4.1.1 Market size and forecast
4.2 Cadent iTero
4.2.1 Key market trends, growth factors and opportunities
4.2.2 Market size and forecast, by region
4.2.3 Market analysis by country
4.3 3M ESPE Lava COS
4.3.1 Key market trends, growth factors and opportunities
4.3.2 Market size and forecast, by region
4.3.3 Market analysis by country
4.4 CEREC
4.4.1 Key market trends, growth factors and opportunities
4.4.2 Market size and forecast, by region
4.4.3 Market analysis by country
4.5 E4D
4.5.1 Key market trends, growth factors and opportunities
4.5.2 Market size and forecast, by region
4.5.3 Market analysis by country
4.6 TRIOS
4.6.1 Key market trends, growth factors and opportunities
4.6.2 Market size and forecast, by region
4.6.3 Market analysis by country
4.7 CS
4.7.1 Key market trends, growth factors and opportunities
4.7.2 Market size and forecast, by region
4.7.3 Market analysis by country
4.8 Others
4.8.1 Key market trends, growth factors and opportunities
4.8.2 Market size and forecast, by region
4.8.3 Market analysis by country
CHAPTER 5: INTRAORAL SCANNERS MARKET, BY END USER
5.1 Overview
5.1.1 Market size and forecast
5.2 Hospitals
5.2.1 Key market trends, growth factors and opportunities
5.2.2 Market size and forecast, by region
5.2.3 Market analysis by country
5.3 Dental Clinics
5.3.1 Key market trends, growth factors and opportunities
5.3.2 Market size and forecast, by region
5.3.3 Market analysis by country
5.4 Others
5.4.1 Key market trends, growth factors and opportunities
5.4.2 Market size and forecast, by region
5.4.3 Market analysis by country
CHAPTER 6: INTRAORAL SCANNERS MARKET, BY REGION
6.1 Overview
6.1.1 Market size and forecast
6.2 North America
6.2.1 Key trends and opportunities
6.2.2 North America Market size and forecast, by Brand
6.2.3 North America Market size and forecast, by End User
6.2.4 North America Market size and forecast, by country
6.2.4.1 U.S.
6.2.4.1.1 Market size and forecast, by Brand
6.2.4.1.2 Market size and forecast, by End User
6.2.4.2 Canada
6.2.4.2.1 Market size and forecast, by Brand
6.2.4.2.2 Market size and forecast, by End User
6.2.4.3 Mexico
6.2.4.3.1 Market size and forecast, by Brand
6.2.4.3.2 Market size and forecast, by End User
6.3 Europe
6.3.1 Key trends and opportunities
6.3.2 Europe Market size and forecast, by Brand
6.3.3 Europe Market size and forecast, by End User
6.3.4 Europe Market size and forecast, by country
6.3.4.1 Germany
6.3.4.1.1 Market size and forecast, by Brand
6.3.4.1.2 Market size and forecast, by End User
6.3.4.2 France
6.3.4.2.1 Market size and forecast, by Brand
6.3.4.2.2 Market size and forecast, by End User
6.3.4.3 U.K.
6.3.4.3.1 Market size and forecast, by Brand
6.3.4.3.2 Market size and forecast, by End User
6.3.4.4 Italy
6.3.4.4.1 Market size and forecast, by Brand
6.3.4.4.2 Market size and forecast, by End User
6.3.4.5 Spain
6.3.4.5.1 Market size and forecast, by Brand
6.3.4.5.2 Market size and forecast, by End User
6.3.4.6 Rest of Europe
6.3.4.6.1 Market size and forecast, by Brand
6.3.4.6.2 Market size and forecast, by End User
6.4 Asia-Pacific
6.4.1 Key trends and opportunities
6.4.2 Asia-Pacific Market size and forecast, by Brand
6.4.3 Asia-Pacific Market size and forecast, by End User
6.4.4 Asia-Pacific Market size and forecast, by country
6.4.4.1 Japan
6.4.4.1.1 Market size and forecast, by Brand
6.4.4.1.2 Market size and forecast, by End User
6.4.4.2 China
6.4.4.2.1 Market size and forecast, by Brand
6.4.4.2.2 Market size and forecast, by End User
6.4.4.3 Australia
6.4.4.3.1 Market size and forecast, by Brand
6.4.4.3.2 Market size and forecast, by End User
6.4.4.4 India
6.4.4.4.1 Market size and forecast, by Brand
6.4.4.4.2 Market size and forecast, by End User
6.4.4.5 South Korea
6.4.4.5.1 Market size and forecast, by Brand
6.4.4.5.2 Market size and forecast, by End User
6.4.4.6 Rest of Asia-Pacific
6.4.4.6.1 Market size and forecast, by Brand
6.4.4.6.2 Market size and forecast, by End User
6.5 LAMEA
6.5.1 Key trends and opportunities
6.5.2 LAMEA Market size and forecast, by Brand
6.5.3 LAMEA Market size and forecast, by End User
6.5.4 LAMEA Market size and forecast, by country
6.5.4.1 Brazil
6.5.4.1.1 Market size and forecast, by Brand
6.5.4.1.2 Market size and forecast, by End User
6.5.4.2 South Africa
6.5.4.2.1 Market size and forecast, by Brand
6.5.4.2.2 Market size and forecast, by End User
6.5.4.3 Saudi Arabia
6.5.4.3.1 Market size and forecast, by Brand
6.5.4.3.2 Market size and forecast, by End User
6.5.4.4 Rest of LAMEA
6.5.4.4.1 Market size and forecast, by Brand
6.5.4.4.2 Market size and forecast, by End User
CHAPTER 7: COMPANY LANDSCAPE
7.1. Introduction
7.2. Top winning strategies
7.3. Product Mapping of Top 10 Player
7.4. Competitive Dashboard
7.5. Competitive Heatmap
7.6. Key developments
CHAPTER 8: COMPANY PROFILES
8.1 3Shape
8.1.1 Company overview
8.1.2 Company snapshot
8.1.3 Operating business segments
8.1.4 Product portfolio
8.1.5 Business performance
8.1.6 Key strategic moves and developments
8.2 Align Technology Inc.
8.2.1 Company overview
8.2.2 Company snapshot
8.2.3 Operating business segments
8.2.4 Product portfolio
8.2.5 Business performance
8.2.6 Key strategic moves and developments
8.3 Condor Technologies NV
8.3.1 Company overview
8.3.2 Company snapshot
8.3.3 Operating business segments
8.3.4 Product portfolio
8.3.5 Business performance
8.3.6 Key strategic moves and developments
8.4 Densys3D Ltd.
8.4.1 Company overview
8.4.2 Company snapshot
8.4.3 Operating business segments
8.4.4 Product portfolio
8.4.5 Business performance
8.4.6 Key strategic moves and developments
8.5 Dental Wings Inc.
8.5.1 Company overview
8.5.2 Company snapshot
8.5.3 Operating business segments
8.5.4 Product portfolio
8.5.5 Business performance
8.5.6 Key strategic moves and developments
8.6 Dentsply Sirona Inc.
8.6.1 Company overview
8.6.2 Company snapshot
8.6.3 Operating business segments
8.6.4 Product portfolio
8.6.5 Business performance
8.6.6 Key strategic moves and developments
8.7 Envista Holdings Corporation
8.7.1 Company overview
8.7.2 Company snapshot
8.7.3 Operating business segments
8.7.4 Product portfolio
8.7.5 Business performance
8.7.6 Key strategic moves and developments
8.8 Guangdong Launca Medical Device Technology Co. Ltd.
8.8.1 Company overview
8.8.2 Company snapshot
8.8.3 Operating business segments
8.8.4 Product portfolio
8.8.5 Business performance
8.8.6 Key strategic moves and developments
8.9 midmark corporation
8.9.1 Company overview
8.9.2 Company snapshot
8.9.3 Operating business segments
8.9.4 Product portfolio
8.9.5 Business performance
8.9.6 Key strategic moves and developments
8.10 planmeca oy
8.10.1 Company overview
8.10.2 Company snapshot
8.10.3 Operating business segments
8.10.4 Product portfolio
8.10.5 Business performance
8.10.6 Key strategic moves and development
LIST OF TABLES
TABLE 1. GLOBAL INTRAORAL SCANNERS MARKET, BY BRAND, 2020-2030,($MILLION)
TABLE 2. INTRAORAL SCANNERS MARKET REVENUE, FOR CADENT ITERO, BY REGION , 2020-2030,($MILLION)
TABLE 3. INTRAORAL SCANNERS MARKET CADENT ITERO BY COUNTRY, 2020-2030,($MILLION)
TABLE 4. INTRAORAL SCANNERS MARKET REVENUE, FOR 3M ESPE LAVA COS, BY REGION , 2020-2030,($MILLION)
TABLE 5. INTRAORAL SCANNERS MARKET 3M ESPE LAVA COS BY COUNTRY, 2020-2030,($MILLION)
TABLE 6. INTRAORAL SCANNERS MARKET REVENUE, FOR CEREC, BY REGION , 2020-2030,($MILLION)
TABLE 7. INTRAORAL SCANNERS MARKET CEREC BY COUNTRY, 2020-2030,($MILLION)
TABLE 8. INTRAORAL SCANNERS MARKET REVENUE, FOR E4D, BY REGION , 2020-2030,($MILLION)
TABLE 9. INTRAORAL SCANNERS MARKET E4D BY COUNTRY, 2020-2030,($MILLION)
TABLE 10. INTRAORAL SCANNERS MARKET REVENUE, FOR TRIOS, BY REGION , 2020-2030,($MILLION)
TABLE 11. INTRAORAL SCANNERS MARKET TRIOS BY COUNTRY, 2020-2030,($MILLION)
TABLE 12. INTRAORAL SCANNERS MARKET REVENUE, FOR CS, BY REGION , 2020-2030,($MILLION)
TABLE 13. INTRAORAL SCANNERS MARKET CS BY COUNTRY, 2020-2030,($MILLION)
TABLE 14. INTRAORAL SCANNERS MARKET REVENUE, FOR OTHERS, BY REGION , 2020-2030,($MILLION)
TABLE 15. INTRAORAL SCANNERS MARKET OTHERS BY COUNTRY, 2020-2030,($MILLION)
TABLE 16. GLOBAL INTRAORAL SCANNERS MARKET, BY END USER, 2020-2030,($MILLION)
TABLE 17. INTRAORAL SCANNERS MARKET REVENUE, FOR HOSPITALS, BY REGION , 2020-2030,($MILLION)
TABLE 18. INTRAORAL SCANNERS MARKET HOSPITALS BY COUNTRY, 2020-2030,($MILLION)
TABLE 19. INTRAORAL SCANNERS MARKET REVENUE, FOR DENTAL CLINICS, BY REGION , 2020-2030,($MILLION)
TABLE 20. INTRAORAL SCANNERS MARKET DENTAL CLINICS BY COUNTRY, 2020-2030,($MILLION)
TABLE 21. INTRAORAL SCANNERS MARKET REVENUE, FOR OTHERS, BY REGION , 2020-2030,($MILLION)
TABLE 22. INTRAORAL SCANNERS MARKET OTHERS BY COUNTRY, 2020-2030,($MILLION)
TABLE 23. INTRAORAL SCANNERS MARKET, BY REGION, 2020-2030,($MILLION)
TABLE 24. NORTH AMERICA INTRAORAL SCANNERS MARKET, BY BRAND, 2020-2030,($MILLION)
TABLE 25. NORTH AMERICA INTRAORAL SCANNERS MARKET, BY END USER, 2020-2030,($MILLION)
TABLE 26. NORTH AMERICA INTRAORAL SCANNERS MARKET, BY COUNTRY, 2020-2030,($MILLION)
TABLE 27. U.S. INTRAORAL SCANNERS MARKET BY BRAND 2020-2030,($MILLION)
TABLE 28. U.S. INTRAORAL SCANNERS MARKET BY END USER 2020-2030,($MILLION)
TABLE 29. CANADA INTRAORAL SCANNERS MARKET BY BRAND 2020-2030,($MILLION)
TABLE 30. CANADA INTRAORAL SCANNERS MARKET BY END USER 2020-2030,($MILLION)
TABLE 31. MEXICO INTRAORAL SCANNERS MARKET BY BRAND 2020-2030,($MILLION)
TABLE 32. MEXICO INTRAORAL SCANNERS MARKET BY END USER 2020-2030,($MILLION)
TABLE 33. EUROPE INTRAORAL SCANNERS MARKET, BY BRAND, 2020-2030,($MILLION)
TABLE 34. EUROPE INTRAORAL SCANNERS MARKET, BY END USER, 2020-2030,($MILLION)
TABLE 35. EUROPE INTRAORAL SCANNERS MARKET, BY COUNTRY, 2020-2030,($MILLION)
TABLE 36. GERMANY INTRAORAL SCANNERS MARKET BY BRAND 2020-2030,($MILLION)
TABLE 37. GERMANY INTRAORAL SCANNERS MARKET BY END USER 2020-2030,($MILLION)
TABLE 38. FRANCE INTRAORAL SCANNERS MARKET BY BRAND 2020-2030,($MILLION)
TABLE 39. FRANCE INTRAORAL SCANNERS MARKET BY END USER 2020-2030,($MILLION)
TABLE 40. U.K. INTRAORAL SCANNERS MARKET BY BRAND 2020-2030,($MILLION)
TABLE 41. U.K. INTRAORAL SCANNERS MARKET BY END USER 2020-2030,($MILLION)
TABLE 42. ITALY INTRAORAL SCANNERS MARKET BY BRAND 2020-2030,($MILLION)
TABLE 43. ITALY INTRAORAL SCANNERS MARKET BY END USER 2020-2030,($MILLION)
TABLE 44. SPAIN INTRAORAL SCANNERS MARKET BY BRAND 2020-2030,($MILLION)
TABLE 45. SPAIN INTRAORAL SCANNERS MARKET BY END USER 2020-2030,($MILLION)
TABLE 46. REST OF EUROPE INTRAORAL SCANNERS MARKET BY BRAND 2020-2030,($MILLION)
TABLE 47. REST OF EUROPE INTRAORAL SCANNERS MARKET BY END USER 2020-2030,($MILLION)
TABLE 48. ASIA-PACIFIC INTRAORAL SCANNERS MARKET, BY BRAND, 2020-2030,($MILLION)
TABLE 49. ASIA-PACIFIC INTRAORAL SCANNERS MARKET, BY END USER, 2020-2030,($MILLION)
TABLE 50. ASIA-PACIFIC INTRAORAL SCANNERS MARKET, BY COUNTRY, 2020-2030,($MILLION)
TABLE 51. JAPAN INTRAORAL SCANNERS MARKET BY BRAND 2020-2030,($MILLION)
TABLE 52. JAPAN INTRAORAL SCANNERS MARKET BY END USER 2020-2030,($MILLION)
TABLE 53. CHINA INTRAORAL SCANNERS MARKET BY BRAND 2020-2030,($MILLION)
TABLE 54. CHINA INTRAORAL SCANNERS MARKET BY END USER 2020-2030,($MILLION)
TABLE 55. AUSTRALIA INTRAORAL SCANNERS MARKET BY BRAND 2020-2030,($MILLION)
TABLE 56. AUSTRALIA INTRAORAL SCANNERS MARKET BY END USER 2020-2030,($MILLION)
TABLE 57. INDIA INTRAORAL SCANNERS MARKET BY BRAND 2020-2030,($MILLION)
TABLE 58. INDIA INTRAORAL SCANNERS MARKET BY END USER 2020-2030,($MILLION)
TABLE 59. SOUTH KOREA INTRAORAL SCANNERS MARKET BY BRAND 2020-2030,($MILLION)
TABLE 60. SOUTH KOREA INTRAORAL SCANNERS MARKET BY END USER 2020-2030,($MILLION)
TABLE 61. REST OF ASIA-PACIFIC INTRAORAL SCANNERS MARKET BY BRAND 2020-2030,($MILLION)
TABLE 62. REST OF ASIA-PACIFIC INTRAORAL SCANNERS MARKET BY END USER 2020-2030,($MILLION)
TABLE 63. LAMEA INTRAORAL SCANNERS MARKET, BY BRAND, 2020-2030,($MILLION)
TABLE 64. LAMEA INTRAORAL SCANNERS MARKET, BY END USER, 2020-2030,($MILLION)
TABLE 65. LAMEA INTRAORAL SCANNERS MARKET, BY COUNTRY, 2020-2030,($MILLION)
TABLE 66. BRAZIL INTRAORAL SCANNERS MARKET BY BRAND 2020-2030,($MILLION)
TABLE 67. BRAZIL INTRAORAL SCANNERS MARKET BY END USER 2020-2030,($MILLION)
TABLE 68. SOUTH AFRICA INTRAORAL SCANNERS MARKET BY BRAND 2020-2030,($MILLION)
TABLE 69. SOUTH AFRICA INTRAORAL SCANNERS MARKET BY END USER 2020-2030,($MILLION)
TABLE 70. SAUDI ARABIA INTRAORAL SCANNERS MARKET BY BRAND 2020-2030,($MILLION)
TABLE 71. SAUDI ARABIA INTRAORAL SCANNERS MARKET BY END USER 2020-2030,($MILLION)
TABLE 72. REST OF LAMEA INTRAORAL SCANNERS MARKET BY BRAND 2020-2030,($MILLION)
TABLE 73. REST OF LAMEA INTRAORAL SCANNERS MARKET BY END USER 2020-2030,($MILLION)
TABLE 74.3SHAPE: COMPANY SNAPSHOT
TABLE 75.3SHAPE: OPERATING SEGMENTS
TABLE 76.3SHAPE: PRODUCT PORTFOLIO
TABLE 77.3SHAPE: NET SALES,
TABLE 78.3SHAPE: KEY STRATERGIES
TABLE 79.ALIGN TECHNOLOGY INC.: COMPANY SNAPSHOT
TABLE 80.ALIGN TECHNOLOGY INC.: OPERATING SEGMENTS
TABLE 81.ALIGN TECHNOLOGY INC.: PRODUCT PORTFOLIO
TABLE 82.ALIGN TECHNOLOGY INC.: NET SALES,
TABLE 83.ALIGN TECHNOLOGY INC.: KEY STRATERGIES
TABLE 84.CONDOR TECHNOLOGIES NV: COMPANY SNAPSHOT
TABLE 85.CONDOR TECHNOLOGIES NV: OPERATING SEGMENTS
TABLE 86.CONDOR TECHNOLOGIES NV: PRODUCT PORTFOLIO
TABLE 87.CONDOR TECHNOLOGIES NV: NET SALES,
TABLE 88.CONDOR TECHNOLOGIES NV: KEY STRATERGIES
TABLE 89.DENSYS3D LTD.: COMPANY SNAPSHOT
TABLE 90.DENSYS3D LTD.: OPERATING SEGMENTS
TABLE 91.DENSYS3D LTD.: PRODUCT PORTFOLIO
TABLE 92.DENSYS3D LTD.: NET SALES,
TABLE 93.DENSYS3D LTD.: KEY STRATERGIES
TABLE 94.DENTAL WINGS INC.: COMPANY SNAPSHOT
TABLE 95.DENTAL WINGS INC.: OPERATING SEGMENTS
TABLE 96.DENTAL WINGS INC.: PRODUCT PORTFOLIO
TABLE 97.DENTAL WINGS INC.: NET SALES,
TABLE 98.DENTAL WINGS INC.: KEY STRATERGIES
TABLE 99.DENTSPLY SIRONA INC.: COMPANY SNAPSHOT
TABLE 100.DENTSPLY SIRONA INC.: OPERATING SEGMENTS
TABLE 101.DENTSPLY SIRONA INC.: PRODUCT PORTFOLIO
TABLE 102.DENTSPLY SIRONA INC.: NET SALES,
TABLE 103.DENTSPLY SIRONA INC.: KEY STRATERGIES
TABLE 104.ENVISTA HOLDINGS CORPORATION: COMPANY SNAPSHOT
TABLE 105.ENVISTA HOLDINGS CORPORATION: OPERATING SEGMENTS
TABLE 106.ENVISTA HOLDINGS CORPORATION: PRODUCT PORTFOLIO
TABLE 107.ENVISTA HOLDINGS CORPORATION: NET SALES,
TABLE 108.ENVISTA HOLDINGS CORPORATION: KEY STRATERGIES
TABLE 109.GUANGDONG LAUNCA MEDICAL DEVICE TECHNOLOGY CO. LTD.: COMPANY SNAPSHOT
TABLE 110.GUANGDONG LAUNCA MEDICAL DEVICE TECHNOLOGY CO. LTD.: OPERATING SEGMENTS
TABLE 111.GUANGDONG LAUNCA MEDICAL DEVICE TECHNOLOGY CO. LTD.: PRODUCT PORTFOLIO
TABLE 112.GUANGDONG LAUNCA MEDICAL DEVICE TECHNOLOGY CO. LTD.: NET SALES,
TABLE 113.GUANGDONG LAUNCA MEDICAL DEVICE TECHNOLOGY CO. LTD.: KEY STRATERGIES
TABLE 114.MIDMARK CORPORATION: COMPANY SNAPSHOT
TABLE 115.MIDMARK CORPORATION: OPERATING SEGMENTS
TABLE 116.MIDMARK CORPORATION: PRODUCT PORTFOLIO
TABLE 117.MIDMARK CORPORATION: NET SALES,
TABLE 118.MIDMARK CORPORATION: KEY STRATERGIES
TABLE 119.PLANMECA OY: COMPANY SNAPSHOT
TABLE 120.PLANMECA OY: OPERATING SEGMENTS
TABLE 121.PLANMECA OY: PRODUCT PORTFOLIO
TABLE 122.PLANMECA OY: NET SALES,
TABLE 123.PLANMECA OY: KEY STRATERGIES LIST OF FIGURES
FIGURE 1.INTRAORAL SCANNERS MARKET SEGMENTATION
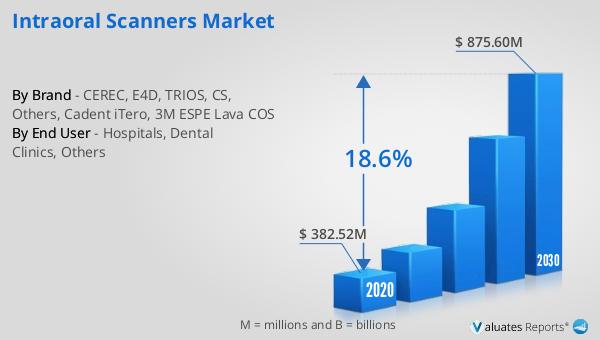
FIGURE 2.INTRAORAL SCANNERS MARKET,2020-2030
FIGURE 3.INTRAORAL SCANNERS MARKET,2020-2030
FIGURE 4. TOP INVESTMENT POCKETS, BY REGION
FIGURE 5.PORTER FIVE-1
FIGURE 6.PORTER FIVE-2
FIGURE 7.PORTER FIVE-3
FIGURE 8.PORTER FIVE-4
FIGURE 9.PORTER FIVE-5
FIGURE 10.TOP PLAYER POSITIONING
FIGURE 11.INTRAORAL SCANNERS MARKET:DRIVERS, RESTRAINTS AND OPPORTUNITIES
FIGURE 12.INTRAORAL SCANNERS MARKET,BY BRAND,2020(%)
FIGURE 13.COMPARATIVE SHARE ANALYSIS OF CADENT ITERO INTRAORAL SCANNERS MARKET,2020-2030(%)
FIGURE 14.COMPARATIVE SHARE ANALYSIS OF 3M ESPE LAVA COS INTRAORAL SCANNERS MARKET,2020-2030(%)
FIGURE 15.COMPARATIVE SHARE ANALYSIS OF CEREC INTRAORAL SCANNERS MARKET,2020-2030(%)
FIGURE 16.COMPARATIVE SHARE ANALYSIS OF E4D INTRAORAL SCANNERS MARKET,2020-2030(%)
FIGURE 17.COMPARATIVE SHARE ANALYSIS OF TRIOS INTRAORAL SCANNERS MARKET,2020-2030(%)
FIGURE 18.COMPARATIVE SHARE ANALYSIS OF CS INTRAORAL SCANNERS MARKET,2020-2030(%)
FIGURE 19.COMPARATIVE SHARE ANALYSIS OF OTHERS INTRAORAL SCANNERS MARKET,2020-2030(%)
FIGURE 20.INTRAORAL SCANNERS MARKET,BY END USER,2020(%)
FIGURE 21.COMPARATIVE SHARE ANALYSIS OF HOSPITALS INTRAORAL SCANNERS MARKET,2020-2030(%)
FIGURE 22.COMPARATIVE SHARE ANALYSIS OF DENTAL CLINICS INTRAORAL SCANNERS MARKET,2020-2030(%)
FIGURE 23.COMPARATIVE SHARE ANALYSIS OF OTHERS INTRAORAL SCANNERS MARKET,2020-2030(%)
FIGURE 24.INTRAORAL SCANNERS MARKET BY REGION,2020
FIGURE 25.U.S. INTRAORAL SCANNERS MARKET,2020-2030($MILLION)
FIGURE 26.CANADA INTRAORAL SCANNERS MARKET,2020-2030($MILLION)
FIGURE 27.MEXICO INTRAORAL SCANNERS MARKET,2020-2030($MILLION)
FIGURE 28.GERMANY INTRAORAL SCANNERS MARKET,2020-2030($MILLION)
FIGURE 29.FRANCE INTRAORAL SCANNERS MARKET,2020-2030($MILLION)
FIGURE 30.U.K. INTRAORAL SCANNERS MARKET,2020-2030($MILLION)
FIGURE 31.ITALY INTRAORAL SCANNERS MARKET,2020-2030($MILLION)
FIGURE 32.SPAIN INTRAORAL SCANNERS MARKET,2020-2030($MILLION)
FIGURE 33.REST OF EUROPE INTRAORAL SCANNERS MARKET,2020-2030($MILLION)
FIGURE 34.JAPAN INTRAORAL SCANNERS MARKET,2020-2030($MILLION)
FIGURE 35.CHINA INTRAORAL SCANNERS MARKET,2020-2030($MILLION)
FIGURE 36.AUSTRALIA INTRAORAL SCANNERS MARKET,2020-2030($MILLION)
FIGURE 37.INDIA INTRAORAL SCANNERS MARKET,2020-2030($MILLION)
FIGURE 38.SOUTH KOREA INTRAORAL SCANNERS MARKET,2020-2030($MILLION)
FIGURE 39.REST OF ASIA-PACIFIC INTRAORAL SCANNERS MARKET,2020-2030($MILLION)
FIGURE 40.BRAZIL INTRAORAL SCANNERS MARKET,2020-2030($MILLION)
FIGURE 41.SOUTH AFRICA INTRAORAL SCANNERS MARKET,2020-2030($MILLION)
FIGURE 42.SAUDI ARABIA INTRAORAL SCANNERS MARKET,2020-2030($MILLION)
FIGURE 43.REST OF LAMEA INTRAORAL SCANNERS MARKET,2020-2030($MILLION)
FIGURE 44. TOP WINNING STRATEGIES, BY YEAR
FIGURE 45. TOP WINNING STRATEGIES, BY DEVELOPMENT
FIGURE 46. TOP WINNING STRATEGIES, BY COMPANY
FIGURE 47.PRODUCT MAPPING OF TOP 10 PLAYERS
FIGURE 48.COMPETITIVE DASHBOARD
FIGURE 49.COMPETITIVE HEATMAP OF TOP 10 KEY PLAYERS
FIGURE 50.3SHAPE.: NET SALES ,($MILLION)
FIGURE 51.ALIGN TECHNOLOGY INC..: NET SALES ,($MILLION)
FIGURE 52.CONDOR TECHNOLOGIES NV.: NET SALES ,($MILLION)
FIGURE 53.DENSYS3D LTD..: NET SALES ,($MILLION)
FIGURE 54.DENTAL WINGS INC..: NET SALES ,($MILLION)
FIGURE 55.DENTSPLY SIRONA INC..: NET SALES ,($MILLION)
FIGURE 56.ENVISTA HOLDINGS CORPORATION.: NET SALES ,($MILLION)
FIGURE 57.GUANGDONG LAUNCA MEDICAL DEVICE TECHNOLOGY CO. LTD..: NET SALES ,($MILLION)
FIGURE 58.MIDMARK CORPORATION.: NET SALES ,($MILLION)
FIGURE 59.PLANMECA OY.: NET SALES ,($MILLION
SELECT A FORMAT
Added to Cart
Electronic (PDF)

$5939

This license allows only one user to access the PDF.
Electronic (PDF)

$6654

This license allows 1 - 5 user to access the PDF, license is suitable for small groups of 5 users working together
Electronic (PDF)

$10280

This license allows users/teams in a same Enterprise to use this report, various departments within an enterpise can use this report
Electronic (PDF)

$3961

This license just provides quantitative data in a excel sheet
Add to Cart
Buy Now (15% Discount)

OUR CUSTOMER

Seventh Sense AI

SIMILAR REPORTS


RELATED REPORTS

Global Dental Scanning Equipment Market Research Report 2024

120 Pages
Type: Report
Code: QYRE-Auto-16L8431
Wed Apr 17 00:00:00 UTC 2024

Add to Cart

Global Dental Surgical Intervention Services Market Research Report 2024

120 Pages
Type: Report
Code: QYRE-Auto-11G6312
Mon Apr 15 00:00:00 UTC 2024

Add to Cart

Global Direct And Indirect Restorative Materials Market Research Report 2024

120 Pages
Type: Report
Code: QYRE-Auto-3A9633
Mon Apr 15 00:00:00 UTC 2024

Add to Cart

Global Dental Biomaterial Market Research Report 2024

120 Pages
Type: Report
Code: QYRE-Auto-15S6240
Mon Apr 15 00:00:00 UTC 2024

Add to Cart