0
U.S. (TOLL FREE)
+1 (315) 215-3225
Automative

0
U.S. (TOLL FREE)
+1 (315) 215-3225
Enteral Nutrition Market by Protein Composition (Standard Protein Diet, High Protein Supplement, Protein for Diabetes Care Patient and Others), Form (Powder and Liquid), Age Group (Adults, and Pediatric), and Distribution Channel (Hospital Sales, Retail, and Online): Global Opportunity Analysis and Industry Forecast, 2020–2027
Published Date: November 2019
|
Report Code: ALLI-Auto-1E297
Home | Market Reports | Health| Nutrition| Vitamins & Supplements
 Enteral Nutrition Market by Protein Composition Standard Protein Diet High Protein Supplement Protein for Diabetes Care Patient and Others Distribution Channel Hospital Sale Retail and Online and Form Age Group Powder and Liquid Global Opportunity Analysis and Industry Forecast 2018 2025
BUY CHAPTERS

Enteral Nutrition Market by Protein Composition (Standard Protein Diet, High Protein Supplement, Protein for Diabetes Care Patient and Others), Form (Powder and Liquid), Age Group (Adults, and Pediatric), and Distribution Channel (Hospital Sales, Retail, and Online): Global Opportunity Analysis and Industry Forecast, 2020–2027

Code: ALLI-Auto-1E297
Report
November 2019
Pages:389
Allied Market Research
Buy Now with 15% Discount
DESCRIPTION
TABLE OF CONTENT
TABLES & FIGURES

Enternal Nutrition Market Statistics - 2027

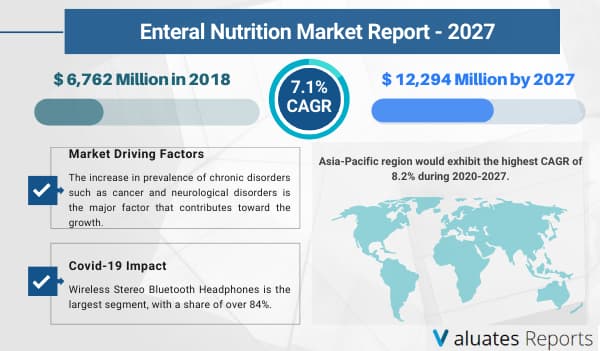
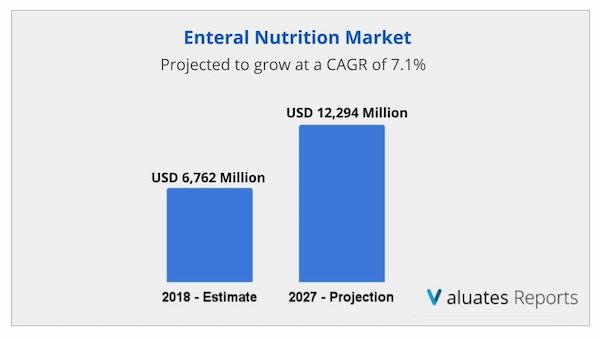
The global enteral nutrition market was valued at $6,762 million in 2018 and is projected to reach $12,294 million by 2027, registering a CAGR of 7.1% from 2020 to 2027. Increase in incidence of chronic disorders such as cancer and neurological disorders is the key factor driving the growth of the global enteral nutrition market.
 
enteral nutrition market

What is Enteral Nutrition?

Enteral nutrition refers to the process of feeding through the gastrointestinal (GI) tract to fulfill the caloric requirements of patients who suffer from chronic illness such as malnutrition, gastrointestinal disorder, cancer, and others. It is prescribed to patients who are unable to consume the requisite nutrients orally due to swallowing difficulties or surgery but have a functional gastrointestinal tract. Enteral nutrients are administered directly into the stomach, duodenum, or jejunum of a patient via enteral pumps and enteral feeding tubes. . Generally, enteral feeding is administered to critically ill patients in an operation theatre (OT), intensive care unit (ICU), and critical care unit (CCU), or at home.


Enteral Nutrition Market Key Trends

Increase in geriatric population and surge in malnutrition cases have supplemented the market growth. Over the years, enteral nutrition has been gaining tremendous response owing to advancement in techniques, configurations, and ingredients. In addition, low cost and complications associated with enteral nutrition boost the market growth. However, stringent governmental regulations and inadvertent dislodgment of tubes that lead to accidental disabilities and deaths hamper the market growth. Conversely, development of new technologically advanced products and high market potential in untapped emerging economies are expected to provide lucrative opportunities for the growth of the market.
 
enteral nutrition market size
The global enteral nutrition market is segmented based on protein composition, distribution channel, form & age group, and region. Based on protein composition, the market is divided into standard protein diet, high protein supplement, protein for diabetes care patient, and others. Based on distribution channel, the market is segmented into hospital sale, retail, and online. Based on form, the market is categorized into powder and liquid. Based on the age group, the market is bifurcated into adult (age >18 years) and pediatrics (age
 
The key players operating in the value chain of this report include Abbott Laboratories, Nestlé S.A., Danone SA, Fresenius Kabi AG, Mead Johnson Nutrition Company, B. Braun Melsungen AG, Global Health Products, Inc., Meiji Holdings Co., Ltd., Victus, Inc., and Hormel Foods Corporation.

Enteral Nutrition Market Segmentation

Enteral Nutrition Market by Protein Composition

  • Standard Protein diet
  • High Protein Supplement
  • Protein for Diabetes Care Patient
  • Others 

Enteral Nutrition Market by Distribution Channel

  • Hospital Sale
  • Retail
  • Online 

Enteral Nutrition Market by Form and Age Group

    Powder

  • Age >18
  • Age <18

    Liquid

  • Age >18
  • Age <18 

Enteral Nutrition Market by Region

    North America

  • US.
  • Canada
  • Mexico

    Europe

  • Germany
  • UK
  • France
  • Rest of Europe

    Asia-Pacific

  • China
  • India
  • Japan
  • South Korea
  • Malaysia
  • Philippines
  • Myanmar
  • Vietnam
  • Rest of Asia-Pacific

    CIS

  • Russia
  • Kazakhstan
  • Uzbekistan
  • Ukraine
  • Rest of CIS

    LAMEA

  • Brazil
  • Argentina
  • Columbia
  • Kenya
  • Tanzania
  • Nigeria
  • Ethiopia
  • Saudi Arabia
  • UAE
  • Jordan
  • Rest of LAME


Scope of the Enteral Nutrition Market Report

Report Metric

Details

Report Name

Enteral Nutrition Market

Market size value in 2018

USD 6,762 Million

Revenue forecast in 2027

USD 12,294 Million

CAGR Growth

7.1%

Base year considered

2018

Historical Data for

2020 -2027

Segment by Protein Composition

Standard Protein Diet, High Protein Supplement, Protein for Diabetes Care Patient

Segment by Distribution Channel

Hospital Sale, Retail, and Online

Form & Age Group

Powder and Liquid


Frequently Asked Questions About This Report

1. How big is the Enteral nutrition market?

Ans: The global enteral nutrition market was valued at $6,762 million in 2018 and is projected to reach $12,294 million by 2027, registering a CAGR of 7.1% from 2020 to 2027.

2. What are the key factors driving the growth of Enteral nutrition market?

Ans: Increase in incidence of chronic disorders such as cancer and neurological disorders is the key factor driving the growth of the global enteral nutrition market.

3. Who are the key players in the Enteral nutrition market?

Ans. Some key players operating in the eternal nutrition market are Abbott Laboratories, Nestlé S.A., Danone SA, Fresenius Kabi AG, Mead Johnson Nutrition Company, B. Braun Melsungen AG, Global Health Products, Inc., Meiji Holdings Co., Ltd., Victus, Inc.

CHAPTER 1: INTRODUCTION
1.1. Report description
1.2. Key benefits for stakeholders
1.3. key market segments
1.3.1. List of key players profiled in the report
1.4. Research methodology
1.4.1. Secondary research
1.4.2. Primary research
1.4.3. Analyst tools and models
CHAPTER 2: EXECUTIVE SUMMARY
2.1. Key findings of the study
2.1.1. CXO perspective
CHAPTER 3: MARKET OVERVIEW
3.1. Market definition and scope
3.2. Key findings
3.2.1. Top investment pockets
3.2.2. Top winning strategies
3.3. Porter's five forces analysis
3.3.1. Bargaining power of suppliers
3.3.2. Bargaining power of buyer
3.3.3. Thereat of new entrants
3.3.4. Threat of substitute
3.3.5. Intensity of competitive rivalry
3.4. Top player positioning, 2017
3.5. Market dynamics
3.5.1. Drivers
3.5.1.1. Increase in demand from end-user industries
3.5.1.2. Promising growth of the surfactant industry
3.5.2. Restraint
3.5.2.1. Volatility in Raw Material prices
3.5.3. Opportunity
3.5.3.1. Growing demand for Gas Sweetening agents
3.6. End user and competitor analysis
CHAPTER 4: NORTH AMERICA ETHANOLAMINE MARKET, BY PRODUCT
4.1. Overview
4.1.1. Market size and forecast
4.2. Monoethanolamine (mea)
4.2.1. Key market trends, growth factors, and opportunities
4.2.2. Market size and forecast
4.3. Diethanolamine (dea)
4.3.1. Key market trends, growth factors, and opportunities
4.3.2. Market size and forecast
4.4. Triethanolamine (tea)
4.4.1. Key market trends, growth factors, and opportunities
4.4.2. Market size and forecast
CHAPTER 5: NORTH AMERICA ETHANOLAMINE MARKET, BY APPLICATION
5.1. Overview
5.1.1. Market size and forecast
5.2. Cleaning
5.2.1. Key market trends, growth factors, and opportunities
5.2.2. Market size and forecast
5.3. Gas treatment
5.3.1. Key market trends, growth factors, and opportunities
5.3.2. Market size and forecast
5.4. Water treatment
5.4.1. Key market trends, growth factors, and opportunities
5.4.2. Market size and forecast
5.5. Cosmetics
5.5.1. Key market trends, growth factors, and opportunities
5.5.2. Market size and forecast
5.6. Lubricants
5.6.1. Key market trends, growth factors, and opportunities
5.6.2. Market size and forecast
5.7. Others
5.7.1. Key market trends, growth factors, and opportunities
5.7.2. Market size and forecast
CHAPTER 6: NORTH AMERICA ETHANOLAMINE MARKET, BY END-USER INDUSTRY
6.1. Overview
6.1.1. Market size and forecast
6.2. Polyurethanes
6.2.1. Key market trends, growth factors, and opportunities
6.2.2. Market size and forecast
6.3. Personal care
6.3.1. Key market trends, growth factors, and opportunities
6.3.2. Market size and forecast
6.4. Chemical
6.4.1. Key market trends, growth factors, and opportunities
6.4.2. Market size and forecast
6.5. Agrochemical
6.5.1. Key market trends, growth factors, and opportunities
6.5.2. Market size and forecast
6.6. Rubber, oil, & petrochemical
6.6.1. Key market trends, growth factors, and opportunities
6.6.2. Market size and forecast
6.7. Others
6.7.1. Key market trends, growth factors, and opportunities
6.7.2. Market size and forecast
CHAPTER 7: NORTH AMERICA ETHANOLAMINE MARKET, BY COUNTRY
7.1. Overview
7.1.1. Market size and forecast
7.2. North america
7.2.1. Key market trends
7.2.2. Key growth factors, and opportunities
7.2.3. Market size and forecast
7.2.3.1. U.S. Market size and forecast
7.2.3.2. Canada Market size and forecast
7.2.3.3. Mexico Market size and forecast
7.2.4. North America ethanolamine market, by product
7.2.4.1. Market size and forecast
7.2.5. North America ethanolamine market, by application
7.2.5.1. Market size and forecast
7.2.6. North America market size and forecast, by end-user industry
CHAPTER 8: COMPONY PROFILES
8.1. BASF SE
8.1.1. Company overview
8.1.2. Company snapshot
8.1.3. Operating business segments
8.1.4. Product portfolio
8.1.5. Business performance
8.1.6. Key strategic moves and developments
8.2. HUNTSMAN CORPORATION
8.2.1. Company overview
8.2.2. Company snapshot
8.2.3. Operating business segments
8.2.4. Product portfolio
8.2.5. Business performance
8.2.6. Key strategic moves and developments
8.3. THE DOW CHEMICAL COMPANY
8.3.1. Company overview
8.3.2. Company snapshot
8.3.3. Operating business segments
8.3.4. Product portfolio
8.3.5. Business performance
8.4. AKZO NOBEL N.V.
8.4.1. Company overview
8.4.2. Company snapshot
8.4.3. Operating business segments
8.4.4. Product portfolio
8.4.5. Business performance
8.4.6. Key strategic moves and developments
8.5. DAICEL CORPORATION
8.5.1. Company overview
8.5.2. Company snapshot
8.5.3. Operating business segments
8.5.4. Product portfolio
8.5.5. Business performance
8.6. INEOS GROUP AG
8.6.1. Company overview
8.6.2. Company snapshot
8.6.3. Operating business segments
8.6.4. Product portfolio
8.6.5. Business performance
8.6.6. Key strategic moves and developments
8.7. KOCH INDUSTRIES (INVISTA)
8.7.1. Company overview
8.7.2. Company snapshot
8.7.3. Product portfolio
8.8. MITSUBISHI GAS CHEMICAL COMPANY, INC.
8.8.1. Company overview
8.8.2. Company snapshot
8.8.3. Operating business segments
8.8.4. Product portfolio
8.8.5. Business performance
8.9. EASTMAN CHEMICAL COMPANY (TAMINCO)
8.9.1. Company overview
8.9.2. Company snapshot
8.9.3. Operating business segments
8.9.4. Product portfolio
8.9.5. Business performance
8.9.6. Key strategic moves and developments
8.10. SINOPEC CORP
8.10.1. Company over view
8.10.2. Company snapshot
8.10.3. Operating business segments
8.10.4. Product portfolio
            8.10.5. Business performanc
TABLE 01. NORTH AMERICA ETHANOLAMINE MARKET BY TYPE 2017-2025, ($MILLION)
TABLE 02. NORTH AMERICA ETHANOLAMINE MARKET BY TYPE 2017-2025, (THOUSAND TONS)
TABLE 03. NORTH AMERICA ETHANOLAMINE MARKET BY APPLICATION 2017-2025, ($MILLION)
TABLE 04. NORTH AMERICA ETHANOLAMINE MARKET, BY APPLICATION 2017-2025, (THOUSAND TONS)
TABLE 05. NORTH AMERICA ETHANOLAMINE MARKET BY END-USER INDUSTRY 2017-2025, ($MILLION)
TABLE 06. NORTH AMERICA ETHANOLAMINE MARKET BY END-USER INDUSTRY 2017-2025, (THOUSAND TONS)
TABLE 07. NORTH AMERICA ETHANOLAMINE MARKET BY COUNTRY 2017-2025, ($MILLION)
TABLE 08. NORTH AMERICA ETHANOLAMINE MARKET BY COUNTRY 2017-2025, (THOUSAND TONS)
TABLE 09. NORTH AMERICA ETHANOLAMINE MARKET BY TYPE 2017-2025, ($MILLION)
TABLE 10. NORTH AMERICA ETHANOLAMINE MARKET BY TYPE 2017-2025, (THOUSAND TONS)
TABLE 11. NORTH AMERICA ETHANOLAMINE MARKET BY APPLICATION 2017-2025, ($MILLION)
TABLE 12. NORTH AMERICA ETHANOLAMINE MARKET BY APPLICATION 2017-2025, (THOUSAND TONS)
TABLE 13. NORTH AMERICA ETHANOLAMINE MARKET BY END-USER INDUSTRY 2017-2025, ($MILLION)
TABLE 14. NORTH AMERICA ETHANOLAMINE MARKET BY END-USER INDUSTRY 2017-2025, (THOUSAND TONS)
TABLE 15. BASF: COMPANY SNAPSHOT
TABLE 16. BASF: OPERATING SEGMENTS
TABLE 17. BASF: PRODUCT PORTFOLIO
TABLE 18. BASF: KEY STRATEGIC MOVES AND DEVELOPMENTS
TABLE 19. HUNTSMAN: COMPANY SNAPSHOT
TABLE 20. HUNTSMAN: OPERATING SEGMENTS
TABLE 21. HUNTSMAN: PRODUCT PORTFOLIO
TABLE 22. HUNTSMAN: KEY STRATEGIC MOVES AND DEVELOPMENTS
TABLE 23. DOW: COMPANY SNAPSHOT
TABLE 24. DOW: OPERATING SEGMENTS
TABLE 25. DOW: PRODUCT PORTFOLIO
TABLE 26. AKZO: COMPANY SNAPSHOT
TABLE 27. AKZO: OPERATING SEGMENTS
TABLE 28. AKZO: PRODUCT PORTFOLIO
TABLE 29. AKZO: KEY STRATEGIC MOVES AND DEVELOPMENTS
TABLE 30. DAICEL: COMPANY SNAPSHOT
TABLE 31. DAICEL: OPERATING SEGMENTS
TABLE 32. DAICEL : PRODUCT PORTFOLIO
TABLE 33. INEOS: COMPANY SNAPSHOT
TABLE 34. INEOS: OPERATING SEGMENTS
TABLE 35. INEOS: PRODUCT PORTFOLIO
TABLE 36. AKZO: KEY STRATEGIC MOVES AND DEVELOPMENTS
TABLE 37. INVISTA: COMPANY SNAPSHOT
TABLE 38. INVISTA: PRODUCT PORTFOLIO
TABLE 39. MGC: COMPANY SNAPSHOT
TABLE 40. MGC: OPERATING SEGMENTS
TABLE 41. MGC: PRODUCT PORTFOLIO
TABLE 42. EASTMAN CHEMICAL COMPANY: COMPANY SNAPSHOT
TABLE 43. EASTMAN CHEMICAL COMPANY: OPERATING SEGMENTS
TABLE 44. EASTMAN CHEMICAL COMPANY: PRODUCT PORTFOLIO
TABLE 45. EASTMAN CHEMICAL COMPANY: KEY STRATEGIC MOVES AND DEVELOPMENTS
TABLE 46. SINOPEC: COMPANY SNAPSHOT
TABLE 47. SINOPEC: OPERATING SEGMENTS
TABLE 48. SINOPEC: PRODUCT PORTFOLIO FIGURE 01. NORTH AMERICA ETHANOLAMINE MARKET SEGMENTATION
FIGURE 02. NORTH AMERICA ETHANOLAMINE MARKET: TOP INVESTMENT POCKETS
FIGURE 03. TOP WINNING STRATEGIES, BY YEAR, 2015-2018*
FIGURE 04. TOP WINNING STRATEGIES, BY DEVELOPMENT, 2015-2018*
FIGURE 05. TOP WINNING STRATEGIES, BY COMPANY, 2015-2018*
FIGURE 06. HIGH BARGAINING POWER OF SUPPLIERS
FIGURE 07. HIGH BARGAINING POWER OF BUYERS
FIGURE 08. HIGH THREAT OF NEW ENTRANTS
FIGURE 10. HIGH INTENSITY OF COMPETITIVE RIVALRY
FIGURE 11. TOP PLAYER POSITIONING, 2017
FIGURE 12. NORTH AMERICA ETHANOLAMINE MARKET: IMPACT ANALYSES
FIGURE 13. NORTH AMERICA MEA MARKET, BY TYPE VALUE ($MILLION) AND VOLUME (THOUSAND TONS), 2017-2025
FIGURE 14. NORTH AMERICA DEA MARKET, BY TYPE VALUE ($MILLION) AND VOLUME (THOUSAND TONS), 2017-2025
FIGURE 15. NORTH AMERICA TEA MARKET, BY TYPE VALUE ($MILLION) AND VOLUME (THOUSAND TONS), 2017-2025
FIGURE 16. NORTH AMERICA ETHANOLAMINE MARKET FOR CLEANING, BY APPLICATION VALUE ($MILLION) AND VOLUME (THOUSAND TONS), 2017-2025
FIGURE 17. NORTH AMERICA ETHANOLAMINE MARKET FOR GAS TREATMENT, BY APPLICATION VALUE ($MILLION) AND VOLUME (THOUSAND TONS), 2017-2025
FIGURE 18. NORTH AMERICA ETHANOLAMINE MARKET FOR WATER TREATMENT, BY APPLICATION VALUE ($MILLION) AND VOLUME (THOUSAND TONS), 2017-2025
FIGURE 19. NORTH AMERICA ETHANOLAMINE MARKET FOR COSMETICS, BY APPLICATION VALUE ($MILLION) AND VOLUME (THOUSANDS), 2017-2025
FIGURE 20. NORTH AMERICA ETHANOLAMINE MARKET FOR LUBRICANTS, BY APPLICATION VALUE ($MILLION) AND VOLUME (THOUSAND TONS), 2017-2025
FIGURE 21. NORTH AMERICA ETHANOLAMINE MARKET FOR OTHERS, BY APPLICATION VALUE ($MILLION) AND VOLUME (THOUSAND TONS), 2017-2025
FIGURE 22. NORTH AMERICA ETHANOLAMINE MARKET FOR POLYURETHANE, BY END-USER INDUSTRY VALUE ($MILLION) AND VOLUME (THOUSAND TONS), 2017-2025
FIGURE 23. NORTH AMERICA ETHANOLAMINE MARKET FOR PERSONAL CARE, BY END-USER INDUSTRY VALUE ($MILLION) AND VOLUME (THOUSAND TONS), 2017-2025
FIGURE 24. NORTH AMERICA ETHANOLAMINE MARKET FOR CHEMICAL, BY END-USER INDUSTRY ($MILLION) AND VOLUME (THOUSAND TONS), 2017-2025
FIGURE 25. NORTH AMERICA ETHANOLAMINE MARKET FOR AGROCHEMICAL, BY END-USER INDUSTRY VALUE ($MILLION) AND VOLUME (THOUSAND TONS), 2017-2025
FIGURE 26. NORTH AMERICA ETHANOLAMINE MARKET FOR RUBBER,OIL & PETROCHEMICAL, BY APPLICATION VALUE ($MILLION) AND VOLUME (THOUSAND TONS), 2017-2025
FIGURE 27. NORTH AMERICA ETHANOLAMINE MARKET FOR OTHERS, BY END-USER INDUSTRY VALUE ($MILLION) AND VOLUME (THOUSAND TONS), 2017-2025
FIGURE 28. U.S. ETHANOLAMINE MARKET, BY TYPE VALUE ($MILLION) AND VOLUME (THOUSAND TONS), 2017-2025
FIGURE 29. CANADA ETHANOLAMINE MARKET, BY TYPE VALUE ($MILLION) AND VOLUME (THOUSAND TONS), 2017-2025
FIGURE 30. MEXICO ETHANOLAMINE MARKET, BY TYPE VALUE ($MILLION) AND VOLUME (THOUSAND TONS), 2017-2025
FIGURE 31. BASF: REVENUE, 20152017 ($MILLION)
FIGURE 32. BASF: REVENUE SHARE BY SEGMENT, 2017 (%)
FIGURE 33. BASF: REVENUE SHARE BY GEOGRAPHY, 2017 (%)
FIGURE 34. HUNTSMAN: REVENUE, 20152017 ($MILLION)
FIGURE 35. HUNTSMAN: REVENUE SHARE BY SEGMENT, 2017 (%)
FIGURE 36. HUNTSMAN: REVENUE SHARE BY GEOGRAPHY, 2017 (%)
FIGURE 37. DOW: REVENUE, 20152017 ($MILLION)
FIGURE 38. DOW: REVENUE SHARE BY SEGMENT, 2017 (%)
FIGURE 39. DOW: REVENUE SHARE BY GEOGRAPHY, 2017 (%)
FIGURE 40. AKZO: REVENUE, 20152017 ($MILLION)
FIGURE 41. AKZO: REVENUE SHARE BY SEGMENT, 2017 (%)
FIGURE 42. AKZO: REVENUE SHARE BY GEOGRAPHY, 2017 (%)
FIGURE 43. DAICEL: REVENUE, 20162018 ($MILLION)
FIGURE 44. DAICEL: REVENUE SHARE BY SEGMENT, 2018 (%)
FIGURE 45. DAICEL: REVENUE SHARE BY GEOGRAPHY, 2018 (%)
FIGURE 46. INEOS: REVENUE, 20152017 ($MILLION)
FIGURE 47. INEOS: REVENUE SHARE BY SEGMENT, 2017 (%)
FIGURE 48. INEOS: REVENUE SHARE BY GEOGRAPHY, 2017 (%)
FIGURE 49. MGC: REVENUE, 20152017 ($MILLION)
FIGURE 50. MGC: REVENUE SHARE BY SEGMENT, 2017 (%)
FIGURE 51. MGC: REVENUE SHARE BY GEOGRAPHY, 2017 (%)
FIGURE 52. EASTMAN CHEMICAL COMPANY: REVENUE, 20152017 ($MILLION)
FIGURE 53. EASTMAN: REVENUE SHARE BY SEGMENT, 2017 (%)
FIGURE 54. EASTMAN CHEMICAL COMPANY: REVENUE SHARE BY GEOGRAPHY, 2017 (%)
FIGURE 55. SINOPEC: REVENUE, 20152017 ($MILLION)
FIGURE 56. SINOPEC: REVENUE SHARE BY SEGMENT, 2017 (%)
FIGURE 57. SINOPEC: REVENUE SHARE BY GEOGRAPHY, 2017 (%
SELECT A FORMAT
Added to Cart
Electronic (PDF)

$5500

This license allows only one user to access the PDF.
Electronic (PDF)

$6606

This license allows 1 - 5 user to access the PDF, license is suitable for small groups of 5 users working together
Electronic (PDF)

$9213

This license allows users/teams in a same Enterprise to use this report, various departments within an enterpise can use this report
Add to Cart
Buy Now (15% Discount)

OUR CUSTOMER

Samsung SD

RELATED REPORTS

Global Medical and Research Grade Collagen Market Research Report 2024

120 Pages
Type: Report
Code: QYRE-Auto-23P9785
Sun Apr 28 00:00:00 UTC 2024

Add to Cart

Global Starch Softgel Capsules Market Research Report 2024

120 Pages
Type: Report
Code: QYRE-Auto-5P7328
Sun Apr 28 00:00:00 UTC 2024

Add to Cart

Global Potassium Nitrate (KNO3) Market Research Report 2024

120 Pages
Type: Report
Code: QYRE-Auto-5U3847
Mon Apr 15 00:00:00 UTC 2024

Add to Cart

Global Complement Deficiency Tests Market Research Report 2024

120 Pages
Type: Report
Code: QYRE-Auto-22P5979
Mon Apr 15 00:00:00 UTC 2024

Add to Cart