0
U.S. (TOLL FREE)
+1 (315) 215-3225
Automative

0
U.S. (TOLL FREE)
+1 (315) 215-3225
Leukapheresis Market By Product (Devices, Disposables), By Method (Centrifugation, Membrane Separation, Selective Adsorption), By Application (Therapeutic Applications, Research Applications), By End User (Blood Centers, Hospitals, Others): Global Opportunity Analysis and Industry Forecast, 2021-2031
Published Date: October 2022
|
Report Code: ALLI-Auto-1G854
Home | Market Reports | Health| Medical Devices & Equipment
Leukapheresis Market By Product Devices Disposables By Method Centrifugation Membrane Separation Selective Adsorption By Application Therapeutic Applications Research Applications By End User Blood Centers Hospitals Others Global Opportunity Analysis and Industry Forecast 2021 2031
BUY CHAPTERS

Leukapheresis Market By Product (Devices, Disposables), By Method (Centrifugation, Membrane Separation, Selective Adsorption), By Application (Therapeutic Applications, Research Applications), By End User (Blood Centers, Hospitals, Others): Global Opportunity Analysis and Industry Forecast, 2021-2031

Code: ALLI-Auto-1G854
Report
October 2022
Pages:274
Allied Market Research
Buy Now with 15% Discount
DESCRIPTION
TABLE OF CONTENT
TABLES & FIGURES

Leukapheresis Market Size

According to a new report published by , titled, “Leukapheresis Market," The leukapheresis market size was valued at $245.65 million in 2021, and is estimated to reach $561.6 million by 2031, growing at a CAGR of 8.6% from 2022 to 2031.

Leukapheresis Market

Leukapheresis Market

Leukapheresis is used to separate leukocytes from peripheral blood. It is a type of apheresis used to remove leukocytes and re-infuse plasma deficient in leukocytes. After the removal of white blood cells, remaining components are then returned to the donor or patient either during the process or at the end of the process. It is used to treat chronic lymphocytic leukemia (CLL) or patients with very high white blood cell counts.
Leukapheresis is the choice of treatment for patients suffering from leukemia as in few cases chemotherapy may not lower the number of cells until a few days after the first dose. Thus, with increase in number of leukemia patients across the globe, leukapheresis is expected to gain traction in the future. For instance, according to the North American Association of Central Cancer Registries (NAACCR), the U.S. is estimated to record 6,660 cases of acute lymphocytic leukemia in 2022.
The leukapheresis market trends include, increase in demand for leukapheresis in developed countries such as the U.S. Moreover, rise in prevalence of chronic diseases such as leukemia also propel the market growth. In addition, rise in demand and adoption of leukopaks in various applications such as R&D activities further drives the market growth.
Furthermore, rise in government initiatives that promote blood donations in developing countries such as China and India propel the market growth during leukapheresis market forecast. For instance, Twitter launched a social initiative called BloodMatters in India in March 2018. It collaborated with the voluntary blood donation helpline named Blood Donors.
The COVID-19 outbreak is anticipated to have a positive impact on growth of the global leukapheresis market. The leukapheresis industry was benefited from the COVID-19, as the vaccines which were undergoing clinical testing included the research on white blood cells. This research was the crucial part in the creation of new vaccinations.
Additionally, research is being done to determine how COVID-19 affects white blood cells. For instance, in order to comprehend how SARS-CoV-2 affects lymphocytes, the NIH (National Institute of Health) is carrying out clinical trials that call for leukapheresis. In addition, regularization of supply chain of medications by key players and rise in the number of patient visits for investigation and treatment anticipated to fuel the growth of leukapheresis market after COVID-19 pandemic. 
The leukapheresis market size is segmented on the basis of product, method, application, end user and region. By product, the market is segmented into devices and disposables. The disposables segment exhibited highest growth in 2021, and is expected to remain dominant during the forecast period, owing to rise in demand for leukapheresis procedures for isolation of white blood cells, which requires disposables. For instance, Terumo BCT, Inc. manufactures cost-effective blood bags while maintaining efficacy and quality of the bags. In addition, increase in prevalence of leukemia leads to rise in demand for leukapheresis disposables, which further boosts the segment growth.
On the basis of method, the market is segmented into centrifugation, membrane separation, and selective adsorption. The centrifugation segment exhibited highest leukapheresis market share in 2021, owing to the fact that centrifugation is considered to be a standard method for leukapheresis and is highly favored by the blood industry across the globe.
However, the membrane separation segment is projected to register highest CAGR during the forecast period. This is attributed to rise in demand for membrane separation leukapheresis as it prevents the need for replacement fluids by not depleting the blood coagulation factors boost the market growth during leukapheresis market analysis.
On the basis of application, the market is segmented into therapeutics application and research application. The therapeutics application segment dominated the market in 2021. This was attributed to rise in demand for leukapheresis procedure as it removes the excess white blood cells. Moreover, the research application segment is projected to register a highest CAGR during the forecast period, owing to rise in R&D activities for cancer leads to increases the demand for leukopak in clinical trial.
On the basis of end user, the market is segmented into blood centers, hospitals and others. Others segment further includes research institutes, biopharmaceutical manufacturers, and private medical settings. The blood centers segment dominated the market in 2021. This was attributed to increase in number of blood centers across the globe. In addition, increase in number of blood donations, which lead to increase in number of blood centers in the country.
Moreover, the others segment is projected to register highest CAGR  during the forecast period, owing to increasing research studies in research institutes which is focused on white blood cells to treat diseases such as cancer.
North America accounted for the largest leukapheresis market share of the global leukapheresis market in 2021, owing to high incidences of leukemia and rise in infrastructure. In addition, rise in technological innovations for leukapheresis devices and increase in awareness regarding blood donation further drive the market growth in this region.
However, Asia-Pacific is expected to fastest CAGR during the forecast period, owing to factors such as rise in investments in manufacturing of high-quality leukapheresis devices and disposables. In addition, increase in healthcare infrastructure in this region further propel the market growth.
KEY FINDINGS OF THE STUDY 
• Based on type, the disposables segment held largest share in the leukapheresis industry in 2021.
• On the basis of method, the centrifugation segment held largest market share in 2021. However, membrane separation segment is anticipated to grow at the highest CAGR  during the forecast period.
• Based on application, therapeutics application segment dominated the market in 2021. However, research application segment is expected to register highest CAGR ofduring the forecast period.
• On the basis of end user, blood centers segment dominated the market in 2021. However, others segment is anticipated to grow at the highest CAGR during the forecast period.
• On the basis of region, North America held largest share in the global market in 2021. However, Asia-Pacific is anticipated to grow at the highest CAGR during the forecast period.

Overview

The global leukapheresis market was valued at $245.65 million in 2021 and is projected to reach $561.64 million by 2031 registering a CAGR of 8.6% from 2022 to 2031.
Leukapheresis is a laboratory procedure in which white blood cells are removed from a sample of blood. In this process, blood passes through a machine that takes out white blood cells and returns all other blood cells and plasma back into the bloodstream. In addition, the process includes insertion of two intravenous (IV) lines into body. One IV line removes blood while the other carries cleaned blood back to the body. This procedure takes approximately two to three hours to complete.
The growth of global leukapheresis market is majorly driven by increase in demand for leukapheresis, owing to increase in incidences and prevalence of leukemia. In addition, increase in demand for blood donations and rise in demand for leukopaks in clinical research studies responsible for the market growth. Furthermore, increase in awareness regarding leukapheresis procedures in developed countries such as the U.S. further fuel the market growth. However high cost associated with leukapheresis therapeutics and leukopak and blood transfusion safety in developing countries hinder the market growth. Conversely, increase in demand for leukapheresis in pediatric patients is anticipated to provide lucrative opportunities to the market players. 
The global leukapheresis market is segmented into product, method, application, end user, and region. By product, the market is categorized into devices and disposables. On the basis of method, it is segregated into centrifugation, membrane separation, and selective adsorption. By application, it is classified into therapeutics application and research application. On the basis of end user, it is categorized into blood centers, hospitals, and others. The others segment further includes research institutes, biopharmaceutical manufacturers, and private medical settings. Region wise, the market is analyzed across North America (the U.S., Canada, and Mexico), Europe (Germany, France, the UK, Italy, Spain, and rest of Europe), Asia-Pacific (Japan, China, Australia, India, South Korea, and rest of Asia-Pacific), and LAMEA (Brazil, South Africa, Saudi Arabia, and rest of LAMEA).

Key Benefits For Stakeholders

●This report provides a quantitative analysis of the market segments, current trends, estimations, and dynamics of the leukapheresis market analysis from 2021 to 2031 to identify the prevailing leukapheresis market opportunities.
●The market research is offered along with information related to key drivers, restraints, and opportunities.
●Porter's five forces analysis highlights the potency of buyers and suppliers to enable stakeholders make profit-oriented business decisions and strengthen their supplier-buyer network.
●In-depth analysis of the leukapheresis market segmentation assists to determine the prevailing market opportunities.
●Major countries in each region are mapped according to their revenue contribution to the global market.
●Market player positioning facilitates benchmarking and provides a clear understanding of the present position of the market players.
●The report includes the analysis of the regional as well as global leukapheresis market trends, key players, market segments, application areas, and market growth strategies.
Key Market Segments
○ Terumo BCT, Inc

Scope of Leukapheresis Market Report

Report Metric Details
Report Name Leukapheresis Market
Accounted market size in 2021 $ 245.65 million
Forecasted market size in 2031 $ 561.6 million
CAGR 8.6%
Base Year 2021
Forecasted years 2024 - 2031
By Product ● Devices
● Disposables
By Method ● Centrifugation
● Membrane Separation
● Selective Adsorption
By Application ● Research Applications
● Therapeutic Applications
By End User ● Blood Centers
● Hospitals
● Others
By Region
  • North America (United States, Canada)
  • Europe (Germany, France, UK, Italy, Russia) Rest of Europe
  • Nordic Countries
  • Asia-Pacific (China, Japan, South Korea)
  • Southeast Asia (India, Australia)
  • Rest of Asia
  • Latin America (Mexico, Brazil)
  • Rest of Latin America
  • Middle East & Africa (Turkey, Saudi Arabia, UAE, Rest of MEA)
Forecast units USD million in value
Report coverage Revenue and volume forecast, company share, competitive landscape, growth factors and trends

FAQ for this report

How fast is Leukapheresis Market growing?

Ans: The Leukapheresis Market witnessing a CAGR of 8.6% during the forecast period 2024-2031.

What is the Leukapheresis Market size in 2031?

Ans: The Leukapheresis Market size in 2031 will be $ 561.6 million.

What are the Application segmentation covered in the Leukapheresis Market report?

Ans: The Applications covered in the Leukapheresis Market report are ● Research Applications, ● Therapeutic Applications

What are the End User segmentation covered in the Leukapheresis Market report?

Ans: The End users covered in the Leukapheresis Market report are ● Blood Centers, ● Hospitals, ● Others

CHAPTER 1:INTRODUCTION
1.1.Report description
1.2.Key market segments
1.3.Key benefits to the stakeholders
1.4.Research Methodology
1.4.1.Secondary research
1.4.2.Primary research
1.4.3.Analyst tools and models
CHAPTER 2:EXECUTIVE SUMMARY
2.1.Key findings of the study
2.2.CXO Perspective
CHAPTER 3:MARKET OVERVIEW
3.1.Market definition and scope
3.2.Key findings
3.2.1.Top investment pockets
3.3.Porter’s five forces analysis
3.4.Top player positioning
3.5.Market dynamics
3.5.1.Drivers
3.5.2.Restraints
3.5.3.Opportunities
3.6.COVID-19 Impact Analysis on the market
CHAPTER 4: LEUKAPHERESIS MARKET, BY PRODUCT
4.1 Overview
4.1.1 Market size and forecast
4.2 Devices
4.2.1 Key market trends, growth factors and opportunities
4.2.2 Market size and forecast, by region
4.2.3 Market analysis by country
4.3 Disposables
4.3.1 Key market trends, growth factors and opportunities
4.3.2 Market size and forecast, by region
4.3.3 Market analysis by country
CHAPTER 5: LEUKAPHERESIS MARKET, BY METHOD
5.1 Overview
5.1.1 Market size and forecast
5.2 Centrifugation
5.2.1 Key market trends, growth factors and opportunities
5.2.2 Market size and forecast, by region
5.2.3 Market analysis by country
5.3 Membrane Separation
5.3.1 Key market trends, growth factors and opportunities
5.3.2 Market size and forecast, by region
5.3.3 Market analysis by country
5.4 Selective Adsorption
5.4.1 Key market trends, growth factors and opportunities
5.4.2 Market size and forecast, by region
5.4.3 Market analysis by country
CHAPTER 6: LEUKAPHERESIS MARKET, BY APPLICATION
6.1 Overview
6.1.1 Market size and forecast
6.2 Therapeutic Applications
6.2.1 Key market trends, growth factors and opportunities
6.2.2 Market size and forecast, by region
6.2.3 Market analysis by country
6.3 Research Applications
6.3.1 Key market trends, growth factors and opportunities
6.3.2 Market size and forecast, by region
6.3.3 Market analysis by country
CHAPTER 7: LEUKAPHERESIS MARKET, BY END USER
7.1 Overview
7.1.1 Market size and forecast
7.2 Blood Centers
7.2.1 Key market trends, growth factors and opportunities
7.2.2 Market size and forecast, by region
7.2.3 Market analysis by country
7.3 Hospitals
7.3.1 Key market trends, growth factors and opportunities
7.3.2 Market size and forecast, by region
7.3.3 Market analysis by country
7.4 Others
7.4.1 Key market trends, growth factors and opportunities
7.4.2 Market size and forecast, by region
7.4.3 Market analysis by country
CHAPTER 8: LEUKAPHERESIS MARKET, BY REGION
8.1 Overview
8.1.1 Market size and forecast
8.2 North America
8.2.1 Key trends and opportunities
8.2.2 North America Market size and forecast, by Product
8.2.3 North America Market size and forecast, by Method
8.2.4 North America Market size and forecast, by Application
8.2.5 North America Market size and forecast, by End User
8.2.6 North America Market size and forecast, by country
8.2.6.1 U.S.
8.2.6.1.1 Market size and forecast, by Product
8.2.6.1.2 Market size and forecast, by Method
8.2.6.1.3 Market size and forecast, by Application
8.2.6.1.4 Market size and forecast, by End User
8.2.6.2 Canada
8.2.6.2.1 Market size and forecast, by Product
8.2.6.2.2 Market size and forecast, by Method
8.2.6.2.3 Market size and forecast, by Application
8.2.6.2.4 Market size and forecast, by End User
8.2.6.3 Mexico
8.2.6.3.1 Market size and forecast, by Product
8.2.6.3.2 Market size and forecast, by Method
8.2.6.3.3 Market size and forecast, by Application
8.2.6.3.4 Market size and forecast, by End User
8.3 Europe
8.3.1 Key trends and opportunities
8.3.2 Europe Market size and forecast, by Product
8.3.3 Europe Market size and forecast, by Method
8.3.4 Europe Market size and forecast, by Application
8.3.5 Europe Market size and forecast, by End User
8.3.6 Europe Market size and forecast, by country
8.3.6.1 Germany
8.3.6.1.1 Market size and forecast, by Product
8.3.6.1.2 Market size and forecast, by Method
8.3.6.1.3 Market size and forecast, by Application
8.3.6.1.4 Market size and forecast, by End User
8.3.6.2 France
8.3.6.2.1 Market size and forecast, by Product
8.3.6.2.2 Market size and forecast, by Method
8.3.6.2.3 Market size and forecast, by Application
8.3.6.2.4 Market size and forecast, by End User
8.3.6.3 UK
8.3.6.3.1 Market size and forecast, by Product
8.3.6.3.2 Market size and forecast, by Method
8.3.6.3.3 Market size and forecast, by Application
8.3.6.3.4 Market size and forecast, by End User
8.3.6.4 Italy
8.3.6.4.1 Market size and forecast, by Product
8.3.6.4.2 Market size and forecast, by Method
8.3.6.4.3 Market size and forecast, by Application
8.3.6.4.4 Market size and forecast, by End User
8.3.6.5 Spain
8.3.6.5.1 Market size and forecast, by Product
8.3.6.5.2 Market size and forecast, by Method
8.3.6.5.3 Market size and forecast, by Application
8.3.6.5.4 Market size and forecast, by End User
8.3.6.6 Rest of Europe
8.3.6.6.1 Market size and forecast, by Product
8.3.6.6.2 Market size and forecast, by Method
8.3.6.6.3 Market size and forecast, by Application
8.3.6.6.4 Market size and forecast, by End User
8.4 Asia-Pacific
8.4.1 Key trends and opportunities
8.4.2 Asia-Pacific Market size and forecast, by Product
8.4.3 Asia-Pacific Market size and forecast, by Method
8.4.4 Asia-Pacific Market size and forecast, by Application
8.4.5 Asia-Pacific Market size and forecast, by End User
8.4.6 Asia-Pacific Market size and forecast, by country
8.4.6.1 Japan
8.4.6.1.1 Market size and forecast, by Product
8.4.6.1.2 Market size and forecast, by Method
8.4.6.1.3 Market size and forecast, by Application
8.4.6.1.4 Market size and forecast, by End User
8.4.6.2 China
8.4.6.2.1 Market size and forecast, by Product
8.4.6.2.2 Market size and forecast, by Method
8.4.6.2.3 Market size and forecast, by Application
8.4.6.2.4 Market size and forecast, by End User
8.4.6.3 India
8.4.6.3.1 Market size and forecast, by Product
8.4.6.3.2 Market size and forecast, by Method
8.4.6.3.3 Market size and forecast, by Application
8.4.6.3.4 Market size and forecast, by End User
8.4.6.4 Australia
8.4.6.4.1 Market size and forecast, by Product
8.4.6.4.2 Market size and forecast, by Method
8.4.6.4.3 Market size and forecast, by Application
8.4.6.4.4 Market size and forecast, by End User
8.4.6.5 South Korea
8.4.6.5.1 Market size and forecast, by Product
8.4.6.5.2 Market size and forecast, by Method
8.4.6.5.3 Market size and forecast, by Application
8.4.6.5.4 Market size and forecast, by End User
8.4.6.6 Rest of Asia-Pacific
8.4.6.6.1 Market size and forecast, by Product
8.4.6.6.2 Market size and forecast, by Method
8.4.6.6.3 Market size and forecast, by Application
8.4.6.6.4 Market size and forecast, by End User
8.5 LAMEA
8.5.1 Key trends and opportunities
8.5.2 LAMEA Market size and forecast, by Product
8.5.3 LAMEA Market size and forecast, by Method
8.5.4 LAMEA Market size and forecast, by Application
8.5.5 LAMEA Market size and forecast, by End User
8.5.6 LAMEA Market size and forecast, by country
8.5.6.1 Brazil
8.5.6.1.1 Market size and forecast, by Product
8.5.6.1.2 Market size and forecast, by Method
8.5.6.1.3 Market size and forecast, by Application
8.5.6.1.4 Market size and forecast, by End User
8.5.6.2 Saudi Arabia
8.5.6.2.1 Market size and forecast, by Product
8.5.6.2.2 Market size and forecast, by Method
8.5.6.2.3 Market size and forecast, by Application
8.5.6.2.4 Market size and forecast, by End User
8.5.6.3 South Africa
8.5.6.3.1 Market size and forecast, by Product
8.5.6.3.2 Market size and forecast, by Method
8.5.6.3.3 Market size and forecast, by Application
8.5.6.3.4 Market size and forecast, by End User
8.5.6.4 Rest of LAMEA
8.5.6.4.1 Market size and forecast, by Product
8.5.6.4.2 Market size and forecast, by Method
8.5.6.4.3 Market size and forecast, by Application
8.5.6.4.4 Market size and forecast, by End User
CHAPTER 9: COMPANY LANDSCAPE
9.1. Introduction
9.2. Top winning strategies
9.3. Product Mapping of Top 10 Player
9.4. Competitive Dashboard
9.5. Competitive Heatmap
9.6. Key developments
CHAPTER 10: COMPANY PROFILES
10.1 Adacyte Therapeutics
10.1.1 Company overview
10.1.2 Company snapshot
10.1.3 Operating business segments
10.1.4 Product portfolio
10.1.5 Business performance
10.1.6 Key strategic moves and developments
10.2 AllCells, LLC.
10.2.1 Company overview
10.2.2 Company snapshot
10.2.3 Operating business segments
10.2.4 Product portfolio
10.2.5 Business performance
10.2.6 Key strategic moves and developments
10.3 Asahi Kasei Corporation
10.3.1 Company overview
10.3.2 Company snapshot
10.3.3 Operating business segments
10.3.4 Product portfolio
10.3.5 Business performance
10.3.6 Key strategic moves and developments
10.4 Charles River Laboratories International, Inc.
10.4.1 Company overview
10.4.2 Company snapshot
10.4.3 Operating business segments
10.4.4 Product portfolio
10.4.5 Business performance
10.4.6 Key strategic moves and developments
10.5 Cerus Corporation
10.5.1 Company overview
10.5.2 Company snapshot
10.5.3 Operating business segments
10.5.4 Product portfolio
10.5.5 Business performance
10.5.6 Key strategic moves and developments
10.6 Fresenius Kabi
10.6.1 Company overview
10.6.2 Company snapshot
10.6.3 Operating business segments
10.6.4 Product portfolio
10.6.5 Business performance
10.6.6 Key strategic moves and developments
10.7 Haemonetics Corporation
10.7.1 Company overview
10.7.2 Company snapshot
10.7.3 Operating business segments
10.7.4 Product portfolio
10.7.5 Business performance
10.7.6 Key strategic moves and developments
10.8 Macopharma
10.8.1 Company overview
10.8.2 Company snapshot
10.8.3 Operating business segments
10.8.4 Product portfolio
10.8.5 Business performance
10.8.6 Key strategic moves and developments
10.9 SB-Kawasumi Laboratories, Inc.
10.9.1 Company overview
10.9.2 Company snapshot
10.9.3 Operating business segments
10.9.4 Product portfolio
10.9.5 Business performance
10.9.6 Key strategic moves and developments
10.10 Terumo BCT, Inc.
10.10.1 Company overview
10.10.2 Company snapshot
10.10.3 Operating business segments
10.10.4 Product portfolio
10.10.5 Business performance
10.10.6 Key strategic moves and development
LIST OF TABLES
TABLE 1. GLOBAL LEUKAPHERESIS MARKET, BY PRODUCT, 2021-2031 ($MILLION)
TABLE 2. LEUKAPHERESIS MARKET, FOR DEVICES, BY REGION, 2021-2031 ($MILLION)
TABLE 3. LEUKAPHERESIS MARKET FOR DEVICES, BY COUNTRY, 2021-2031 ($MILLION)
TABLE 4. LEUKAPHERESIS MARKET, FOR DISPOSABLES, BY REGION, 2021-2031 ($MILLION)
TABLE 5. LEUKAPHERESIS MARKET FOR DISPOSABLES, BY COUNTRY, 2021-2031 ($MILLION)
TABLE 6. GLOBAL LEUKAPHERESIS MARKET, BY METHOD, 2021-2031 ($MILLION)
TABLE 7. LEUKAPHERESIS MARKET, FOR CENTRIFUGATION, BY REGION, 2021-2031 ($MILLION)
TABLE 8. LEUKAPHERESIS MARKET FOR CENTRIFUGATION, BY COUNTRY, 2021-2031 ($MILLION)
TABLE 9. LEUKAPHERESIS MARKET, FOR MEMBRANE SEPARATION, BY REGION, 2021-2031 ($MILLION)
TABLE 10. LEUKAPHERESIS MARKET FOR MEMBRANE SEPARATION, BY COUNTRY, 2021-2031 ($MILLION)
TABLE 11. LEUKAPHERESIS MARKET, FOR SELECTIVE ADSORPTION, BY REGION, 2021-2031 ($MILLION)
TABLE 12. LEUKAPHERESIS MARKET FOR SELECTIVE ADSORPTION, BY COUNTRY, 2021-2031 ($MILLION)
TABLE 13. GLOBAL LEUKAPHERESIS MARKET, BY APPLICATION, 2021-2031 ($MILLION)
TABLE 14. LEUKAPHERESIS MARKET, FOR THERAPEUTIC APPLICATIONS, BY REGION, 2021-2031 ($MILLION)
TABLE 15. LEUKAPHERESIS MARKET FOR THERAPEUTIC APPLICATIONS, BY COUNTRY, 2021-2031 ($MILLION)
TABLE 16. LEUKAPHERESIS MARKET, FOR RESEARCH APPLICATIONS, BY REGION, 2021-2031 ($MILLION)
TABLE 17. LEUKAPHERESIS MARKET FOR RESEARCH APPLICATIONS, BY COUNTRY, 2021-2031 ($MILLION)
TABLE 18. GLOBAL LEUKAPHERESIS MARKET, BY END USER, 2021-2031 ($MILLION)
TABLE 19. LEUKAPHERESIS MARKET, FOR BLOOD CENTERS, BY REGION, 2021-2031 ($MILLION)
TABLE 20. LEUKAPHERESIS MARKET FOR BLOOD CENTERS, BY COUNTRY, 2021-2031 ($MILLION)
TABLE 21. LEUKAPHERESIS MARKET, FOR HOSPITALS, BY REGION, 2021-2031 ($MILLION)
TABLE 22. LEUKAPHERESIS MARKET FOR HOSPITALS, BY COUNTRY, 2021-2031 ($MILLION)
TABLE 23. LEUKAPHERESIS MARKET, FOR OTHERS, BY REGION, 2021-2031 ($MILLION)
TABLE 24. LEUKAPHERESIS MARKET FOR OTHERS, BY COUNTRY, 2021-2031 ($MILLION)
TABLE 25. LEUKAPHERESIS MARKET, BY REGION, 2021-2031 ($MILLION)
TABLE 26. NORTH AMERICA LEUKAPHERESIS MARKET, BY PRODUCT, 2021-2031 ($MILLION)
TABLE 27. NORTH AMERICA LEUKAPHERESIS MARKET, BY METHOD, 2021-2031 ($MILLION)
TABLE 28. NORTH AMERICA LEUKAPHERESIS MARKET, BY APPLICATION, 2021-2031 ($MILLION)
TABLE 29. NORTH AMERICA LEUKAPHERESIS MARKET, BY END USER, 2021-2031 ($MILLION)
TABLE 30. NORTH AMERICA LEUKAPHERESIS MARKET, BY COUNTRY, 2021-2031 ($MILLION)
TABLE 31. U.S. LEUKAPHERESIS MARKET, BY PRODUCT, 2021-2031 ($MILLION)
TABLE 32. U.S. LEUKAPHERESIS MARKET, BY METHOD, 2021-2031 ($MILLION)
TABLE 33. U.S. LEUKAPHERESIS MARKET, BY APPLICATION, 2021-2031 ($MILLION)
TABLE 34. U.S. LEUKAPHERESIS MARKET, BY END USER, 2021-2031 ($MILLION)
TABLE 35. CANADA LEUKAPHERESIS MARKET, BY PRODUCT, 2021-2031 ($MILLION)
TABLE 36. CANADA LEUKAPHERESIS MARKET, BY METHOD, 2021-2031 ($MILLION)
TABLE 37. CANADA LEUKAPHERESIS MARKET, BY APPLICATION, 2021-2031 ($MILLION)
TABLE 38. CANADA LEUKAPHERESIS MARKET, BY END USER, 2021-2031 ($MILLION)
TABLE 39. MEXICO LEUKAPHERESIS MARKET, BY PRODUCT, 2021-2031 ($MILLION)
TABLE 40. MEXICO LEUKAPHERESIS MARKET, BY METHOD, 2021-2031 ($MILLION)
TABLE 41. MEXICO LEUKAPHERESIS MARKET, BY APPLICATION, 2021-2031 ($MILLION)
TABLE 42. MEXICO LEUKAPHERESIS MARKET, BY END USER, 2021-2031 ($MILLION)
TABLE 43. EUROPE LEUKAPHERESIS MARKET, BY PRODUCT, 2021-2031 ($MILLION)
TABLE 44. EUROPE LEUKAPHERESIS MARKET, BY METHOD, 2021-2031 ($MILLION)
TABLE 45. EUROPE LEUKAPHERESIS MARKET, BY APPLICATION, 2021-2031 ($MILLION)
TABLE 46. EUROPE LEUKAPHERESIS MARKET, BY END USER, 2021-2031 ($MILLION)
TABLE 47. EUROPE LEUKAPHERESIS MARKET, BY COUNTRY, 2021-2031 ($MILLION)
TABLE 48. GERMANY LEUKAPHERESIS MARKET, BY PRODUCT, 2021-2031 ($MILLION)
TABLE 49. GERMANY LEUKAPHERESIS MARKET, BY METHOD, 2021-2031 ($MILLION)
TABLE 50. GERMANY LEUKAPHERESIS MARKET, BY APPLICATION, 2021-2031 ($MILLION)
TABLE 51. GERMANY LEUKAPHERESIS MARKET, BY END USER, 2021-2031 ($MILLION)
TABLE 52. FRANCE LEUKAPHERESIS MARKET, BY PRODUCT, 2021-2031 ($MILLION)
TABLE 53. FRANCE LEUKAPHERESIS MARKET, BY METHOD, 2021-2031 ($MILLION)
TABLE 54. FRANCE LEUKAPHERESIS MARKET, BY APPLICATION, 2021-2031 ($MILLION)
TABLE 55. FRANCE LEUKAPHERESIS MARKET, BY END USER, 2021-2031 ($MILLION)
TABLE 56. UK LEUKAPHERESIS MARKET, BY PRODUCT, 2021-2031 ($MILLION)
TABLE 57. UK LEUKAPHERESIS MARKET, BY METHOD, 2021-2031 ($MILLION)
TABLE 58. UK LEUKAPHERESIS MARKET, BY APPLICATION, 2021-2031 ($MILLION)
TABLE 59. UK LEUKAPHERESIS MARKET, BY END USER, 2021-2031 ($MILLION)
TABLE 60. ITALY LEUKAPHERESIS MARKET, BY PRODUCT, 2021-2031 ($MILLION)
TABLE 61. ITALY LEUKAPHERESIS MARKET, BY METHOD, 2021-2031 ($MILLION)
TABLE 62. ITALY LEUKAPHERESIS MARKET, BY APPLICATION, 2021-2031 ($MILLION)
TABLE 63. ITALY LEUKAPHERESIS MARKET, BY END USER, 2021-2031 ($MILLION)
TABLE 64. SPAIN LEUKAPHERESIS MARKET, BY PRODUCT, 2021-2031 ($MILLION)
TABLE 65. SPAIN LEUKAPHERESIS MARKET, BY METHOD, 2021-2031 ($MILLION)
TABLE 66. SPAIN LEUKAPHERESIS MARKET, BY APPLICATION, 2021-2031 ($MILLION)
TABLE 67. SPAIN LEUKAPHERESIS MARKET, BY END USER, 2021-2031 ($MILLION)
TABLE 68. REST OF EUROPE LEUKAPHERESIS MARKET, BY PRODUCT, 2021-2031 ($MILLION)
TABLE 69. REST OF EUROPE LEUKAPHERESIS MARKET, BY METHOD, 2021-2031 ($MILLION)
TABLE 70. REST OF EUROPE LEUKAPHERESIS MARKET, BY APPLICATION, 2021-2031 ($MILLION)
TABLE 71. REST OF EUROPE LEUKAPHERESIS MARKET, BY END USER, 2021-2031 ($MILLION)
TABLE 72. ASIA-PACIFIC LEUKAPHERESIS MARKET, BY PRODUCT, 2021-2031 ($MILLION)
TABLE 73. ASIA-PACIFIC LEUKAPHERESIS MARKET, BY METHOD, 2021-2031 ($MILLION)
TABLE 74. ASIA-PACIFIC LEUKAPHERESIS MARKET, BY APPLICATION, 2021-2031 ($MILLION)
TABLE 75. ASIA-PACIFIC LEUKAPHERESIS MARKET, BY END USER, 2021-2031 ($MILLION)
TABLE 76. ASIA-PACIFIC LEUKAPHERESIS MARKET, BY COUNTRY, 2021-2031 ($MILLION)
TABLE 77. JAPAN LEUKAPHERESIS MARKET, BY PRODUCT, 2021-2031 ($MILLION)
TABLE 78. JAPAN LEUKAPHERESIS MARKET, BY METHOD, 2021-2031 ($MILLION)
TABLE 79. JAPAN LEUKAPHERESIS MARKET, BY APPLICATION, 2021-2031 ($MILLION)
TABLE 80. JAPAN LEUKAPHERESIS MARKET, BY END USER, 2021-2031 ($MILLION)
TABLE 81. CHINA LEUKAPHERESIS MARKET, BY PRODUCT, 2021-2031 ($MILLION)
TABLE 82. CHINA LEUKAPHERESIS MARKET, BY METHOD, 2021-2031 ($MILLION)
TABLE 83. CHINA LEUKAPHERESIS MARKET, BY APPLICATION, 2021-2031 ($MILLION)
TABLE 84. CHINA LEUKAPHERESIS MARKET, BY END USER, 2021-2031 ($MILLION)
TABLE 85. INDIA LEUKAPHERESIS MARKET, BY PRODUCT, 2021-2031 ($MILLION)
TABLE 86. INDIA LEUKAPHERESIS MARKET, BY METHOD, 2021-2031 ($MILLION)
TABLE 87. INDIA LEUKAPHERESIS MARKET, BY APPLICATION, 2021-2031 ($MILLION)
TABLE 88. INDIA LEUKAPHERESIS MARKET, BY END USER, 2021-2031 ($MILLION)
TABLE 89. AUSTRALIA LEUKAPHERESIS MARKET, BY PRODUCT, 2021-2031 ($MILLION)
TABLE 90. AUSTRALIA LEUKAPHERESIS MARKET, BY METHOD, 2021-2031 ($MILLION)
TABLE 91. AUSTRALIA LEUKAPHERESIS MARKET, BY APPLICATION, 2021-2031 ($MILLION)
TABLE 92. AUSTRALIA LEUKAPHERESIS MARKET, BY END USER, 2021-2031 ($MILLION)
TABLE 93. SOUTH KOREA LEUKAPHERESIS MARKET, BY PRODUCT, 2021-2031 ($MILLION)
TABLE 94. SOUTH KOREA LEUKAPHERESIS MARKET, BY METHOD, 2021-2031 ($MILLION)
TABLE 95. SOUTH KOREA LEUKAPHERESIS MARKET, BY APPLICATION, 2021-2031 ($MILLION)
TABLE 96. SOUTH KOREA LEUKAPHERESIS MARKET, BY END USER, 2021-2031 ($MILLION)
TABLE 97. REST OF ASIA-PACIFIC LEUKAPHERESIS MARKET, BY PRODUCT, 2021-2031 ($MILLION)
TABLE 98. REST OF ASIA-PACIFIC LEUKAPHERESIS MARKET, BY METHOD, 2021-2031 ($MILLION)
TABLE 99. REST OF ASIA-PACIFIC LEUKAPHERESIS MARKET, BY APPLICATION, 2021-2031 ($MILLION)
TABLE 100. REST OF ASIA-PACIFIC LEUKAPHERESIS MARKET, BY END USER, 2021-2031 ($MILLION)
TABLE 101. LAMEA LEUKAPHERESIS MARKET, BY PRODUCT, 2021-2031 ($MILLION)
TABLE 102. LAMEA LEUKAPHERESIS MARKET, BY METHOD, 2021-2031 ($MILLION)
TABLE 103. LAMEA LEUKAPHERESIS MARKET, BY APPLICATION, 2021-2031 ($MILLION)
TABLE 104. LAMEA LEUKAPHERESIS MARKET, BY END USER, 2021-2031 ($MILLION)
TABLE 105. LAMEA LEUKAPHERESIS MARKET, BY COUNTRY, 2021-2031 ($MILLION)
TABLE 106. BRAZIL LEUKAPHERESIS MARKET, BY PRODUCT, 2021-2031 ($MILLION)
TABLE 107. BRAZIL LEUKAPHERESIS MARKET, BY METHOD, 2021-2031 ($MILLION)
TABLE 108. BRAZIL LEUKAPHERESIS MARKET, BY APPLICATION, 2021-2031 ($MILLION)
TABLE 109. BRAZIL LEUKAPHERESIS MARKET, BY END USER, 2021-2031 ($MILLION)
TABLE 110. SAUDI ARABIA LEUKAPHERESIS MARKET, BY PRODUCT, 2021-2031 ($MILLION)
TABLE 111. SAUDI ARABIA LEUKAPHERESIS MARKET, BY METHOD, 2021-2031 ($MILLION)
TABLE 112. SAUDI ARABIA LEUKAPHERESIS MARKET, BY APPLICATION, 2021-2031 ($MILLION)
TABLE 113. SAUDI ARABIA LEUKAPHERESIS MARKET, BY END USER, 2021-2031 ($MILLION)
TABLE 114. SOUTH AFRICA LEUKAPHERESIS MARKET, BY PRODUCT, 2021-2031 ($MILLION)
TABLE 115. SOUTH AFRICA LEUKAPHERESIS MARKET, BY METHOD, 2021-2031 ($MILLION)
TABLE 116. SOUTH AFRICA LEUKAPHERESIS MARKET, BY APPLICATION, 2021-2031 ($MILLION)
TABLE 117. SOUTH AFRICA LEUKAPHERESIS MARKET, BY END USER, 2021-2031 ($MILLION)
TABLE 118. REST OF LAMEA LEUKAPHERESIS MARKET, BY PRODUCT, 2021-2031 ($MILLION)
TABLE 119. REST OF LAMEA LEUKAPHERESIS MARKET, BY METHOD, 2021-2031 ($MILLION)
TABLE 120. REST OF LAMEA LEUKAPHERESIS MARKET, BY APPLICATION, 2021-2031 ($MILLION)
TABLE 121. REST OF LAMEA LEUKAPHERESIS MARKET, BY END USER, 2021-2031 ($MILLION)
TABLE 122.ADACYTE THERAPEUTICS: COMPANY SNAPSHOT
TABLE 123.ADACYTE THERAPEUTICS: OPERATING SEGMENTS
TABLE 124.ADACYTE THERAPEUTICS: PRODUCT PORTFOLIO
TABLE 125.ADACYTE THERAPEUTICS: NET SALES,
TABLE 126.ADACYTE THERAPEUTICS: KEY STRATERGIES
TABLE 127.ALLCELLS, LLC.: COMPANY SNAPSHOT
TABLE 128.ALLCELLS, LLC.: OPERATING SEGMENTS
TABLE 129.ALLCELLS, LLC.: PRODUCT PORTFOLIO
TABLE 130.ALLCELLS, LLC.: NET SALES,
TABLE 131.ALLCELLS, LLC.: KEY STRATERGIES
TABLE 132.ASAHI KASEI CORPORATION: COMPANY SNAPSHOT
TABLE 133.ASAHI KASEI CORPORATION: OPERATING SEGMENTS
TABLE 134.ASAHI KASEI CORPORATION: PRODUCT PORTFOLIO
TABLE 135.ASAHI KASEI CORPORATION: NET SALES,
TABLE 136.ASAHI KASEI CORPORATION: KEY STRATERGIES
TABLE 137.CHARLES RIVER LABORATORIES INTERNATIONAL, INC.: COMPANY SNAPSHOT
TABLE 138.CHARLES RIVER LABORATORIES INTERNATIONAL, INC.: OPERATING SEGMENTS
TABLE 139.CHARLES RIVER LABORATORIES INTERNATIONAL, INC.: PRODUCT PORTFOLIO
TABLE 140.CHARLES RIVER LABORATORIES INTERNATIONAL, INC.: NET SALES,
TABLE 141.CHARLES RIVER LABORATORIES INTERNATIONAL, INC.: KEY STRATERGIES
TABLE 142.CERUS CORPORATION: COMPANY SNAPSHOT
TABLE 143.CERUS CORPORATION: OPERATING SEGMENTS
TABLE 144.CERUS CORPORATION: PRODUCT PORTFOLIO
TABLE 145.CERUS CORPORATION: NET SALES,
TABLE 146.CERUS CORPORATION: KEY STRATERGIES
TABLE 147.FRESENIUS KABI: COMPANY SNAPSHOT
TABLE 148.FRESENIUS KABI: OPERATING SEGMENTS
TABLE 149.FRESENIUS KABI: PRODUCT PORTFOLIO
TABLE 150.FRESENIUS KABI: NET SALES,
TABLE 151.FRESENIUS KABI: KEY STRATERGIES
TABLE 152.HAEMONETICS CORPORATION: COMPANY SNAPSHOT
TABLE 153.HAEMONETICS CORPORATION: OPERATING SEGMENTS
TABLE 154.HAEMONETICS CORPORATION: PRODUCT PORTFOLIO
TABLE 155.HAEMONETICS CORPORATION: NET SALES,
TABLE 156.HAEMONETICS CORPORATION: KEY STRATERGIES
TABLE 157.MACOPHARMA: COMPANY SNAPSHOT
TABLE 158.MACOPHARMA: OPERATING SEGMENTS
TABLE 159.MACOPHARMA: PRODUCT PORTFOLIO
TABLE 160.MACOPHARMA: NET SALES,
TABLE 161.MACOPHARMA: KEY STRATERGIES
TABLE 162.SB-KAWASUMI LABORATORIES, INC.: COMPANY SNAPSHOT
TABLE 163.SB-KAWASUMI LABORATORIES, INC.: OPERATING SEGMENTS
TABLE 164.SB-KAWASUMI LABORATORIES, INC.: PRODUCT PORTFOLIO
TABLE 165.SB-KAWASUMI LABORATORIES, INC.: NET SALES,
TABLE 166.SB-KAWASUMI LABORATORIES, INC.: KEY STRATERGIES
TABLE 167.TERUMO BCT, INC.: COMPANY SNAPSHOT
TABLE 168.TERUMO BCT, INC.: OPERATING SEGMENTS
TABLE 169.TERUMO BCT, INC.: PRODUCT PORTFOLIO
TABLE 170.TERUMO BCT, INC.: NET SALES,
TABLE 171.TERUMO BCT, INC.: KEY STRATERGIES LIST OF FIGURES
FIGURE 1.LEUKAPHERESIS MARKET SEGMENTATION
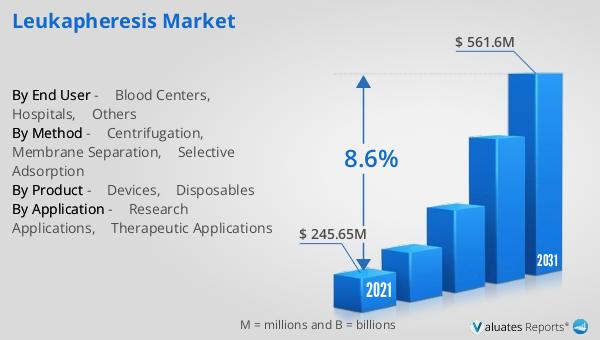
FIGURE 2.LEUKAPHERESIS MARKET,2021-2031
FIGURE 3.LEUKAPHERESIS MARKET,2021-2031
FIGURE 4. TOP INVESTMENT POCKETS, BY REGION
FIGURE 5.PORTER FIVE-1
FIGURE 6.PORTER FIVE-2
FIGURE 7.PORTER FIVE-3
FIGURE 8.PORTER FIVE-4
FIGURE 9.PORTER FIVE-5
FIGURE 10.TOP PLAYER POSITIONING
FIGURE 11.LEUKAPHERESIS MARKET:DRIVERS, RESTRAINTS AND OPPORTUNITIES
FIGURE 12.LEUKAPHERESIS MARKET,BY PRODUCT,2021(%)
FIGURE 13.COMPARATIVE SHARE ANALYSIS OF DEVICES LEUKAPHERESIS MARKET,2021-2031(%)
FIGURE 14.COMPARATIVE SHARE ANALYSIS OF DISPOSABLES LEUKAPHERESIS MARKET,2021-2031(%)
FIGURE 15.LEUKAPHERESIS MARKET,BY METHOD,2021(%)
FIGURE 16.COMPARATIVE SHARE ANALYSIS OF CENTRIFUGATION LEUKAPHERESIS MARKET,2021-2031(%)
FIGURE 17.COMPARATIVE SHARE ANALYSIS OF MEMBRANE SEPARATION LEUKAPHERESIS MARKET,2021-2031(%)
FIGURE 18.COMPARATIVE SHARE ANALYSIS OF SELECTIVE ADSORPTION LEUKAPHERESIS MARKET,2021-2031(%)
FIGURE 19.LEUKAPHERESIS MARKET,BY APPLICATION,2021(%)
FIGURE 20.COMPARATIVE SHARE ANALYSIS OF THERAPEUTIC APPLICATIONS LEUKAPHERESIS MARKET,2021-2031(%)
FIGURE 21.COMPARATIVE SHARE ANALYSIS OF RESEARCH APPLICATIONS LEUKAPHERESIS MARKET,2021-2031(%)
FIGURE 22.LEUKAPHERESIS MARKET,BY END USER,2021(%)
FIGURE 23.COMPARATIVE SHARE ANALYSIS OF BLOOD CENTERS LEUKAPHERESIS MARKET,2021-2031(%)
FIGURE 24.COMPARATIVE SHARE ANALYSIS OF HOSPITALS LEUKAPHERESIS MARKET,2021-2031(%)
FIGURE 25.COMPARATIVE SHARE ANALYSIS OF OTHERS LEUKAPHERESIS MARKET,2021-2031(%)
FIGURE 26.LEUKAPHERESIS MARKET BY REGION,2021
FIGURE 27.U.S. LEUKAPHERESIS MARKET,2021-2031($MILLION)
FIGURE 28.CANADA LEUKAPHERESIS MARKET,2021-2031($MILLION)
FIGURE 29.MEXICO LEUKAPHERESIS MARKET,2021-2031($MILLION)
FIGURE 30.GERMANY LEUKAPHERESIS MARKET,2021-2031($MILLION)
FIGURE 31.FRANCE LEUKAPHERESIS MARKET,2021-2031($MILLION)
FIGURE 32.UK LEUKAPHERESIS MARKET,2021-2031($MILLION)
FIGURE 33.ITALY LEUKAPHERESIS MARKET,2021-2031($MILLION)
FIGURE 34.SPAIN LEUKAPHERESIS MARKET,2021-2031($MILLION)
FIGURE 35.REST OF EUROPE LEUKAPHERESIS MARKET,2021-2031($MILLION)
FIGURE 36.JAPAN LEUKAPHERESIS MARKET,2021-2031($MILLION)
FIGURE 37.CHINA LEUKAPHERESIS MARKET,2021-2031($MILLION)
FIGURE 38.INDIA LEUKAPHERESIS MARKET,2021-2031($MILLION)
FIGURE 39.AUSTRALIA LEUKAPHERESIS MARKET,2021-2031($MILLION)
FIGURE 40.SOUTH KOREA LEUKAPHERESIS MARKET,2021-2031($MILLION)
FIGURE 41.REST OF ASIA-PACIFIC LEUKAPHERESIS MARKET,2021-2031($MILLION)
FIGURE 42.BRAZIL LEUKAPHERESIS MARKET,2021-2031($MILLION)
FIGURE 43.SAUDI ARABIA LEUKAPHERESIS MARKET,2021-2031($MILLION)
FIGURE 44.SOUTH AFRICA LEUKAPHERESIS MARKET,2021-2031($MILLION)
FIGURE 45.REST OF LAMEA LEUKAPHERESIS MARKET,2021-2031($MILLION)
FIGURE 46. TOP WINNING STRATEGIES, BY YEAR
FIGURE 47. TOP WINNING STRATEGIES, BY DEVELOPMENT
FIGURE 48. TOP WINNING STRATEGIES, BY COMPANY
FIGURE 49.PRODUCT MAPPING OF TOP 10 PLAYERS
FIGURE 50.COMPETITIVE DASHBOARD
FIGURE 51.COMPETITIVE HEATMAP OF TOP 10 KEY PLAYERS
FIGURE 52.ADACYTE THERAPEUTICS.: NET SALES ,($MILLION)
FIGURE 53.ALLCELLS, LLC..: NET SALES ,($MILLION)
FIGURE 54.ASAHI KASEI CORPORATION.: NET SALES ,($MILLION)
FIGURE 55.CHARLES RIVER LABORATORIES INTERNATIONAL, INC..: NET SALES ,($MILLION)
FIGURE 56.CERUS CORPORATION.: NET SALES ,($MILLION)
FIGURE 57.FRESENIUS KABI.: NET SALES ,($MILLION)
FIGURE 58.HAEMONETICS CORPORATION.: NET SALES ,($MILLION)
FIGURE 59.MACOPHARMA.: NET SALES ,($MILLION)
FIGURE 60.SB-KAWASUMI LABORATORIES, INC..: NET SALES ,($MILLION)
FIGURE 61.TERUMO BCT, INC..: NET SALES ,($MILLION
SELECT A FORMAT
Added to Cart
Electronic (PDF)

$5730

This license allows only one user to access the PDF.
Electronic (PDF)

$6450

This license allows 1 - 5 user to access the PDF, license is suitable for small groups of 5 users working together
Electronic (PDF)

$9600

This license allows users/teams in a same Enterprise to use this report, various departments within an enterpise can use this report
Electronic (PDF)

$3840

This license just provides quantitative data in a excel sheet
Add to Cart
Buy Now (15% Discount)

OUR CUSTOMER

SIS Group of Schools

SIMILAR REPORTS


RELATED REPORTS

Add to Cart

Medical Humerus Splint - Global Market Share and Ranking, Overall Sales and Demand Forecast 2024-2030

120 Pages
Type: Report
Code: QYRE-Auto-16I14162
Thu May 02 00:00:00 UTC 2024

Add to Cart

Medical Laparoscopic Clips - Global Market Share and Ranking, Overall Sales and Demand Forecast 2024-2030

120 Pages
Type: Report
Code: QYRE-Auto-8S14373
Thu May 02 00:00:00 UTC 2024

Add to Cart

Medical Intestinal Cannula - Global Market Share and Ranking, Overall Sales and Demand Forecast 2024-2030

120 Pages
Type: Report
Code: QYRE-Auto-27G14357
Thu May 02 00:00:00 UTC 2024

Add to Cart