0
U.S. (TOLL FREE)
+1 (315) 215-3225
Automative

0
U.S. (TOLL FREE)
+1 (315) 215-3225
Foam Blowing Agents Market By Applications (Polyurethane, Polystyrene, Polyolefins, Others), By Product Type (Hydrocarbons, Hydrofluorocarbons, Hydrochlorofluorocarbons, OTHERS): Global Opportunity Analysis and Industry Forecast, 2020-2030
Published Date: March 2022
|
Report Code: ALLI-Auto-1I126
Home | Market Reports | Business & Industrial| Chemicals Industry| Plastics & Polymers
Foam Blowing Agents Market by Type Hydrocarbons Hydrofluorocarbons Hydrochlorofluorocarbons and Others Hydrofluoroolefins Methyl Formate Liquid CO2 and Water and by Application Polyurethane Polystyrene Polyolefins and Others Phenolic Foams and Polyvinyl Chloride Global Opportunity Analysis and Industry Forecast 2014 2022
BUY CHAPTERS

Foam Blowing Agents Market By Applications (Polyurethane, Polystyrene, Polyolefins, Others), By Product Type (Hydrocarbons, Hydrofluorocarbons, Hydrochlorofluorocarbons, OTHERS): Global Opportunity Analysis and Industry Forecast, 2020-2030

Code: ALLI-Auto-1I126
Report
March 2022
Pages:179
Allied Market Research
Buy Now with 15% Discount
DESCRIPTION
TABLE OF CONTENT
TABLES & FIGURES

Foam Blowing Agents Market Size

The global foam blowing agents market was valued at $1.2 billion in 2020, and is projected to reach $1.9 billion by 2030, growing at a CAGR of 4.8% from 2021 to 2030.

Foam Blowing Agents Market

Foam Blowing Agents Market

Foam blowing agent is a substance used in the foam blowing process that expands in the matrix and imparts a cell structure to the substrate, enhancing the flexibility, acoustics, and insulation of the final product. Polyurethane foam is one of the most commonly used types of polymer foam and is widely used in various industries such as electronics, flooring, automotive, construction, packaging, and medical equipment. This trend is expected to continue for the foreseeable future, which in turn is anticipated to have a positive impact on the growth of the global foam blowing agent market.
The foam blowing agent market is driven by increased demand for polymer foams, primarily in all industries such as automotive, construction, and consumer electronics. The increased use of foam blowing agents in the manufacturing of polyurethane foams is expected to play a role to promote the growth of the global foam blowing agent market. The medical industry has grown rapidly in recent years, characterized by various technological advances. In addition, rise in world trade has significantly increased the demand for safe and reliable packaging for products that require foam-based polymers for their shock-absorbing properties. Therefore, the booming packaging and medical device industry is expected to drive global market growth during the forecast period. In addition, improved standard of living of people around the world has consistently contributed to the growth of the foam blowing agent end-use industry. Apart from that, the surgein purchasing power parity (PPP) in recent years has contributed to the development of the flooring and furniture industry, which requires polymer foam for shock absorption. Thus, increased adoption of polymeric foams is projected to boost the global market growth.
During the COVID-19 pandemic, the outlook for demand seemed bleak. The contraction occurred mainly in the building &construction sector and the automobile industry. The first two quarters in 2020 had a low demand primarily due to the suspension of all manufacturing and production activities. Eventually, the demand outlook gradually recovered as regulations were relaxed as vaccination campaigns accelerated.
The foam blowing agents market is segmented on the basis of type, application, and region. By type, the market is categorized into hydrocarbons, hydrofluorocarbons, hydrochlorofluorocarbons, and others (that include hydrofluoroolefins, methyl formate, liquid CO2, and water). By applications, the market is fragmented into polyurethane, polystyrene, polyolefin’s, and others (that include phenolic foams and polyvinyl chloride). By region, the market is analyzed across North America, Europe, Asia-Pacific, and LAMEA. Asia-Pacific accounted for more than 45% share of the total revenue in 2020, followed by North America and Europe.The applications of foam blowing agents in the construction and automotive industries such as for building insulation and as sealants for windows &doors drive the foam blowing agents market in North America.
The key players operating in the global foam blowing agents market include Arkema S.A. (France), Honeywell International Inc. (U.S.), Exxon Mobil Corporation (U.S.), E.I. du Pont de Nemours & Company (U.S.), Haltermann GmbH (Germany), Harp International Ltd. (U.K.), Daikin Industries, Ltd. (Japan), Sinochem Group (China), Solvay S.A. (Germany), and ZEON Corporation (Japan).
The other prominent foam blowing agents industry players include Linde AG (Germany), AkzoNobel N.V., Lychem International Co., Limited, BEO International, SPL Group, KSJN Catalyzing Industries, Sunwell Global Ltd., Marubeni Corporation, and Astra Polymers are competing for the share of the market through product launch, joint venture, partnership, and expansion of the production capabilities to meet the future demand for the foam blowing agents market in the forecast period.

Key benefits for stakeholders

This report provides a detailed quantitative analysis of the current foam blowing agents market trends and estimations from 2020 to 2030, which assists to identify the prevailing opportunities.
An in-depth analysis of foam blowing agents market across the globe is anticipated to provide a detailed understanding of the current trends to enable stakeholders formulate specific plans.
A comprehensive analysis of the factors that drive and restrain the growth of the market is provided.
Region-wise and country-wise, market conditions are comprehensively analyzed in this report.
The projections in this report are made by analyzing the current trends and future market potential from 2020 to 2030 in terms of value.
An extensive analysis of various regions provides insights that are expected to allow companies to strategically plan their business moves.
Key market players within the market are profiled in this report and their strategies are analyzed thoroughly, which help to understand the competitive outlook of the global foam blowing agents market.
COVID-19 Impact Analysis:
COVID-19 has severely impacted the global economy with devastating effects on global trade, which has simultaneously affected households, business, financial institution, industrial establishments, and infrastructure companies. The spread of COVID-19 has moderate impact on this market. Suspension of all manufacturing and production activity was majorly responsible for the dim demand prospects during the outbreak of COVID-19 pandemic. The stringent government regulations toward the shutdown of transportation sector have led to increase in difficulty in the procurement of the raw materials. The outbreak of the pandemic has led to the decline in efficiency at the manufacturing sites due to the low labor force

Scope of Foam Blowing Agents Market Report

Report Metric Details
Report Name Foam Blowing Agents Market
Accounted market size in 2020 $ 1.2 in billion
Forecasted market size in 2030 $ 1.9 billion
CAGR 4.8%
Base Year 2020
Forecasted years 2024 - 2030
Forecast units USD million in value
Report coverage Revenue and volume forecast, company share, competitive landscape, growth factors and trends

FAQ for this report

How fast is Foam Blowing Agents Market growing?

Ans: The Foam Blowing Agents Market witnessing a CAGR of 4.8% during the forecast period 2024-2030.

What is the Foam Blowing Agents Market size in 2030?

Ans: The Foam Blowing Agents Market size in 2030 will be $ 1.9 billion.

CHAPTER 1:INTRODUCTION
1.1.Report description
1.2.Key market segments
1.3.Key benefits to the stakeholders
1.4.Research Methodology
1.4.1.Secondary research
1.4.2.Primary research
1.4.3.Analyst tools and models
CHAPTER 2:EXECUTIVE SUMMARY
2.1.Key findings of the study
2.2.CXO Perspective
CHAPTER 3:MARKET OVERVIEW
3.1.Market definition and scope
3.2.Key findings
3.2.1.Top investment pockets
3.3.Porter’s five forces analysis
3.4.Top player positioning
3.5.Market dynamics
3.5.1.Drivers
3.5.2.Restraints
3.5.3.Opportunities
3.6.COVID-19 Impact Analysis on the market
3.7.Pricing Analysis
3.8.Value Chain Analysis
3.9.Key Regulation Analysis
CHAPTER 4: FOAM BLOWING AGENTS MARKET, BY BY APPLICATIONS
4.1 Overview
4.1.1 Market size and forecast
4.2 Polyurethane
4.2.1 Key market trends, growth factors and opportunities
4.2.2 Market size and forecast, by region
4.2.3 Market analysis by country
4.3 Polystyrene
4.3.1 Key market trends, growth factors and opportunities
4.3.2 Market size and forecast, by region
4.3.3 Market analysis by country
4.4 Polyolefins
4.4.1 Key market trends, growth factors and opportunities
4.4.2 Market size and forecast, by region
4.4.3 Market analysis by country
4.5 Others
4.5.1 Key market trends, growth factors and opportunities
4.5.2 Market size and forecast, by region
4.5.3 Market analysis by country
CHAPTER 5: FOAM BLOWING AGENTS MARKET, BY BY PRODUCT TYPE
5.1 Overview
5.1.1 Market size and forecast
5.2 Hydrocarbons
5.2.1 Key market trends, growth factors and opportunities
5.2.2 Market size and forecast, by region
5.2.3 Market analysis by country
5.3 Hydrofluorocarbons
5.3.1 Key market trends, growth factors and opportunities
5.3.2 Market size and forecast, by region
5.3.3 Market analysis by country
5.4 Hydrochlorofluorocarbons
5.4.1 Key market trends, growth factors and opportunities
5.4.2 Market size and forecast, by region
5.4.3 Market analysis by country
5.5 OTHERS
5.5.1 Key market trends, growth factors and opportunities
5.5.2 Market size and forecast, by region
5.5.3 Market analysis by country
CHAPTER 6: FOAM BLOWING AGENTS MARKET, BY REGION
6.1 Overview
6.1.1 Market size and forecast
6.2 North America
6.2.1 Key trends and opportunities
6.2.2 North America Market size and forecast, by By Applications
6.2.3 North America Market size and forecast, by By Product Type
6.2.4 North America Market size and forecast, by country
6.2.4.1 U.S.
6.2.4.1.1 Market size and forecast, by By Applications
6.2.4.1.2 Market size and forecast, by By Product Type
6.2.4.2 Canada
6.2.4.2.1 Market size and forecast, by By Applications
6.2.4.2.2 Market size and forecast, by By Product Type
6.2.4.3 Mexico
6.2.4.3.1 Market size and forecast, by By Applications
6.2.4.3.2 Market size and forecast, by By Product Type
6.3 Europe
6.3.1 Key trends and opportunities
6.3.2 Europe Market size and forecast, by By Applications
6.3.3 Europe Market size and forecast, by By Product Type
6.3.4 Europe Market size and forecast, by country
6.3.4.1 Germany
6.3.4.1.1 Market size and forecast, by By Applications
6.3.4.1.2 Market size and forecast, by By Product Type
6.3.4.2 Ukraine
6.3.4.2.1 Market size and forecast, by By Applications
6.3.4.2.2 Market size and forecast, by By Product Type
6.3.4.3 France
6.3.4.3.1 Market size and forecast, by By Applications
6.3.4.3.2 Market size and forecast, by By Product Type
6.3.4.4 Italy
6.3.4.4.1 Market size and forecast, by By Applications
6.3.4.4.2 Market size and forecast, by By Product Type
6.3.4.5 Spain
6.3.4.5.1 Market size and forecast, by By Applications
6.3.4.5.2 Market size and forecast, by By Product Type
6.3.4.6 Rest of Europe
6.3.4.6.1 Market size and forecast, by By Applications
6.3.4.6.2 Market size and forecast, by By Product Type
6.4 Asia-Pacific
6.4.1 Key trends and opportunities
6.4.2 Asia-Pacific Market size and forecast, by By Applications
6.4.3 Asia-Pacific Market size and forecast, by By Product Type
6.4.4 Asia-Pacific Market size and forecast, by country
6.4.4.1 China
6.4.4.1.1 Market size and forecast, by By Applications
6.4.4.1.2 Market size and forecast, by By Product Type
6.4.4.2 Japan
6.4.4.2.1 Market size and forecast, by By Applications
6.4.4.2.2 Market size and forecast, by By Product Type
6.4.4.3 India
6.4.4.3.1 Market size and forecast, by By Applications
6.4.4.3.2 Market size and forecast, by By Product Type
6.4.4.4 South Korea
6.4.4.4.1 Market size and forecast, by By Applications
6.4.4.4.2 Market size and forecast, by By Product Type
6.4.4.5 Rest Of Asia Pacific
6.4.4.5.1 Market size and forecast, by By Applications
6.4.4.5.2 Market size and forecast, by By Product Type
6.5 LAMEA
6.5.1 Key trends and opportunities
6.5.2 LAMEA Market size and forecast, by By Applications
6.5.3 LAMEA Market size and forecast, by By Product Type
6.5.4 LAMEA Market size and forecast, by country
6.5.4.1 Latin America
6.5.4.1.1 Market size and forecast, by By Applications
6.5.4.1.2 Market size and forecast, by By Product Type
6.5.4.2 Middle East
6.5.4.2.1 Market size and forecast, by By Applications
6.5.4.2.2 Market size and forecast, by By Product Type
6.5.4.3 Africa
6.5.4.3.1 Market size and forecast, by By Applications
6.5.4.3.2 Market size and forecast, by By Product Type
CHAPTER 7: COMPANY LANDSCAPE
7.1. Introduction
7.2. Top winning strategies
7.3. Product Mapping of Top 10 Player
7.4. Competitive Dashboard
7.5. Competitive Heatmap
7.6. Key developments
CHAPTER 8: COMPANY PROFILES
8.1 ARKEMA S.A. (FRANCE)
8.1.1 Company overview
8.1.2 Company snapshot
8.1.3 Operating business segments
8.1.4 Product portfolio
8.1.5 Business performance
8.1.6 Key strategic moves and developments
8.2 HONEYWELL INTERNATIONAL INC. (U.S.)
8.2.1 Company overview
8.2.2 Company snapshot
8.2.3 Operating business segments
8.2.4 Product portfolio
8.2.5 Business performance
8.2.6 Key strategic moves and developments
8.3 EXXON MOBIL CORPORATION (U.S.)
8.3.1 Company overview
8.3.2 Company snapshot
8.3.3 Operating business segments
8.3.4 Product portfolio
8.3.5 Business performance
8.3.6 Key strategic moves and developments
8.4 E.I. DU PONT DE NEMOURS & COMPANY (U.S.)
8.4.1 Company overview
8.4.2 Company snapshot
8.4.3 Operating business segments
8.4.4 Product portfolio
8.4.5 Business performance
8.4.6 Key strategic moves and developments
8.5 HALTERMANN GMBH (GERMANY)
8.5.1 Company overview
8.5.2 Company snapshot
8.5.3 Operating business segments
8.5.4 Product portfolio
8.5.5 Business performance
8.5.6 Key strategic moves and developments
8.6 HARP INTERNATIONAL LTD. (U.K.)
8.6.1 Company overview
8.6.2 Company snapshot
8.6.3 Operating business segments
8.6.4 Product portfolio
8.6.5 Business performance
8.6.6 Key strategic moves and developments
8.7 DAIKIN INDUSTRIES
8.7.1 Company overview
8.7.2 Company snapshot
8.7.3 Operating business segments
8.7.4 Product portfolio
8.7.5 Business performance
8.7.6 Key strategic moves and developments
8.8 LTD. (JAPAN)
8.8.1 Company overview
8.8.2 Company snapshot
8.8.3 Operating business segments
8.8.4 Product portfolio
8.8.5 Business performance
8.8.6 Key strategic moves and developments
8.9 SINOCHEM GROUP (CHINA)
8.9.1 Company overview
8.9.2 Company snapshot
8.9.3 Operating business segments
8.9.4 Product portfolio
8.9.5 Business performance
8.9.6 Key strategic moves and developments
8.10 SOLVAY S.A. (GERMANY)
8.10.1 Company overview
8.10.2 Company snapshot
8.10.3 Operating business segments
8.10.4 Product portfolio
8.10.5 Business performance
8.10.6 Key strategic moves and developments
8.11 ZEON CORPORATION (JAPAN)
8.11.1 Company overview
8.11.2 Company snapshot
8.11.3 Operating business segments
8.11.4 Product portfolio
8.11.5 Business performance
8.11.6 Key strategic moves and developments
8.12 LTD. (JAPAN)
8.12.1 Company overview
8.12.2 Company snapshot
8.12.3 Operating business segments
8.12.4 Product portfolio
8.12.5 Business performance
8.12.6 Key strategic moves and development
LIST OF TABLES
TABLE 1. GLOBAL FOAM BLOWING AGENTS MARKET, BY BY APPLICATIONS, 2020-2030,($MILLION)
TABLE 2. FOAM BLOWING AGENTS MARKET REVENUE, FOR POLYURETHANE, BY REGION , 2020-2030,($MILLION)
TABLE 3. FOAM BLOWING AGENTS MARKET POLYURETHANE BY COUNTRY, 2020-2030,($MILLION)
TABLE 4. FOAM BLOWING AGENTS MARKET REVENUE, FOR POLYSTYRENE, BY REGION , 2020-2030,($MILLION)
TABLE 5. FOAM BLOWING AGENTS MARKET POLYSTYRENE BY COUNTRY, 2020-2030,($MILLION)
TABLE 6. FOAM BLOWING AGENTS MARKET REVENUE, FOR POLYOLEFINS, BY REGION , 2020-2030,($MILLION)
TABLE 7. FOAM BLOWING AGENTS MARKET POLYOLEFINS BY COUNTRY, 2020-2030,($MILLION)
TABLE 8. FOAM BLOWING AGENTS MARKET REVENUE, FOR OTHERS, BY REGION , 2020-2030,($MILLION)
TABLE 9. FOAM BLOWING AGENTS MARKET OTHERS BY COUNTRY, 2020-2030,($MILLION)
TABLE 10. GLOBAL FOAM BLOWING AGENTS MARKET, BY BY PRODUCT TYPE, 2020-2030,($MILLION)
TABLE 11. FOAM BLOWING AGENTS MARKET REVENUE, FOR HYDROCARBONS, BY REGION , 2020-2030,($MILLION)
TABLE 12. FOAM BLOWING AGENTS MARKET HYDROCARBONS BY COUNTRY, 2020-2030,($MILLION)
TABLE 13. FOAM BLOWING AGENTS MARKET REVENUE, FOR HYDROFLUOROCARBONS, BY REGION , 2020-2030,($MILLION)
TABLE 14. FOAM BLOWING AGENTS MARKET HYDROFLUOROCARBONS BY COUNTRY, 2020-2030,($MILLION)
TABLE 15. FOAM BLOWING AGENTS MARKET REVENUE, FOR HYDROCHLOROFLUOROCARBONS, BY REGION , 2020-2030,($MILLION)
TABLE 16. FOAM BLOWING AGENTS MARKET HYDROCHLOROFLUOROCARBONS BY COUNTRY, 2020-2030,($MILLION)
TABLE 17. FOAM BLOWING AGENTS MARKET REVENUE, FOR OTHERS, BY REGION , 2020-2030,($MILLION)
TABLE 18. FOAM BLOWING AGENTS MARKET OTHERS BY COUNTRY, 2020-2030,($MILLION)
TABLE 19. FOAM BLOWING AGENTS MARKET, BY REGION, 2020-2030,($MILLION)
TABLE 20. NORTH AMERICA FOAM BLOWING AGENTS MARKET, BY BY APPLICATIONS, 2020-2030,($MILLION)
TABLE 21. NORTH AMERICA FOAM BLOWING AGENTS MARKET, BY BY PRODUCT TYPE, 2020-2030,($MILLION)
TABLE 22. NORTH AMERICA FOAM BLOWING AGENTS MARKET, BY COUNTRY, 2020-2030,($MILLION)
TABLE 23. U.S. FOAM BLOWING AGENTS MARKET BY BY APPLICATIONS 2020-2030,($MILLION)
TABLE 24. U.S. FOAM BLOWING AGENTS MARKET BY BY PRODUCT TYPE 2020-2030,($MILLION)
TABLE 25. CANADA FOAM BLOWING AGENTS MARKET BY BY APPLICATIONS 2020-2030,($MILLION)
TABLE 26. CANADA FOAM BLOWING AGENTS MARKET BY BY PRODUCT TYPE 2020-2030,($MILLION)
TABLE 27. MEXICO FOAM BLOWING AGENTS MARKET BY BY APPLICATIONS 2020-2030,($MILLION)
TABLE 28. MEXICO FOAM BLOWING AGENTS MARKET BY BY PRODUCT TYPE 2020-2030,($MILLION)
TABLE 29. EUROPE FOAM BLOWING AGENTS MARKET, BY BY APPLICATIONS, 2020-2030,($MILLION)
TABLE 30. EUROPE FOAM BLOWING AGENTS MARKET, BY BY PRODUCT TYPE, 2020-2030,($MILLION)
TABLE 31. EUROPE FOAM BLOWING AGENTS MARKET, BY COUNTRY, 2020-2030,($MILLION)
TABLE 32. GERMANY FOAM BLOWING AGENTS MARKET BY BY APPLICATIONS 2020-2030,($MILLION)
TABLE 33. GERMANY FOAM BLOWING AGENTS MARKET BY BY PRODUCT TYPE 2020-2030,($MILLION)
TABLE 34. UKRAINE FOAM BLOWING AGENTS MARKET BY BY APPLICATIONS 2020-2030,($MILLION)
TABLE 35. UKRAINE FOAM BLOWING AGENTS MARKET BY BY PRODUCT TYPE 2020-2030,($MILLION)
TABLE 36. FRANCE FOAM BLOWING AGENTS MARKET BY BY APPLICATIONS 2020-2030,($MILLION)
TABLE 37. FRANCE FOAM BLOWING AGENTS MARKET BY BY PRODUCT TYPE 2020-2030,($MILLION)
TABLE 38. ITALY FOAM BLOWING AGENTS MARKET BY BY APPLICATIONS 2020-2030,($MILLION)
TABLE 39. ITALY FOAM BLOWING AGENTS MARKET BY BY PRODUCT TYPE 2020-2030,($MILLION)
TABLE 40. SPAIN FOAM BLOWING AGENTS MARKET BY BY APPLICATIONS 2020-2030,($MILLION)
TABLE 41. SPAIN FOAM BLOWING AGENTS MARKET BY BY PRODUCT TYPE 2020-2030,($MILLION)
TABLE 42. REST OF EUROPE FOAM BLOWING AGENTS MARKET BY BY APPLICATIONS 2020-2030,($MILLION)
TABLE 43. REST OF EUROPE FOAM BLOWING AGENTS MARKET BY BY PRODUCT TYPE 2020-2030,($MILLION)
TABLE 44. ASIA-PACIFIC FOAM BLOWING AGENTS MARKET, BY BY APPLICATIONS, 2020-2030,($MILLION)
TABLE 45. ASIA-PACIFIC FOAM BLOWING AGENTS MARKET, BY BY PRODUCT TYPE, 2020-2030,($MILLION)
TABLE 46. ASIA-PACIFIC FOAM BLOWING AGENTS MARKET, BY COUNTRY, 2020-2030,($MILLION)
TABLE 47. CHINA FOAM BLOWING AGENTS MARKET BY BY APPLICATIONS 2020-2030,($MILLION)
TABLE 48. CHINA FOAM BLOWING AGENTS MARKET BY BY PRODUCT TYPE 2020-2030,($MILLION)
TABLE 49. JAPAN FOAM BLOWING AGENTS MARKET BY BY APPLICATIONS 2020-2030,($MILLION)
TABLE 50. JAPAN FOAM BLOWING AGENTS MARKET BY BY PRODUCT TYPE 2020-2030,($MILLION)
TABLE 51. INDIA FOAM BLOWING AGENTS MARKET BY BY APPLICATIONS 2020-2030,($MILLION)
TABLE 52. INDIA FOAM BLOWING AGENTS MARKET BY BY PRODUCT TYPE 2020-2030,($MILLION)
TABLE 53. SOUTH KOREA FOAM BLOWING AGENTS MARKET BY BY APPLICATIONS 2020-2030,($MILLION)
TABLE 54. SOUTH KOREA FOAM BLOWING AGENTS MARKET BY BY PRODUCT TYPE 2020-2030,($MILLION)
TABLE 55. REST OF ASIA PACIFIC FOAM BLOWING AGENTS MARKET BY BY APPLICATIONS 2020-2030,($MILLION)
TABLE 56. REST OF ASIA PACIFIC FOAM BLOWING AGENTS MARKET BY BY PRODUCT TYPE 2020-2030,($MILLION)
TABLE 57. LAMEA FOAM BLOWING AGENTS MARKET, BY BY APPLICATIONS, 2020-2030,($MILLION)
TABLE 58. LAMEA FOAM BLOWING AGENTS MARKET, BY BY PRODUCT TYPE, 2020-2030,($MILLION)
TABLE 59. LAMEA FOAM BLOWING AGENTS MARKET, BY COUNTRY, 2020-2030,($MILLION)
TABLE 60. LATIN AMERICA FOAM BLOWING AGENTS MARKET BY BY APPLICATIONS 2020-2030,($MILLION)
TABLE 61. LATIN AMERICA FOAM BLOWING AGENTS MARKET BY BY PRODUCT TYPE 2020-2030,($MILLION)
TABLE 62. MIDDLE EAST FOAM BLOWING AGENTS MARKET BY BY APPLICATIONS 2020-2030,($MILLION)
TABLE 63. MIDDLE EAST FOAM BLOWING AGENTS MARKET BY BY PRODUCT TYPE 2020-2030,($MILLION)
TABLE 64. AFRICA FOAM BLOWING AGENTS MARKET BY BY APPLICATIONS 2020-2030,($MILLION)
TABLE 65. AFRICA FOAM BLOWING AGENTS MARKET BY BY PRODUCT TYPE 2020-2030,($MILLION)
TABLE 66.ARKEMA S.A. (FRANCE): COMPANY SNAPSHOT
TABLE 67.ARKEMA S.A. (FRANCE): OPERATING SEGMENTS
TABLE 68.ARKEMA S.A. (FRANCE): PRODUCT PORTFOLIO
TABLE 69.ARKEMA S.A. (FRANCE): NET SALES,
TABLE 70.ARKEMA S.A. (FRANCE): KEY STRATERGIES
TABLE 71.HONEYWELL INTERNATIONAL INC. (U.S.): COMPANY SNAPSHOT
TABLE 72.HONEYWELL INTERNATIONAL INC. (U.S.): OPERATING SEGMENTS
TABLE 73.HONEYWELL INTERNATIONAL INC. (U.S.): PRODUCT PORTFOLIO
TABLE 74.HONEYWELL INTERNATIONAL INC. (U.S.): NET SALES,
TABLE 75.HONEYWELL INTERNATIONAL INC. (U.S.): KEY STRATERGIES
TABLE 76.EXXON MOBIL CORPORATION (U.S.): COMPANY SNAPSHOT
TABLE 77.EXXON MOBIL CORPORATION (U.S.): OPERATING SEGMENTS
TABLE 78.EXXON MOBIL CORPORATION (U.S.): PRODUCT PORTFOLIO
TABLE 79.EXXON MOBIL CORPORATION (U.S.): NET SALES,
TABLE 80.EXXON MOBIL CORPORATION (U.S.): KEY STRATERGIES
TABLE 81.E.I. DU PONT DE NEMOURS & COMPANY (U.S.): COMPANY SNAPSHOT
TABLE 82.E.I. DU PONT DE NEMOURS & COMPANY (U.S.): OPERATING SEGMENTS
TABLE 83.E.I. DU PONT DE NEMOURS & COMPANY (U.S.): PRODUCT PORTFOLIO
TABLE 84.E.I. DU PONT DE NEMOURS & COMPANY (U.S.): NET SALES,
TABLE 85.E.I. DU PONT DE NEMOURS & COMPANY (U.S.): KEY STRATERGIES
TABLE 86.HALTERMANN GMBH (GERMANY): COMPANY SNAPSHOT
TABLE 87.HALTERMANN GMBH (GERMANY): OPERATING SEGMENTS
TABLE 88.HALTERMANN GMBH (GERMANY): PRODUCT PORTFOLIO
TABLE 89.HALTERMANN GMBH (GERMANY): NET SALES,
TABLE 90.HALTERMANN GMBH (GERMANY): KEY STRATERGIES
TABLE 91.HARP INTERNATIONAL LTD. (U.K.): COMPANY SNAPSHOT
TABLE 92.HARP INTERNATIONAL LTD. (U.K.): OPERATING SEGMENTS
TABLE 93.HARP INTERNATIONAL LTD. (U.K.): PRODUCT PORTFOLIO
TABLE 94.HARP INTERNATIONAL LTD. (U.K.): NET SALES,
TABLE 95.HARP INTERNATIONAL LTD. (U.K.): KEY STRATERGIES
TABLE 96.DAIKIN INDUSTRIES: COMPANY SNAPSHOT
TABLE 97.DAIKIN INDUSTRIES: OPERATING SEGMENTS
TABLE 98.DAIKIN INDUSTRIES: PRODUCT PORTFOLIO
TABLE 99.DAIKIN INDUSTRIES: NET SALES,
TABLE 100.DAIKIN INDUSTRIES: KEY STRATERGIES
TABLE 101. LTD. (JAPAN): COMPANY SNAPSHOT
TABLE 102. LTD. (JAPAN): OPERATING SEGMENTS
TABLE 103. LTD. (JAPAN): PRODUCT PORTFOLIO
TABLE 104. LTD. (JAPAN): NET SALES,
TABLE 105. LTD. (JAPAN): KEY STRATERGIES
TABLE 106.SINOCHEM GROUP (CHINA): COMPANY SNAPSHOT
TABLE 107.SINOCHEM GROUP (CHINA): OPERATING SEGMENTS
TABLE 108.SINOCHEM GROUP (CHINA): PRODUCT PORTFOLIO
TABLE 109.SINOCHEM GROUP (CHINA): NET SALES,
TABLE 110.SINOCHEM GROUP (CHINA): KEY STRATERGIES
TABLE 111.SOLVAY S.A. (GERMANY): COMPANY SNAPSHOT
TABLE 112.SOLVAY S.A. (GERMANY): OPERATING SEGMENTS
TABLE 113.SOLVAY S.A. (GERMANY): PRODUCT PORTFOLIO
TABLE 114.SOLVAY S.A. (GERMANY): NET SALES,
TABLE 115.SOLVAY S.A. (GERMANY): KEY STRATERGIES
TABLE 116.ZEON CORPORATION (JAPAN): COMPANY SNAPSHOT
TABLE 117.ZEON CORPORATION (JAPAN): OPERATING SEGMENTS
TABLE 118.ZEON CORPORATION (JAPAN): PRODUCT PORTFOLIO
TABLE 119.ZEON CORPORATION (JAPAN): NET SALES,
TABLE 120.ZEON CORPORATION (JAPAN): KEY STRATERGIES
TABLE 121.LTD. (JAPAN): COMPANY SNAPSHOT
TABLE 122.LTD. (JAPAN): OPERATING SEGMENTS
TABLE 123.LTD. (JAPAN): PRODUCT PORTFOLIO
TABLE 124.LTD. (JAPAN): NET SALES,
TABLE 125.LTD. (JAPAN): KEY STRATERGIES LIST OF FIGURES
FIGURE 1.FOAM BLOWING AGENTS MARKET SEGMENTATION
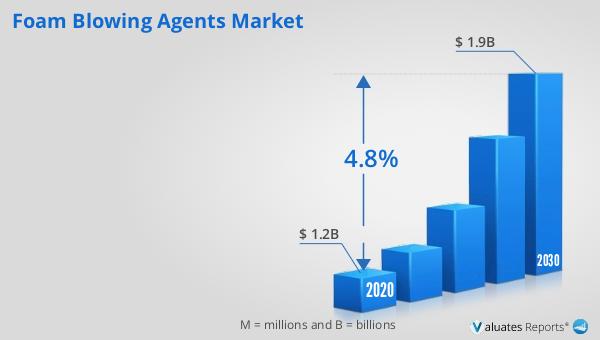
FIGURE 2.FOAM BLOWING AGENTS MARKET,2020-2030
FIGURE 3.FOAM BLOWING AGENTS MARKET,2020-2030
FIGURE 4. TOP INVESTMENT POCKETS, BY REGION
FIGURE 5.PORTER FIVE-1
FIGURE 6.PORTER FIVE-2
FIGURE 7.PORTER FIVE-3
FIGURE 8.PORTER FIVE-4
FIGURE 9.PORTER FIVE-5
FIGURE 10.TOP PLAYER POSITIONING
FIGURE 11.FOAM BLOWING AGENTS MARKET:DRIVERS, RESTRAINTS AND OPPORTUNITIES
FIGURE 12.VALUE CHAIN ANALYSIS
FIGURE 13.FOAM BLOWING AGENTS MARKET,BY BY APPLICATIONS,2020(%)
FIGURE 14.COMPARATIVE SHARE ANALYSIS OF POLYURETHANE FOAM BLOWING AGENTS MARKET,2020-2030(%)
FIGURE 15.COMPARATIVE SHARE ANALYSIS OF POLYSTYRENE FOAM BLOWING AGENTS MARKET,2020-2030(%)
FIGURE 16.COMPARATIVE SHARE ANALYSIS OF POLYOLEFINS FOAM BLOWING AGENTS MARKET,2020-2030(%)
FIGURE 17.COMPARATIVE SHARE ANALYSIS OF OTHERS FOAM BLOWING AGENTS MARKET,2020-2030(%)
FIGURE 18.FOAM BLOWING AGENTS MARKET,BY BY PRODUCT TYPE,2020(%)
FIGURE 19.COMPARATIVE SHARE ANALYSIS OF HYDROCARBONS FOAM BLOWING AGENTS MARKET,2020-2030(%)
FIGURE 20.COMPARATIVE SHARE ANALYSIS OF HYDROFLUOROCARBONS FOAM BLOWING AGENTS MARKET,2020-2030(%)
FIGURE 21.COMPARATIVE SHARE ANALYSIS OF HYDROCHLOROFLUOROCARBONS FOAM BLOWING AGENTS MARKET,2020-2030(%)
FIGURE 22.COMPARATIVE SHARE ANALYSIS OF OTHERS FOAM BLOWING AGENTS MARKET,2020-2030(%)
FIGURE 23.FOAM BLOWING AGENTS MARKET BY REGION,2020
FIGURE 24.U.S. FOAM BLOWING AGENTS MARKET,2020-2030($MILLION)
FIGURE 25.CANADA FOAM BLOWING AGENTS MARKET,2020-2030($MILLION)
FIGURE 26.MEXICO FOAM BLOWING AGENTS MARKET,2020-2030($MILLION)
FIGURE 27.GERMANY FOAM BLOWING AGENTS MARKET,2020-2030($MILLION)
FIGURE 28.UKRAINE FOAM BLOWING AGENTS MARKET,2020-2030($MILLION)
FIGURE 29.FRANCE FOAM BLOWING AGENTS MARKET,2020-2030($MILLION)
FIGURE 30.ITALY FOAM BLOWING AGENTS MARKET,2020-2030($MILLION)
FIGURE 31.SPAIN FOAM BLOWING AGENTS MARKET,2020-2030($MILLION)
FIGURE 32.REST OF EUROPE FOAM BLOWING AGENTS MARKET,2020-2030($MILLION)
FIGURE 33.CHINA FOAM BLOWING AGENTS MARKET,2020-2030($MILLION)
FIGURE 34.JAPAN FOAM BLOWING AGENTS MARKET,2020-2030($MILLION)
FIGURE 35.INDIA FOAM BLOWING AGENTS MARKET,2020-2030($MILLION)
FIGURE 36.SOUTH KOREA FOAM BLOWING AGENTS MARKET,2020-2030($MILLION)
FIGURE 37.REST OF ASIA PACIFIC FOAM BLOWING AGENTS MARKET,2020-2030($MILLION)
FIGURE 38.LATIN AMERICA FOAM BLOWING AGENTS MARKET,2020-2030($MILLION)
FIGURE 39.MIDDLE EAST FOAM BLOWING AGENTS MARKET,2020-2030($MILLION)
FIGURE 40.AFRICA FOAM BLOWING AGENTS MARKET,2020-2030($MILLION)
FIGURE 41. TOP WINNING STRATEGIES, BY YEAR
FIGURE 42. TOP WINNING STRATEGIES, BY DEVELOPMENT
FIGURE 43. TOP WINNING STRATEGIES, BY COMPANY
FIGURE 44.PRODUCT MAPPING OF TOP 10 PLAYERS
FIGURE 45.COMPETITIVE DASHBOARD
FIGURE 46.COMPETITIVE HEATMAP OF TOP 10 KEY PLAYERS
FIGURE 47.ARKEMA S.A. (FRANCE).: NET SALES ,($MILLION)
FIGURE 48.HONEYWELL INTERNATIONAL INC. (U.S.).: NET SALES ,($MILLION)
FIGURE 49.EXXON MOBIL CORPORATION (U.S.).: NET SALES ,($MILLION)
FIGURE 50.E.I. DU PONT DE NEMOURS & COMPANY (U.S.).: NET SALES ,($MILLION)
FIGURE 51.HALTERMANN GMBH (GERMANY).: NET SALES ,($MILLION)
FIGURE 52.HARP INTERNATIONAL LTD. (U.K.).: NET SALES ,($MILLION)
FIGURE 53.DAIKIN INDUSTRIES.: NET SALES ,($MILLION)
FIGURE 54. LTD. (JAPAN).: NET SALES ,($MILLION)
FIGURE 55.SINOCHEM GROUP (CHINA).: NET SALES ,($MILLION)
FIGURE 56.SOLVAY S.A. (GERMANY).: NET SALES ,($MILLION)
FIGURE 57.ZEON CORPORATION (JAPAN).: NET SALES ,($MILLION)
FIGURE 58.LTD. (JAPAN).: NET SALES ,($MILLION
SELECT A FORMAT
Added to Cart
Electronic (PDF)

$5398

This license allows only one user to access the PDF.
Electronic (PDF)

$6450

This license allows 1 - 5 user to access the PDF, license is suitable for small groups of 5 users working together
Electronic (PDF)

$10995

This license allows users/teams in a same Enterprise to use this report, various departments within an enterpise can use this report
Electronic (PDF)

$3840

This license just provides quantitative data in a excel sheet
Add to Cart
Buy Now (15% Discount)

OUR CUSTOMER

Leap India

SIMILAR REPORTS


RELATED REPORTS

Global Resorcinol Formaldehyde Adhesive Resin Market Research Report 2025

120 Pages
Type: Report
Code: QYRE-Auto-19T20220
Wed Dec 03 00:00:00 UTC 2025

Add to Cart

Global Tall Oil Modified Phenolic Resin Market Research Report 2025

120 Pages
Type: Report
Code: QYRE-Auto-5A20121
Wed Dec 03 00:00:00 UTC 2025

Add to Cart

Global Engineering Plastics Core-Shell Toughening Agents Market Research Report 2025

120 Pages
Type: Report
Code: QYRE-Auto-37L20106
Wed Dec 03 00:00:00 UTC 2025

Add to Cart

Global Maleic Anhydride-Acrylic Acid Copolymer Market Research Report 2025

120 Pages
Type: Report
Code: QYRE-Auto-12I20204
Wed Dec 03 00:00:00 UTC 2025

Add to Cart