
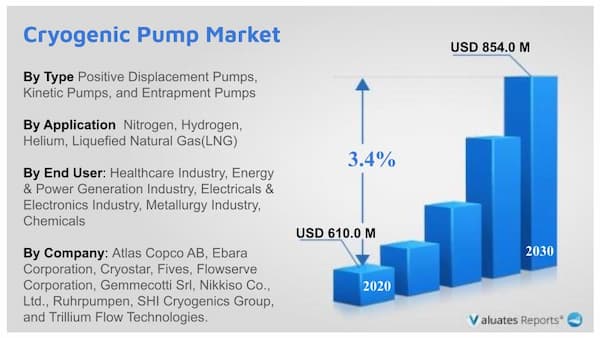
The global cryogenic pump market size was valued at $610.0 million in 2020, and is projected to reach $854.0 million by 2030, growing at a CAGR of 3.4% from 2020 to 2030. A cryogenic pump is an accumulating type vacuum pump.
The pump condenses and adsorbs gases on a cryogenic surface installed in pump to develop a condition from high vacuum to ultra-high vacuum. In addition, this pump can obtain clean vacuum, which is not contaminated by oil and has higher pumping speed compared to other vacuum pumps.
Moreover, cryogenic pumps are essential tools to power-up several processes involving pure and mixed industrial gases. Cryogenic pumps can be integrated into complex skid systems, which can be customized according to specific needs, including LNG marine, LNG automotive & industrial, and industrial gases. Cryogenic pumps are used in wide applications of semiconductors, liquid crystals, disks, eyeglass lenses, and extra-large space vacuum chamber.
Moreover, cryogenic pumps are used to circulate coolant in variety of applications, including cooling high temperature superconducting cables or magnets, for cooling synchrotron beamline crystals, and as pumps in prototype slush hydrogen applications.
Increase in demand for cryogenic pumps across multiple end-use industries, including power generation and healthcare is one of the prime factors that drives the growth of the global market. Moreover, complex industrial processes incorporate the use of liquid gases, thus fueling the demand for cryogenic pumps at a rapid pace. In addition, increase in demand for energy and power is expected to drive the overall demand for LNG, thus arrangements to handle its transportation boosts the cryogenic pump market growth. Furthermore, increase in usage of cryogenic pumps to extract the regenerated energy from exhaust gases of an engine and rise in demand for efficient transportation of medical gases are some other aspects expected to supplement the market growth during the forecast period. However, fluctuation in steel production hampers the growth of the market.
The global cryogenic pump market forecast is segmented on the basis of type, application, and end-use industry. According to type, it is classified into positive displacement pumps, kinetic pumps, and entrapment pumps. Depending on application, it is categorized into nitrogen, hydrogen, helium, LNG, and Others. As per end-use industry, it is fragmented into healthcare industry, energy & power generation industry, electricals & electronics industry, metallurgy industry, chemicals, and others. Region wise, it is analyzed across North America, Europe, Asia-Pacific, and LAMEA.
The key players profiled in cryogenic pump industry are Atlas Copco AB, Ebara Corporation, Cryostar, Fives, Flowserve Corporation, Gemmecotti Srl, Nikkiso Co., Ltd., Ruhrpumpen, SHI Cryogenics Group, and Trillium Flow Technologies.
According to type, the kinetic pump segment dominated the global cryogenic pump market in 2020, and is projected to remain the fastest-growing segment during the forecast period. This is attributed to increase in demand for efficient transportation of gases across several end-use industries.
As per application, the LNG segment dominated the global cryogenic pump market in 2020, and is projected to remain the fastest-growing segment during the forecast period. This is attributed due to rise in R&D activities in oil & gas and increase in demand for LNG.
By End-use Industry, the energy & power segment dominated the global cryogenic pump market in 2020, and is projected to remain the fastest-growing segment during the forecast period. This is attributed to increase in demand for electricity across the globe.
Region wise, North America dominated the global cryogenic pump market in 2020, and is projected to remain fastest-growing segment during the forecast period. This is attributed to numerous factors, including large proved reserves and onshore area.
| Report Metric | Details |
| Report Name | Cryogenic Pump Market |
| Segment by Type |
|
| Segment by Application |
|
| Segment by End Use Industry |
|
| Production by Region |
|
| Consumption by Region |
|
| By Company | Atlas Copco AB, Ebara Corporation, Cryostar, Fives, Flowserve Corporation, Gemmecotti Srl, Nikkiso Co., Ltd., Ruhrpumpen, SHI Cryogenics Group, and Trillium Flow Technologies. |
| Forecast units | USD million in value |
| Report coverage | Revenue and volume forecast, company share, competitive landscape, growth factors and trends |
List of Tables
TABLE 01.GLOBAL CRYOGENIC PUMP SYSTEM, BY TYPE, 2020–2030 ($MILLION)
TABLE 02.GLOBAL CRYOGENIC PUMP SYSTEM, BY APPLICATION 2020–2030 ($MILLION)
TABLE 03.GLOBAL CRYOGENIC PUMP SYSTEM, BY END-USER 2020–2030 ($MILLION)
TABLE 04.NORTH AMERICA CRYOGENIC PUMP SYSTEM MARKET, BY REGION 2020–2030 ($MILLION)
TABLE 05.NORTH AMERICA CRYOGENIC PUMP SYSTEM, BY TYPE, 2020–2030 ($MILLION)
TABLE 06.NORTH AMERICA CRYOGENIC PUMP SYSTEM, BY APPLICATION 2020–2030 ($MILLION)
TABLE 07.NORTH AMERICA CRYOGENIC PUMP SYSTEM, BY END-USER 2020–2030 ($MILLION)
TABLE 08.NORTH AMERICA CRYOGENIC PUMP SYSTEM MARKET, BY COUNTRY 2020–2030 ($MILLION)
TABLE 09.U.S. CRYOGENIC PUMP SYSTEM, BY TYPE, 2020–2030 ($MILLION)
TABLE 10.U.S. CRYOGENIC PUMP SYSTEM, BY APPLICATION 2020–2030 ($MILLION)
TABLE 11.U.S. CRYOGENIC PUMP SYSTEM, BY END-USER 2020–2030 ($MILLION)
TABLE 12.CANADA CRYOGENIC PUMP SYSTEM, BY TYPE, 2020–2030 ($MILLION)
TABLE 13.CANADA CRYOGENIC PUMP SYSTEM, BY APPLICATION 2020–2030 ($MILLION)
TABLE 14.CANADA CRYOGENIC PUMP SYSTEM, BY END-USER 2020–2030 ($MILLION)
TABLE 15.MEXICO CRYOGENIC PUMP SYSTEM, BY TYPE, 2020–2030 ($MILLION)
TABLE 16.MEXICO CRYOGENIC PUMP SYSTEM, BY APPLICATION 2020–2030 ($MILLION)
TABLE 17.MEXICO CRYOGENIC PUMP SYSTEM, BY END-USER 2020–2030 ($MILLION)
TABLE 18.EUROPE CRYOGENIC PUMP SYSTEM, BY TYPE, 2020–2030 ($MILLION)
TABLE 19.EUROPE CRYOGENIC PUMP SYSTEM, BY APPLICATION 2020–2030 ($MILLION)
TABLE 20.EUROPE CRYOGENIC PUMP SYSTEM, BY END-USER 2020–2030 ($MILLION)
TABLE 21.EUROPE CRYOGENIC PUMP SYSTEM MARKET, BY COUNTRY 2020–2030 ($MILLION)
TABLE 22.GERMANY CRYOGENIC PUMP SYSTEM, BY TYPE, 2020–2030 ($MILLION)
TABLE 23.GERMANY CRYOGENIC PUMP SYSTEM, BY APPLICATION 2020–2030 ($MILLION)
TABLE 24.GERMANY CRYOGENIC PUMP SYSTEM, BY END-USER 2020–2030 ($MILLION)
TABLE 25.FRANCE CRYOGENIC PUMP SYSTEM, BY TYPE, 2020–2030 ($MILLION)
TABLE 26.FRANCE CRYOGENIC PUMP SYSTEM, BY APPLICATION 2020–2030 ($MILLION)
TABLE 27.FRANCE CRYOGENIC PUMP SYSTEM, BY END-USER 2020–2030 ($MILLION)
TABLE 28.UK CRYOGENIC PUMP SYSTEM, BY TYPE, 2020–2030 ($MILLION)
TABLE 29.UK CRYOGENIC PUMP SYSTEM, BY APPLICATION 2020–2030 ($MILLION)
TABLE 30.UK CRYOGENIC PUMP SYSTEM, BY END-USER 2020–2030 ($MILLION)
TABLE 31.SPAIN CRYOGENIC PUMP SYSTEM, BY TYPE, 2020–2030 ($MILLION)
TABLE 32.SPAIN CRYOGENIC PUMP SYSTEM, BY APPLICATION 2020–2030 ($MILLION)
TABLE 33.SPAIN CRYOGENIC PUMP SYSTEM, BY END-USER 2020–2030 ($MILLION)
TABLE 34.ITALY CRYOGENIC PUMP SYSTEM, BY TYPE, 2020–2030 ($MILLION)
TABLE 35.ITALY CRYOGENIC PUMP SYSTEM, BY APPLICATION 2020–2030 ($MILLION)
TABLE 36.ITALY CRYOGENIC PUMP SYSTEM, BY END-USER 2020–2030 ($MILLION)
TABLE 37.REST OF EUROPE CRYOGENIC PUMP SYSTEM, BY TYPE, 2020–2030 ($MILLION)
TABLE 38.REST OF EUROPE CRYOGENIC PUMP SYSTEM, BY APPLICATION 2020–2030 ($MILLION)
TABLE 39.REST OF EUROPE CRYOGENIC PUMP SYSTEM, BY END-USER 2020–2030 ($MILLION)
TABLE 40.ASIA-PACIFIC CRYOGENIC PUMP SYSTEM, BY TYPE, 2020–2030 ($MILLION)
TABLE 41.ASIA-PACIFIC CRYOGENIC PUMP SYSTEM, BY APPLICATION 2020–2030 ($MILLION)
TABLE 42.ASIA-PACIFIC CRYOGENIC PUMP SYSTEM, BY END-USER 2020–2030 ($MILLION)
TABLE 43.ASIA-PACIFIC CRYOGENIC PUMP SYSTEM MARKET, BY COUNTRY 2020–2030 ($MILLION)
TABLE 44.CHINA CRYOGENIC PUMP SYSTEM, BY TYPE, 2020–2030 ($MILLION)
TABLE 45.CHINA CRYOGENIC PUMP SYSTEM, BY APPLICATION 2020–2030 ($MILLION)
TABLE 46.CHINA CRYOGENIC PUMP SYSTEM, BY END-USER 2020–2030 ($MILLION)
TABLE 47.JAPAN CRYOGENIC PUMP SYSTEM, BY TYPE, 2020–2030 ($MILLION)
TABLE 48.JAPAN CRYOGENIC PUMP SYSTEM, BY APPLICATION 2020–2030 ($MILLION)
TABLE 49.JAPAN CRYOGENIC PUMP SYSTEM, BY END-USER 2020–2030 ($MILLION)
TABLE 50.INDIAN CRYOGENIC PUMP SYSTEM, BY TYPE, 2020–2030 ($MILLION)
TABLE 51.INDIAN CRYOGENIC PUMP SYSTEM, BY APPLICATION 2020–2030 ($MILLION)
TABLE 52.INDIAN CRYOGENIC PUMP SYSTEM, BY END-USER 2020–2030 ($MILLION)
TABLE 53.SOUTH KOREA CRYOGENIC PUMP SYSTEM, BY TYPE, 2020–2030 ($MILLION)
TABLE 54.SOUTH KOREA CRYOGENIC PUMP SYSTEM, BY APPLICATION 2020–2030 ($MILLION)
TABLE 55.SOUTH KOREA CRYOGENIC PUMP SYSTEM, BY END-USER 2020–2030 ($MILLION)
TABLE 56.AUSTRALIA CRYOGENIC PUMP SYSTEM, BY TYPE, 2020–2030 ($MILLION)
TABLE 57.AUSTRALIA CRYOGENIC PUMP SYSTEM, BY APPLICATION 2020–2030 ($MILLION)
TABLE 58.AUSTRALIA CRYOGENIC PUMP SYSTEM, BY END-USER 2020–2030 ($MILLION)
TABLE 59.REST OF ASIA-PACIFIC CRYOGENIC PUMP SYSTEM, BY TYPE, 2020–2030 ($MILLION)
TABLE 60.REST OF ASIA-PACIFIC CRYOGENIC PUMP SYSTEM, BY APPLICATION 2020–2030 ($MILLION)
TABLE 61.REST OF ASIA-PACIFIC CRYOGENIC PUMP SYSTEM, BY END-USER 2020–2030 ($MILLION)
TABLE 62.LAMEA CRYOGENIC PUMP SYSTEM, BY TYPE, 2020–2030 ($MILLION)
TABLE 63.LAMEA CRYOGENIC PUMP SYSTEM, BY APPLICATION 2020–2030 ($MILLION)
TABLE 64.LAMEA CRYOGENIC PUMP SYSTEM, BY END-USER 2020–2030 ($MILLION)
TABLE 65.LAMEA CRYOGENIC PUMP SYSTEM MARKET, BY COUNTRY 2020–2030 ($MILLION)
TABLE 66.BRAZIL CRYOGENIC PUMP SYSTEM, BY TYPE, 2020–2030 ($MILLION)
TABLE 67.BRAZIL CRYOGENIC PUMP SYSTEM, BY APPLICATION 2020–2030 ($MILLION)
TABLE 68.BRAZIL CRYOGENIC PUMP SYSTEM, BY END-USER 2020–2030 ($MILLION)
TABLE 69.SAUDI ARABIA CRYOGENIC PUMP SYSTEM, BY TYPE, 2020–2030 ($MILLION)
TABLE 70.SAUDI ARABIA CRYOGENIC PUMP SYSTEM, BY APPLICATION 2020–2030 ($MILLION)
TABLE 71.SAUDI ARABIA CRYOGENIC PUMP SYSTEM, BY END-USER 2020–2030 ($MILLION)
TABLE 72.SOUTH AFRICA CRYOGENIC PUMP SYSTEM, BY TYPE, 2020–2030 ($MILLION)
TABLE 73.SOUTH AFRICA CRYOGENIC PUMP SYSTEM, BY APPLICATION 2020–2030 ($MILLION)
TABLE 74.SOUTH AFRICA CRYOGENIC PUMP SYSTEM, BY END-USER 2020–2030 ($MILLION)
TABLE 75.U.A.E. CRYOGENIC PUMP SYSTEM, BY TYPE, 2020–2030 ($MILLION)
TABLE 76.U.A.E. CRYOGENIC PUMP SYSTEM, BY APPLICATION 2020–2030 ($MILLION)
TABLE 77.U.A.E. CRYOGENIC PUMP SYSTEM, BY END-USER 2020–2030 ($MILLION)
TABLE 78.REST OF LAMEA CRYOGENIC PUMP SYSTEM, BY TYPE, 2020–2030 ($MILLION)
TABLE 79.REST OF LAMEA CRYOGENIC PUMP SYSTEM, BY APPLICATION 2020–2030 ($MILLION)
TABLE 80.REST OF LAMEA CRYOGENIC PUMP SYSTEM, BY END-USER 2020–2030 ($MILLION)
TABLE 81.KEY NEW PRODUCT LAUNCHES (2017–2021)
TABLE 82.KEY EXPANSIONS (2017–2021)
TABLE 83.KEY ACQUISITION (2017–2021)
TABLE 84.KEY PARTNERSHIP (2017–2021)
TABLE 85.ATLAS COPCO AB: KEY EXECUTIVES
TABLE 86.ATLAS COPCO AB: COMPANY SNAPSHOT
TABLE 87.ATLAS COPCO AB.: OPERATING SEGMENTS
TABLE 88.ATLAS COPCO AB: PRODUCT PORTFOLIO
TABLE 89.ATLAS COPCO AB: NET SALES, 2018–2020 ($MILLION)
TABLE 90.EBARA CORPORATION: KEY EXECUTIVES
TABLE 91.EBARA CORPORATION: COMPANY SNAPSHOT
TABLE 92.EBARA CORPORATION.: OPERATING SEGMENTS
TABLE 93.EBARA CORPORATION: PRODUCT PORTFOLIO
TABLE 94.OVERALL FINANCIAL STATUS ($MILLION)
TABLE 95.CRYOSTAR.: KEY EXECUTIVES
TABLE 96.CRYOSTAR.: COMPANY SNAPSHOT
TABLE 97.CRYOSTAR.: PRODUCT PORTFOLIO
TABLE 98.FIVES: KEY EXECUTIVES
TABLE 99.FIVES: COMPANY SNAPSHOT
TABLE 100.FIVES.: OPERATING SEGMENTS
TABLE 101.FIVES: PRODUCT PORTFOLIO
TABLE 102.OVERALL FINANCIAL STATUS ($MILLION)
TABLE 103.FIVES: KEY STRATEGIC MOVES AND DEVELOPMENTS
TABLE 104.FLOWSERVE CORPORATION: KEY EXECUTIVES
TABLE 105.FLOWSERVE CORPORATION.: COMPANY SNAPSHOT
TABLE 106.FLOWSERVE CORPORATION.: OPERATING SEGMENTS
TABLE 107.FLOWSERVE CORPORATION.
TABLE 108.OVERALL FINANCIAL STATUS ($MILLION)
TABLE 109.GEMMECOTTI SRL.: KEY EXECUTIVES
TABLE 110.GEMMECOTTI SRL.: COMPANY SNAPSHOT
TABLE 111.GEMMECOTTI SRL.: PRODUCT PORTFOLIO
TABLE 112.NIKKISO CO., LTD.: KEY EXECUTIVES
TABLE 113.NIKKISO CO., LTD.: COMPANY SNAPSHOT
TABLE 114.NIKKISO CO., LTD..: OPERATING SEGMENTS
TABLE 115.NIKKISO CO., LTD.: PRODUCT PORTFOLIO
TABLE 116.NIKKISO CO., LTD..: NET SALES, 2018–2020 ($MILLION)
TABLE 117.NIKKISO CO., LTD.: KEY STRATEGIC MOVES AND DEVELOPMENTS
TABLE 118.RUHRPUMPEN.: KEY EXECUTIVES
TABLE 119.RUHRPUMPEN: COMPANY SNAPSHOT
TABLE 120.RUHRPUMPEN: PRODUCT PORTFOLIO
TABLE 121.SHI CRYOGENICS GROUP.: KEY EXECUTIVES
TABLE 122.SHI CRYOGENICS GROUP.: COMPANY SNAPSHOT
TABLE 123.SHI CRYOGENICS GROUP.: PRODUCT PORTFOLIO
TABLE 124.TRILLIUM FLOW TECHNOLOGIES.: KEY EXECUTIVES
TABLE 125.TRILLIUM FLOW TECHNOLOGIES: COMPANY SNAPSHOT
TABLE 126.TRILLIUM FLOW TECHNOLOGIES: PRODUCT PORTFOLIO
TABLE 127.TRILLIUM FLOW TECHNOLOGIES: KEY STRATEGIC MOVES AND DEVELOPMENTS
List of Figures
FIGURE 01.GLOBAL CRYOGENIC PUMP MARKET SNAPSHOT, BY SEGMENTATION, 2021–2030
FIGURE 02.GLOBAL CRYOGENIC PUMP MARKET SNAPSHOT, BY REGION, 2021–2030
FIGURE 03.GLOBAL CRYOGENIC PUMP MARKET SEGMENTATION
FIGURE 04.TOP INVESTMENT POCKETS
FIGURE 05.MODERATE BARSGAINING POWER OF SUPPLIERS
FIGURE 06.MODERATE THREAT OF NEW ENTRANTS
FIGURE 07.MODERATE THREAT OF SUBSTITUTES
FIGURE 08.MODERATE INTENSITY OF COMPETITIVE RIVALRY
FIGURE 09.MODERATE BARSGAINING POWER OF BUYERS
FIGURE 10.GLOBAL CRYOGENIC PUMP MARKET DYNAMICS
FIGURE 11.VALUE CHAIN ANALYSIS
FIGURE 12.GLOBAL CRYOGENIC PUMP SYSTEM REVENUE, BY TYPE ($MILLION)
FIGURE 13.MARKET SIZE AND FORECAST, 2020-2030 ($MILLION)
FIGURE 14.MARKET SIZE AND FORECAST, 2020-2030 ($MILLION)
FIGURE 15.MARKET SIZE AND FORECAST, 2020-2030 ($MILLION)
FIGURE 16.GLOBAL CRYOGENIC PUMP SYSTEM REVENUE, BY APPLICATION ($MILLION)
FIGURE 17.MARKET SIZE AND FORECAST, 2020-2030 ($MILLION)
FIGURE 18.MARKET SIZE AND FORECAST, 2020-2030 ($MILLION)
FIGURE 19.MARKET SIZE AND FORECAST, 2020-2030 ($MILLION)
FIGURE 20.MARKET SIZE AND FORECAST, 2020-2030 ($MILLION)
FIGURE 21.MARKET SIZE AND FORECAST, 2020-2030 ($MILLION)
FIGURE 22.GLOBAL CRYOGENIC PUMP SYSTEM REVENUE, BY END-USER ($MILLION)
FIGURE 23.MARKET SIZE AND FORECAST, 2020-2030 ($MILLION)
FIGURE 24.MARKET SIZE AND FORECAST, 2020-2030 ($MILLION)
FIGURE 25.MARKET SIZE AND FORECAST, 2020-2030 ($MILLION)
FIGURE 26.MARKET SIZE AND FORECAST, 2020-2030 ($MILLION)
FIGURE 27.MARKET SIZE AND FORECAST, 2020-2030 ($MILLION)
FIGURE 28.MARKET SIZE AND FORECAST, 2020-2030 ($MILLION)
FIGURE 29.GLOBAL CRYOGENIC PUMP MARKET REVENUE, BY REGION ($MILLION)
FIGURE 30.U.S. CRYOGENIC PUMP SYSTEM MARKET REVENUE, 2020–2030, ($MILLION)
FIGURE 31.CANADA CRYOGENIC PUMP SYSTEM MARKET REVENUE, 2020–2030, ($MILLION)
FIGURE 32.MEXICO CRYOGENIC PUMP SYSTEM MARKET REVENUE, 2020–2030, ($MILLION)
FIGURE 33.GERMANY CRYOGENIC PUMP SYSTEM MARKET REVENUE, 2020–2030, ($MILLION)
FIGURE 34.FRANCE CRYOGENIC PUMP SYSTEM MARKET REVENUE, 2020–2030, ($MILLION)
FIGURE 35.UK CRYOGENIC PUMP SYSTEM MARKET REVENUE, 2020–2030, ($MILLION)
FIGURE 36.SPAIN CRYOGENIC PUMP SYSTEM MARKET REVENUE, 2020–2030, ($MILLION)
FIGURE 37.ITALY CRYOGENIC PUMP SYSTEM MARKET REVENUE, 2020–2030, ($MILLION)
FIGURE 38.REST OF EUROPE CRYOGENIC PUMP SYSTEM MARKET REVENUE, 2020–2030, ($MILLION)
FIGURE 39.CHINA CRYOGENIC PUMP SYSTEM MARKET REVENUE, 2020–2030, ($MILLION)
FIGURE 40.JAPAN CRYOGENIC PUMP SYSTEM MARKET REVENUE, 2020–2030, ($MILLION)
FIGURE 41.INDIA CRYOGENIC PUMP SYSTEM MARKET REVENUE, 2020–2030, ($MILLION)
FIGURE 42.SOUTH KOREA CRYOGENIC PUMP SYSTEM MARKET REVENUE, 2020–2030, ($MILLION)
FIGURE 43.AUSTRALIA CRYOGENIC PUMP SYSTEM MARKET REVENUE, 2020–2030, ($MILLION)
FIGURE 44.REST OF ASIA-PACIFIC CRYOGENIC PUMP SYSTEM MARKET REVENUE, 2020–2030, ($MILLION)
FIGURE 45.BRAZIL CRYOGENIC PUMP SYSTEM MARKET REVENUE, 2020–2030, ($MILLION)
FIGURE 46.SAUDI ARABIA CRYOGENIC PUMP SYSTEM MARKET REVENUE, 2020–2030, ($MILLION)
FIGURE 47.SOUTH AFRICA CRYOGENIC PUMP SYSTEM MARKET REVENUE, 2020–2030, ($MILLION)
FIGURE 48.U.A.E. CRYOGENIC PUMP SYSTEM MARKET REVENUE, 2020–2030, ($MILLION)
FIGURE 49.REST OF LAMEA CRYOGENIC PUMP SYSTEM MARKET REVENUE, 2020–2030, ($MILLION)
FIGURE 50.MARKET PLAYER POSITIONING, 2020
FIGURE 51.TOP WINNING STRATEGIES, BY YEAR, 2018–2022
FIGURE 52.TOP WINNING STRATEGIES, BY DEVELOPMENT, 2018–2022 (%)
FIGURE 53.TOP WINNING STRATEGIES, BY COMPANY, 2018–2022
FIGURE 54.PRODUCT MAPPING OF TOP 10 PLAYERS
FIGURE 55.COMPETITIVEHEATMAP OF KEY PLAYERS
FIGURE 56.ATLAS COPCO AB: NET SALES, 2018–2020 ($MILLION)
FIGURE 57.ATLAS COPCO AB: REVENUE SHARE BY SEGMENT, 2020 (%)
FIGURE 58.ATLAS COPCO AB: REVENUE SHARE BY REGION, 2020 (%)
FIGURE 59.EBARA CORPORATION: REVENUE, 2018-2020 ($MILLION)
FIGURE 60.EBARA CORPORATION: REVENUE SHARE BY SEGMENT, 2020 (%)
FIGURE 61.EBARA CORPORATION: REVENUE SHARE BY REGION, 2020 (%)
FIGURE 62.FIVES: REVENUE, 2018-2020 ($MILLION)
FIGURE 63.FIVES: REVENUE SHARE BY SEGMENT, 2020 (%)
FIGURE 64.FIVES: REVENUE SHARE BY REGION, 2020 (%)
FIGURE 65.FLOWSERVE CORPORATION.: REVENUE, 2017–2019 ($MILLION)
FIGURE 66.FLOWSERVE CORPORATION.: REVENUE SHARE BY SEGMENT, 2020 (%)
FIGURE 67.FLOWSERVE CORPORATION.: REVENUE SHARE BY REGION, 2020 (%)
FIGURE 68.NIKKISO CO., LTD..: NET SALES, 2018–2020 ($MILLION)
FIGURE 69.NIKKISO CO., LTD..: REVENUE SHARE BY SEGMENT, 2020 (%)
FIGURE 70.NIKKISO CO., LTD..: REVENUE SHARE BY REGION, 2020 (%)
$5769
$10995
HAVE A QUERY?
OUR CUSTOMER
