0
U.S. (TOLL FREE)
+1 (315) 215-3225
Automative

0
U.S. (TOLL FREE)
+1 (315) 215-3225
Foreign Exchange Services Market By Services (Currency Exchange, Remittance Services, Foreign Currency Accounts, Others), By Providers (Banks, Money Transfer Operators, Others), By Application (Businesses, Individuals): Global Opportunity Analysis and Industry Forecast, 2021-2031
Published Date: March 2023
|
Report Code: ALLI-Auto-1J738
Home | Market Reports | Finance| Investing| Currencies & Foreign Exchange
Foreign Exchange Services Market By Services Currency Exchange Remittance Services Foreign Currency Accounts Others By Providers Banks Money Transfer Operators Others By Application Businesses Individuals Global Opportunity Analysis and Industry Forecast 2021 2031
BUY CHAPTERS

Foreign Exchange Services Market By Services (Currency Exchange, Remittance Services, Foreign Currency Accounts, Others), By Providers (Banks, Money Transfer Operators, Others), By Application (Businesses, Individuals): Global Opportunity Analysis and Industry Forecast, 2021-2031

Code: ALLI-Auto-1J738
Report
March 2023
Pages:389
Allied Market Research
Buy Now with 15% Discount
DESCRIPTION
TABLE OF CONTENT
TABLES & FIGURES

Foreign Exchange Services Market Size

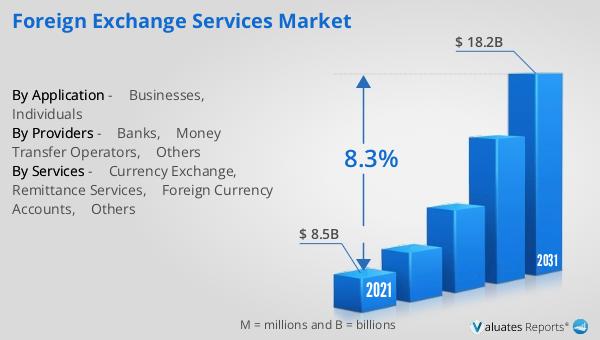
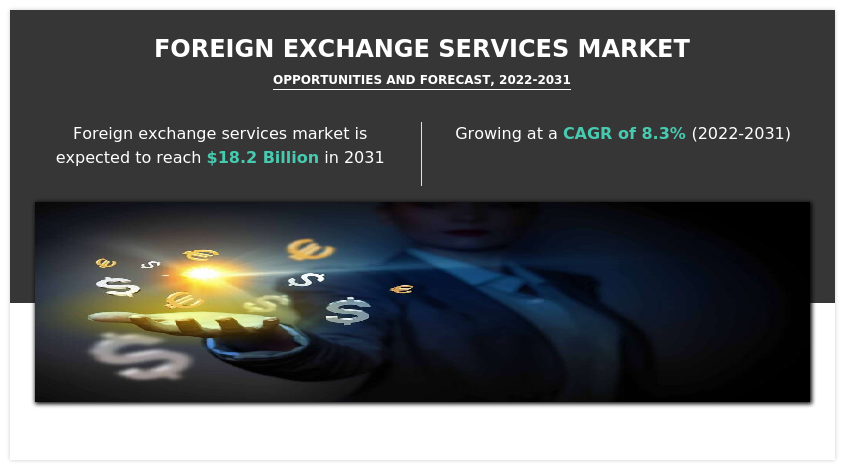
According to a new report published by , titled, “Foreign Exchange Services Market," The foreign exchange services market was valued at $8.5 billion in 2021, and is estimated to reach $18.2 billion by 2031, growing at a CAGR of 8.3% from 2022 to 2031.

Foreign Exchange Services Market

Foreign Exchange Services Market

The foreign exchange service market is likely to experience a significant growth rate of 8.3% from 2022-2031 owing to increasing market demand from remittance services –
 
The foreign exchange (FX) service market refers to the marketplace where individuals, businesses, and financial institutions exchange foreign currency to home currency. Furthermore, it is a necessary service for international trade, tourism, investment, and other cross-border transactions. For instance, if a US company wants to buy products from a Chinese manufacturer, they will need to pay in Chinese Yuan. The US company will need to exchange their US Dollars for Chinese Yuan in the foreign exchange market. Moreover, these foreign exchange service providers facilitate currency exchange transactions, and they earn profits from the difference between the buying and selling prices of currencies. The most common foreign exchange services include currency exchange for travelers, international wire transfers, and foreign currency trading for investment purposes. Additionally, these services are typically offered by financial institutions such as banks, currency exchange bureaus, and online providers. And, these services allow individuals and organizations to buy, sell, and transfer different currencies at current exchange rates.
Furthermore, the rising rise in usage of digital technologies has transformed the way that foreign exchange services are delivered and consumed, making them faster, more convenient, and more accessible to a wider range of customers, which has helped to drive growth in the market. Moreover, now-a-days online platforms have made it easier for businesses to access foreign exchange services, allowing them to compare exchange rates, initiate transactions, and track the status of the payments in real-time. In addition, due to cross border investments, and e-commerce companies are required to convert one currency into another in order to conduct cross-border transactions, and foreign exchange service providers offer the tools and services which is needed for cross border transactions. Therefore, these are the key factors which are driving the growth of the foreign exchange service market in upcoming years.
However, the fluctuations in the economic stability of a country have a significant impact on the foreign exchange services market. Because the unstable economy results in lower volumes of currency transactions, reduced profitability for foreign exchange service providers, and increased volatility in exchange rates. Furthermore, political and economic events that impact a country's stability can also lead to fluctuations in the foreign exchange services market, making it more challenging for businesses, individuals, and organizations to engage in cross-border transactions. Therefore, an unstable and fluctuation in the economy act as restraint for the growth of the market.
Contrarily, the growth of global trade and investment positively impacts the foreign exchange services market. Because as countries engage in more international trade, the demand for foreign exchange services increase. Thus, the increase in cross-border e-commerce has led to an increase in demand for foreign exchange services, as businesses need to convert payments and transactions into different currencies. Therefore, these factors lead to the growth of the market in upcoming years.  
Moreover, the COVID-19 pandemic has significantly impacted the foreign exchange services market, leading to increased demand for digital currency services as well as a significant reduction in overall trading volumes and market volatility. Furthermore, due to pandemic many companies were adopting automated currency hedging solutions that use algorithms and machine learning to optimize currency exposure and minimize losses. Thus, these leads to changes in the way foreign exchange services were delivered. Overall, the impact of the pandemic on the foreign exchange services market has been mixed. Therefore, COVID-19 has moderately impacted the foreign exchange services market.  
The foreign exchange services market is segmented on the basis of services, providers, application and region. Based on services, it is segmented into currency exchange, remittance services, foreign currency accounts, and others. By providers, it is segmented into banks, money transfer operators, and others. By application, it is segmented into businesses and individuals. By region, it is analyzed across North America, Europe, Asia-Pacific, and LAMEA.
Furthermore, major market players have undertaken various strategies to increase the competition and offer enhanced services to their customers. For instance, in November 2022, Wells Fargo and HSBC Bank plc announced partnership and business expansion for the growth of their business. Through this strategy, the blockchain-based solution that they were using for bilateral FX settlements is expanding to include the offshore yuan (Chinese Yuan (CNH)). The offshore yuan marks the fifth currency to be settled between the two banks using a shared settlement ledger that currently encompasses the U.S. dollar, Canadian dollar, British pound sterling, and the euro. Therefore, such strategy strategies help to grow the foreign exchange services market in upcoming years.    
The report analyzes the profiles of key players operating in the foreign exchange services market such as American Express Company, Barclays, Citigroup Inc., Deutsche Bank AG, JPMorgan Chase & Co., Goldman Sachs, HSBC Group, Standard Chartered, Wells Fargo, and Western Union Holdings. These players have adopted various strategies to increase their market penetration and strengthen their position in the foreign exchange services market.
 
Key Market Insights
By services, the remittance services segment attained the highest growth in 2021.
By providers, the bank segment attained the highest growth in 2021.
By application, the individual's segment attained the highest growth in 2021.

Overview

Foreign exchange services refer to financial services related to the exchange of one currency with another. This can include services such as currency conversion, remittances, foreign currency accounts, and other financial products used by individuals, businesses, or organizations when engaging in international transactions. These services are typically provided by banks, money transfer companies, or foreign exchange brokers.
Globalization has created new opportunities for foreign exchange service providers, as companies are conducting more business across borders and need efficient solutions for managing international transactions. Moreover, globalization led to increased trade and investment flow among countries, which has driven demand for foreign exchange services. Furthermore, the rise of digital technologies has transformed the way foreign exchange services are delivered and consumed, making them faster, more convenient, and more accessible to a wider range of customers, which has helped to drive growth in the market. However, there are high regulatory barriers in the foreign exchange market which makes it difficult for service providers to enter new markets or expand their operations. Moreover, obtaining necessary licenses and authorizations from regulatory bodies is a time-consuming and expensive process, and failure to comply with regulatory requirements leads to penalties or fines, which retrain the growth of the market. On the contrary, the growth of global trade and investment has a positive impact on the foreign exchange services market. As countries engage in more international trade, the demand for foreign exchange services increases. Therefore, the surge in cross-border e-commerce has led to an increase in demand for foreign exchange services, as businesses need to convert payments and transactions into different currencies. Thus, such factors are likely to propel the foreign exchange services market to new heights.
The foreign exchange services market is segmented on the basis of services, provider, application, and region. By services, it is categorized into currency exchange, remittance services, foreign currency accounts, and others. By provider, it is classified into banks, money transfer operators, and others. On the basis of application, it is bifurcated into businesses and individuals. By region, it is analyzed across North America, Europe, Asia-Pacific, and LAMEA.
The report analyzes the profiles of key players operating in the foreign exchange services market such as American Express Company, Barclays, Citigroup Inc., Deutsche Bank AG, JPMorgan Chase & Co., Goldman Sachs, HSBC Group, Standard Chartered, Wells Fargo, and Western Union Holdings. These players have adopted various strategies to increase their market penetration and strengthen their position in the foreign exchange service industry.

Key benefits for stakeholders

●The study provides in-depth analysis of the global foreign exchange services market along with the current & future trends to illustrate the imminent investment pockets.
●Information about key drivers, restrains, & opportunities and their impact analysis on the global foreign exchange services market size are provided in the report.
●Porter’s five forces analysis illustrates the potency of buyers and suppliers operating in the industry.
●The quantitative analysis of the global foreign exchange services market from 2022 to 2031 is provided to determine the market potential.
Key Market Segments
○ Western Union Holding

Scope of Foreign Exchange Services Market Report

Report Metric Details
Report Name Foreign Exchange Services Market
Accounted market size in 2021 $ 8.5 billion
Forecasted market size in 2031 $ 18.2 billion
CAGR 8.3%
Base Year 2021
Forecasted years 2024 - 2031
By Services ● Currency Exchange
● Remittance Services
● Foreign Currency Accounts
● Others
By Providers ● Banks
● Money Transfer Operators
● Others
By Application ● Businesses
● Individuals
By Region
  • North America (United States, Canada)
  • Europe (Germany, France, UK, Italy, Russia) Rest of Europe
  • Nordic Countries
  • Asia-Pacific (China, Japan, South Korea)
  • Southeast Asia (India, Australia)
  • Rest of Asia
  • Latin America (Mexico, Brazil)
  • Rest of Latin America
  • Middle East & Africa (Turkey, Saudi Arabia, UAE, Rest of MEA)
Forecast units USD million in value
Report coverage Revenue and volume forecast, company share, competitive landscape, growth factors and trends

FAQ for this report

How fast is Foreign Exchange Services Market growing?

Ans: The Foreign Exchange Services Market witnessing a CAGR of 8.3% during the forecast period 2024-2031.

What is the Foreign Exchange Services Market size in 2031?

Ans: The Foreign Exchange Services Market size in 2031 will be $ 18.2 billion.

What are the Application segmentation covered in the Foreign Exchange Services Market report?

Ans: The Applications covered in the Foreign Exchange Services Market report are ● Businesses, ● Individuals

CHAPTER 1: INTRODUCTION
1.1. Report description
1.2. Key market segments
1.3. Key benefits to the stakeholders
1.4. Research Methodology
1.4.1. Primary research
1.4.2. Secondary research
1.4.3. Analyst tools and models
CHAPTER 2: EXECUTIVE SUMMARY
2.1. CXO Perspective
CHAPTER 3: MARKET OVERVIEW
3.1. Market definition and scope
3.2. Key findings
3.2.1. Top impacting factors
3.2.2. Top investment pockets
3.3. Porter’s five forces analysis
3.3.1. Bargaining power of suppliers
3.3.2. Bargaining power of buyers
3.3.3. Threat of substitutes
3.3.4. Threat of new entrants
3.3.5. Intensity of rivalry
3.4. Market dynamics
3.4.1. Drivers
3.4.1.1. Growing foreign trade between countries
3.4.1.2. Ease of doing business with other countries
3.4.2. Restraints
3.4.2.1. Fluctuation in the economic stability of a country
3.4.2.2. Regulatory barriers in doing foreign trade
3.4.3. Opportunities
3.4.3.1. Growing global trade and investment
3.5. COVID-19 Impact Analysis on the market
CHAPTER 4: FOREIGN EXCHANGE SERVICES MARKET, BY SERVICES
4.1. Overview
4.1.1. Market size and forecast
4.2. Currency Exchange
4.2.1. Key market trends, growth factors and opportunities
4.2.2. Market size and forecast, by region
4.2.3. Market share analysis by country
4.3. Remittance Services
4.3.1. Key market trends, growth factors and opportunities
4.3.2. Market size and forecast, by region
4.3.3. Market share analysis by country
4.4. Foreign Currency Accounts
4.4.1. Key market trends, growth factors and opportunities
4.4.2. Market size and forecast, by region
4.4.3. Market share analysis by country
4.5. Others
4.5.1. Key market trends, growth factors and opportunities
4.5.2. Market size and forecast, by region
4.5.3. Market share analysis by country
CHAPTER 5: FOREIGN EXCHANGE SERVICES MARKET, BY PROVIDERS
5.1. Overview
5.1.1. Market size and forecast
5.2. Banks
5.2.1. Key market trends, growth factors and opportunities
5.2.2. Market size and forecast, by region
5.2.3. Market share analysis by country
5.3. Money Transfer Operators
5.3.1. Key market trends, growth factors and opportunities
5.3.2. Market size and forecast, by region
5.3.3. Market share analysis by country
5.4. Others
5.4.1. Key market trends, growth factors and opportunities
5.4.2. Market size and forecast, by region
5.4.3. Market share analysis by country
CHAPTER 6: FOREIGN EXCHANGE SERVICES MARKET, BY APPLICATION
6.1. Overview
6.1.1. Market size and forecast
6.2. Businesses
6.2.1. Key market trends, growth factors and opportunities
6.2.2. Market size and forecast, by region
6.2.3. Market share analysis by country
6.3. Individuals
6.3.1. Key market trends, growth factors and opportunities
6.3.2. Market size and forecast, by region
6.3.3. Market share analysis by country
CHAPTER 7: FOREIGN EXCHANGE SERVICES MARKET, BY REGION
7.1. Overview
7.1.1. Market size and forecast By Region
7.2. North America
7.2.1. Key trends and opportunities
7.2.2. Market size and forecast, by Services
7.2.3. Market size and forecast, by Providers
7.2.4. Market size and forecast, by Application
7.2.5. Market size and forecast, by country
7.2.5.1. U.S.
7.2.5.1.1. Key market trends, growth factors and opportunities
7.2.5.1.2. Market size and forecast, by Services
7.2.5.1.3. Market size and forecast, by Providers
7.2.5.1.4. Market size and forecast, by Application
7.2.5.2. Canada
7.2.5.2.1. Key market trends, growth factors and opportunities
7.2.5.2.2. Market size and forecast, by Services
7.2.5.2.3. Market size and forecast, by Providers
7.2.5.2.4. Market size and forecast, by Application
7.3. Europe
7.3.1. Key trends and opportunities
7.3.2. Market size and forecast, by Services
7.3.3. Market size and forecast, by Providers
7.3.4. Market size and forecast, by Application
7.3.5. Market size and forecast, by country
7.3.5.1. UK
7.3.5.1.1. Key market trends, growth factors and opportunities
7.3.5.1.2. Market size and forecast, by Services
7.3.5.1.3. Market size and forecast, by Providers
7.3.5.1.4. Market size and forecast, by Application
7.3.5.2. Germany
7.3.5.2.1. Key market trends, growth factors and opportunities
7.3.5.2.2. Market size and forecast, by Services
7.3.5.2.3. Market size and forecast, by Providers
7.3.5.2.4. Market size and forecast, by Application
7.3.5.3. France
7.3.5.3.1. Key market trends, growth factors and opportunities
7.3.5.3.2. Market size and forecast, by Services
7.3.5.3.3. Market size and forecast, by Providers
7.3.5.3.4. Market size and forecast, by Application
7.3.5.4. Italy
7.3.5.4.1. Key market trends, growth factors and opportunities
7.3.5.4.2. Market size and forecast, by Services
7.3.5.4.3. Market size and forecast, by Providers
7.3.5.4.4. Market size and forecast, by Application
7.3.5.5. Spain
7.3.5.5.1. Key market trends, growth factors and opportunities
7.3.5.5.2. Market size and forecast, by Services
7.3.5.5.3. Market size and forecast, by Providers
7.3.5.5.4. Market size and forecast, by Application
7.3.5.6. Rest of Europe
7.3.5.6.1. Key market trends, growth factors and opportunities
7.3.5.6.2. Market size and forecast, by Services
7.3.5.6.3. Market size and forecast, by Providers
7.3.5.6.4. Market size and forecast, by Application
7.4. Asia-Pacific
7.4.1. Key trends and opportunities
7.4.2. Market size and forecast, by Services
7.4.3. Market size and forecast, by Providers
7.4.4. Market size and forecast, by Application
7.4.5. Market size and forecast, by country
7.4.5.1. China
7.4.5.1.1. Key market trends, growth factors and opportunities
7.4.5.1.2. Market size and forecast, by Services
7.4.5.1.3. Market size and forecast, by Providers
7.4.5.1.4. Market size and forecast, by Application
7.4.5.2. Japan
7.4.5.2.1. Key market trends, growth factors and opportunities
7.4.5.2.2. Market size and forecast, by Services
7.4.5.2.3. Market size and forecast, by Providers
7.4.5.2.4. Market size and forecast, by Application
7.4.5.3. India
7.4.5.3.1. Key market trends, growth factors and opportunities
7.4.5.3.2. Market size and forecast, by Services
7.4.5.3.3. Market size and forecast, by Providers
7.4.5.3.4. Market size and forecast, by Application
7.4.5.4. Australia
7.4.5.4.1. Key market trends, growth factors and opportunities
7.4.5.4.2. Market size and forecast, by Services
7.4.5.4.3. Market size and forecast, by Providers
7.4.5.4.4. Market size and forecast, by Application
7.4.5.5. South Korea
7.4.5.5.1. Key market trends, growth factors and opportunities
7.4.5.5.2. Market size and forecast, by Services
7.4.5.5.3. Market size and forecast, by Providers
7.4.5.5.4. Market size and forecast, by Application
7.4.5.6. Rest of Asia-Pacific
7.4.5.6.1. Key market trends, growth factors and opportunities
7.4.5.6.2. Market size and forecast, by Services
7.4.5.6.3. Market size and forecast, by Providers
7.4.5.6.4. Market size and forecast, by Application
7.5. LAMEA
7.5.1. Key trends and opportunities
7.5.2. Market size and forecast, by Services
7.5.3. Market size and forecast, by Providers
7.5.4. Market size and forecast, by Application
7.5.5. Market size and forecast, by country
7.5.5.1. Latin America
7.5.5.1.1. Key market trends, growth factors and opportunities
7.5.5.1.2. Market size and forecast, by Services
7.5.5.1.3. Market size and forecast, by Providers
7.5.5.1.4. Market size and forecast, by Application
7.5.5.2. Middle East
7.5.5.2.1. Key market trends, growth factors and opportunities
7.5.5.2.2. Market size and forecast, by Services
7.5.5.2.3. Market size and forecast, by Providers
7.5.5.2.4. Market size and forecast, by Application
7.5.5.3. Africa
7.5.5.3.1. Key market trends, growth factors and opportunities
7.5.5.3.2. Market size and forecast, by Services
7.5.5.3.3. Market size and forecast, by Providers
7.5.5.3.4. Market size and forecast, by Application
CHAPTER 8: COMPETITIVE LANDSCAPE
8.1. Introduction
8.2. Top winning strategies
8.3. Product Mapping of Top 10 Player
8.4. Competitive Dashboard
8.5. Competitive Heatmap
8.6. Top player positioning, 2021
CHAPTER 9: COMPANY PROFILES
9.1. American Express Company
9.1.1. Company overview
9.1.2. Key Executives
9.1.3. Company snapshot
9.1.4. Operating business segments
9.1.5. Product portfolio
9.1.6. Business performance
9.1.7. Key strategic moves and developments
9.2. Barclays
9.2.1. Company overview
9.2.2. Key Executives
9.2.3. Company snapshot
9.2.4. Operating business segments
9.2.5. Product portfolio
9.2.6. Business performance
9.2.7. Key strategic moves and developments
9.3. Citigroup Inc.
9.3.1. Company overview
9.3.2. Key Executives
9.3.3. Company snapshot
9.3.4. Operating business segments
9.3.5. Product portfolio
9.3.6. Business performance
9.3.7. Key strategic moves and developments
9.4. Deutsche Bank AG
9.4.1. Company overview
9.4.2. Key Executives
9.4.3. Company snapshot
9.4.4. Operating business segments
9.4.5. Product portfolio
9.4.6. Business performance
9.5. Goldman Sachs
9.5.1. Company overview
9.5.2. Key Executives
9.5.3. Company snapshot
9.5.4. Operating business segments
9.5.5. Product portfolio
9.5.6. Business performance
9.5.7. Key strategic moves and developments
9.6. HSBC Group
9.6.1. Company overview
9.6.2. Key Executives
9.6.3. Company snapshot
9.6.4. Operating business segments
9.6.5. Product portfolio
9.6.6. Business performance
9.6.7. Key strategic moves and developments
9.7. JPMorgan Chase & Co.
9.7.1. Company overview
9.7.2. Key Executives
9.7.3. Company snapshot
9.7.4. Operating business segments
9.7.5. Product portfolio
9.7.6. Business performance
9.7.7. Key strategic moves and developments
9.8. Standard Chartered
9.8.1. Company overview
9.8.2. Key Executives
9.8.3. Company snapshot
9.8.4. Operating business segments
9.8.5. Product portfolio
9.8.6. Business performance
9.9. Western Union Holdings
9.9.1. Company overview
9.9.2. Key Executives
9.9.3. Company snapshot
9.9.4. Operating business segments
9.9.5. Product portfolio
9.9.6. Business performance
9.9.7. Key strategic moves and developments
9.10. Wells Fargo
9.10.1. Company overview
9.10.2. Key Executives
9.10.3. Company snapshot
9.10.4. Operating business segments
9.10.5. Product portfolio
9.10.6. Business performance
9.10.7. Key strategic moves and development
LIST OF TABLES
TABLE 01. GLOBAL FOREIGN EXCHANGE SERVICES MARKET, BY SERVICES, 2021-2031 ($MILLION)
TABLE 02. FOREIGN EXCHANGE SERVICES MARKET FOR CURRENCY EXCHANGE, BY REGION, 2021-2031 ($MILLION)
TABLE 03. FOREIGN EXCHANGE SERVICES MARKET FOR REMITTANCE SERVICES, BY REGION, 2021-2031 ($MILLION)
TABLE 04. FOREIGN EXCHANGE SERVICES MARKET FOR FOREIGN CURRENCY ACCOUNTS, BY REGION, 2021-2031 ($MILLION)
TABLE 05. FOREIGN EXCHANGE SERVICES MARKET FOR OTHERS, BY REGION, 2021-2031 ($MILLION)
TABLE 06. GLOBAL FOREIGN EXCHANGE SERVICES MARKET, BY PROVIDERS, 2021-2031 ($MILLION)
TABLE 07. FOREIGN EXCHANGE SERVICES MARKET FOR BANKS, BY REGION, 2021-2031 ($MILLION)
TABLE 08. FOREIGN EXCHANGE SERVICES MARKET FOR MONEY TRANSFER OPERATORS, BY REGION, 2021-2031 ($MILLION)
TABLE 09. FOREIGN EXCHANGE SERVICES MARKET FOR OTHERS, BY REGION, 2021-2031 ($MILLION)
TABLE 10. GLOBAL FOREIGN EXCHANGE SERVICES MARKET, BY APPLICATION, 2021-2031 ($MILLION)
TABLE 11. FOREIGN EXCHANGE SERVICES MARKET FOR BUSINESSES, BY REGION, 2021-2031 ($MILLION)
TABLE 12. FOREIGN EXCHANGE SERVICES MARKET FOR INDIVIDUALS, BY REGION, 2021-2031 ($MILLION)
TABLE 13. FOREIGN EXCHANGE SERVICES MARKET, BY REGION, 2021-2031 ($MILLION)
TABLE 14. NORTH AMERICA FOREIGN EXCHANGE SERVICES MARKET, BY SERVICES, 2021-2031 ($MILLION)
TABLE 15. NORTH AMERICA FOREIGN EXCHANGE SERVICES MARKET, BY PROVIDERS, 2021-2031 ($MILLION)
TABLE 16. NORTH AMERICA FOREIGN EXCHANGE SERVICES MARKET, BY APPLICATION, 2021-2031 ($MILLION)
TABLE 17. NORTH AMERICA FOREIGN EXCHANGE SERVICES MARKET, BY COUNTRY, 2021-2031 ($MILLION)
TABLE 18. U.S. FOREIGN EXCHANGE SERVICES MARKET, BY SERVICES, 2021-2031 ($MILLION)
TABLE 19. U.S. FOREIGN EXCHANGE SERVICES MARKET, BY PROVIDERS, 2021-2031 ($MILLION)
TABLE 20. U.S. FOREIGN EXCHANGE SERVICES MARKET, BY APPLICATION, 2021-2031 ($MILLION)
TABLE 21. CANADA FOREIGN EXCHANGE SERVICES MARKET, BY SERVICES, 2021-2031 ($MILLION)
TABLE 22. CANADA FOREIGN EXCHANGE SERVICES MARKET, BY PROVIDERS, 2021-2031 ($MILLION)
TABLE 23. CANADA FOREIGN EXCHANGE SERVICES MARKET, BY APPLICATION, 2021-2031 ($MILLION)
TABLE 24. EUROPE FOREIGN EXCHANGE SERVICES MARKET, BY SERVICES, 2021-2031 ($MILLION)
TABLE 25. EUROPE FOREIGN EXCHANGE SERVICES MARKET, BY PROVIDERS, 2021-2031 ($MILLION)
TABLE 26. EUROPE FOREIGN EXCHANGE SERVICES MARKET, BY APPLICATION, 2021-2031 ($MILLION)
TABLE 27. EUROPE FOREIGN EXCHANGE SERVICES MARKET, BY COUNTRY, 2021-2031 ($MILLION)
TABLE 28. UK FOREIGN EXCHANGE SERVICES MARKET, BY SERVICES, 2021-2031 ($MILLION)
TABLE 29. UK FOREIGN EXCHANGE SERVICES MARKET, BY PROVIDERS, 2021-2031 ($MILLION)
TABLE 30. UK FOREIGN EXCHANGE SERVICES MARKET, BY APPLICATION, 2021-2031 ($MILLION)
TABLE 31. GERMANY FOREIGN EXCHANGE SERVICES MARKET, BY SERVICES, 2021-2031 ($MILLION)
TABLE 32. GERMANY FOREIGN EXCHANGE SERVICES MARKET, BY PROVIDERS, 2021-2031 ($MILLION)
TABLE 33. GERMANY FOREIGN EXCHANGE SERVICES MARKET, BY APPLICATION, 2021-2031 ($MILLION)
TABLE 34. FRANCE FOREIGN EXCHANGE SERVICES MARKET, BY SERVICES, 2021-2031 ($MILLION)
TABLE 35. FRANCE FOREIGN EXCHANGE SERVICES MARKET, BY PROVIDERS, 2021-2031 ($MILLION)
TABLE 36. FRANCE FOREIGN EXCHANGE SERVICES MARKET, BY APPLICATION, 2021-2031 ($MILLION)
TABLE 37. ITALY FOREIGN EXCHANGE SERVICES MARKET, BY SERVICES, 2021-2031 ($MILLION)
TABLE 38. ITALY FOREIGN EXCHANGE SERVICES MARKET, BY PROVIDERS, 2021-2031 ($MILLION)
TABLE 39. ITALY FOREIGN EXCHANGE SERVICES MARKET, BY APPLICATION, 2021-2031 ($MILLION)
TABLE 40. SPAIN FOREIGN EXCHANGE SERVICES MARKET, BY SERVICES, 2021-2031 ($MILLION)
TABLE 41. SPAIN FOREIGN EXCHANGE SERVICES MARKET, BY PROVIDERS, 2021-2031 ($MILLION)
TABLE 42. SPAIN FOREIGN EXCHANGE SERVICES MARKET, BY APPLICATION, 2021-2031 ($MILLION)
TABLE 43. REST OF EUROPE FOREIGN EXCHANGE SERVICES MARKET, BY SERVICES, 2021-2031 ($MILLION)
TABLE 44. REST OF EUROPE FOREIGN EXCHANGE SERVICES MARKET, BY PROVIDERS, 2021-2031 ($MILLION)
TABLE 45. REST OF EUROPE FOREIGN EXCHANGE SERVICES MARKET, BY APPLICATION, 2021-2031 ($MILLION)
TABLE 46. ASIA-PACIFIC FOREIGN EXCHANGE SERVICES MARKET, BY SERVICES, 2021-2031 ($MILLION)
TABLE 47. ASIA-PACIFIC FOREIGN EXCHANGE SERVICES MARKET, BY PROVIDERS, 2021-2031 ($MILLION)
TABLE 48. ASIA-PACIFIC FOREIGN EXCHANGE SERVICES MARKET, BY APPLICATION, 2021-2031 ($MILLION)
TABLE 49. ASIA-PACIFIC FOREIGN EXCHANGE SERVICES MARKET, BY COUNTRY, 2021-2031 ($MILLION)
TABLE 50. CHINA FOREIGN EXCHANGE SERVICES MARKET, BY SERVICES, 2021-2031 ($MILLION)
TABLE 51. CHINA FOREIGN EXCHANGE SERVICES MARKET, BY PROVIDERS, 2021-2031 ($MILLION)
TABLE 52. CHINA FOREIGN EXCHANGE SERVICES MARKET, BY APPLICATION, 2021-2031 ($MILLION)
TABLE 53. JAPAN FOREIGN EXCHANGE SERVICES MARKET, BY SERVICES, 2021-2031 ($MILLION)
TABLE 54. JAPAN FOREIGN EXCHANGE SERVICES MARKET, BY PROVIDERS, 2021-2031 ($MILLION)
TABLE 55. JAPAN FOREIGN EXCHANGE SERVICES MARKET, BY APPLICATION, 2021-2031 ($MILLION)
TABLE 56. INDIA FOREIGN EXCHANGE SERVICES MARKET, BY SERVICES, 2021-2031 ($MILLION)
TABLE 57. INDIA FOREIGN EXCHANGE SERVICES MARKET, BY PROVIDERS, 2021-2031 ($MILLION)
TABLE 58. INDIA FOREIGN EXCHANGE SERVICES MARKET, BY APPLICATION, 2021-2031 ($MILLION)
TABLE 59. AUSTRALIA FOREIGN EXCHANGE SERVICES MARKET, BY SERVICES, 2021-2031 ($MILLION)
TABLE 60. AUSTRALIA FOREIGN EXCHANGE SERVICES MARKET, BY PROVIDERS, 2021-2031 ($MILLION)
TABLE 61. AUSTRALIA FOREIGN EXCHANGE SERVICES MARKET, BY APPLICATION, 2021-2031 ($MILLION)
TABLE 62. SOUTH KOREA FOREIGN EXCHANGE SERVICES MARKET, BY SERVICES, 2021-2031 ($MILLION)
TABLE 63. SOUTH KOREA FOREIGN EXCHANGE SERVICES MARKET, BY PROVIDERS, 2021-2031 ($MILLION)
TABLE 64. SOUTH KOREA FOREIGN EXCHANGE SERVICES MARKET, BY APPLICATION, 2021-2031 ($MILLION)
TABLE 65. REST OF ASIA-PACIFIC FOREIGN EXCHANGE SERVICES MARKET, BY SERVICES, 2021-2031 ($MILLION)
TABLE 66. REST OF ASIA-PACIFIC FOREIGN EXCHANGE SERVICES MARKET, BY PROVIDERS, 2021-2031 ($MILLION)
TABLE 67. REST OF ASIA-PACIFIC FOREIGN EXCHANGE SERVICES MARKET, BY APPLICATION, 2021-2031 ($MILLION)
TABLE 68. LAMEA FOREIGN EXCHANGE SERVICES MARKET, BY SERVICES, 2021-2031 ($MILLION)
TABLE 69. LAMEA FOREIGN EXCHANGE SERVICES MARKET, BY PROVIDERS, 2021-2031 ($MILLION)
TABLE 70. LAMEA FOREIGN EXCHANGE SERVICES MARKET, BY APPLICATION, 2021-2031 ($MILLION)
TABLE 71. LAMEA FOREIGN EXCHANGE SERVICES MARKET, BY COUNTRY, 2021-2031 ($MILLION)
TABLE 72. LATIN AMERICA FOREIGN EXCHANGE SERVICES MARKET, BY SERVICES, 2021-2031 ($MILLION)
TABLE 73. LATIN AMERICA FOREIGN EXCHANGE SERVICES MARKET, BY PROVIDERS, 2021-2031 ($MILLION)
TABLE 74. LATIN AMERICA FOREIGN EXCHANGE SERVICES MARKET, BY APPLICATION, 2021-2031 ($MILLION)
TABLE 75. MIDDLE EAST FOREIGN EXCHANGE SERVICES MARKET, BY SERVICES, 2021-2031 ($MILLION)
TABLE 76. MIDDLE EAST FOREIGN EXCHANGE SERVICES MARKET, BY PROVIDERS, 2021-2031 ($MILLION)
TABLE 77. MIDDLE EAST FOREIGN EXCHANGE SERVICES MARKET, BY APPLICATION, 2021-2031 ($MILLION)
TABLE 78. AFRICA FOREIGN EXCHANGE SERVICES MARKET, BY SERVICES, 2021-2031 ($MILLION)
TABLE 79. AFRICA FOREIGN EXCHANGE SERVICES MARKET, BY PROVIDERS, 2021-2031 ($MILLION)
TABLE 80. AFRICA FOREIGN EXCHANGE SERVICES MARKET, BY APPLICATION, 2021-2031 ($MILLION)
TABLE 81. AMERICAN EXPRESS COMPANY: KEY EXECUTIVES
TABLE 82. AMERICAN EXPRESS COMPANY: COMPANY SNAPSHOT
TABLE 83. AMERICAN EXPRESS COMPANY: SERVICE SEGMENTS
TABLE 84. AMERICAN EXPRESS COMPANY: PRODUCT PORTFOLIO
TABLE 85. AMERICAN EXPRESS COMPANY: KEY STRATERGIES
TABLE 86. BARCLAYS: KEY EXECUTIVES
TABLE 87. BARCLAYS: COMPANY SNAPSHOT
TABLE 88. BARCLAYS: SERVICE SEGMENTS
TABLE 89. BARCLAYS: PRODUCT PORTFOLIO
TABLE 90. BARCLAYS: KEY STRATERGIES
TABLE 91. CITIGROUP INC.: KEY EXECUTIVES
TABLE 92. CITIGROUP INC.: COMPANY SNAPSHOT
TABLE 93. CITIGROUP INC.: SERVICE SEGMENTS
TABLE 94. CITIGROUP INC.: PRODUCT PORTFOLIO
TABLE 95. CITIGROUP INC.: KEY STRATERGIES
TABLE 96. DEUTSCHE BANK AG: KEY EXECUTIVES
TABLE 97. DEUTSCHE BANK AG: COMPANY SNAPSHOT
TABLE 98. DEUTSCHE BANK AG: SERVICE SEGMENTS
TABLE 99. DEUTSCHE BANK AG: PRODUCT PORTFOLIO
TABLE 100. GOLDMAN SACHS: KEY EXECUTIVES
TABLE 101. GOLDMAN SACHS: COMPANY SNAPSHOT
TABLE 102. GOLDMAN SACHS: SERVICE SEGMENTS
TABLE 103. GOLDMAN SACHS: PRODUCT PORTFOLIO
TABLE 104. GOLDMAN SACHS: KEY STRATERGIES
TABLE 105. HSBC GROUP: KEY EXECUTIVES
TABLE 106. HSBC GROUP: COMPANY SNAPSHOT
TABLE 107. HSBC GROUP: SERVICE SEGMENTS
TABLE 108. HSBC GROUP: PRODUCT PORTFOLIO
TABLE 109. HSBC GROUP: KEY STRATERGIES
TABLE 110. JPMORGAN CHASE & CO.: KEY EXECUTIVES
TABLE 111. JPMORGAN CHASE & CO.: COMPANY SNAPSHOT
TABLE 112. JPMORGAN CHASE & CO.: PRODUCT SEGMENTS
TABLE 113. JPMORGAN CHASE & CO.: PRODUCT PORTFOLIO
TABLE 114. JPMORGAN CHASE & CO.: KEY STRATERGIES
TABLE 115. STANDARD CHARTERED: KEY EXECUTIVES
TABLE 116. STANDARD CHARTERED: COMPANY SNAPSHOT
TABLE 117. STANDARD CHARTERED: SERVICE SEGMENTS
TABLE 118. STANDARD CHARTERED: PRODUCT PORTFOLIO
TABLE 119. WESTERN UNION HOLDINGS: KEY EXECUTIVES
TABLE 120. WESTERN UNION HOLDINGS: COMPANY SNAPSHOT
TABLE 121. WESTERN UNION HOLDINGS: SERVICE SEGMENTS
TABLE 122. WESTERN UNION HOLDINGS: PRODUCT PORTFOLIO
TABLE 123. WESTERN UNION HOLDINGS: KEY STRATERGIES
TABLE 124. WELLS FARGO: KEY EXECUTIVES
TABLE 125. WELLS FARGO: COMPANY SNAPSHOT
TABLE 126. WELLS FARGO: SERVICE SEGMENTS
TABLE 127. WELLS FARGO: PRODUCT PORTFOLIO
TABLE 128. WELLS FARGO: KEY STRATERGIES LIST OF FIGURES
FIGURE 01. FOREIGN EXCHANGE SERVICES MARKET, 2021-2031
FIGURE 02. SEGMENTATION OF FOREIGN EXCHANGE SERVICES MARKET, 2021-2031
FIGURE 03. TOP INVESTMENT POCKETS IN FOREIGN EXCHANGE SERVICES MARKET (2022-2031)
FIGURE 04. MODERATE BARGAINING POWER OF SUPPLIERS
FIGURE 05. LOW BARGAINING POWER OF BUYERS
FIGURE 06. MODERATE THREAT OF SUBSTITUTES
FIGURE 07. HIGH THREAT OF NEW ENTRANTS
FIGURE 08. MODERATE INTENSITY OF RIVALRY
FIGURE 09. DRIVERS, RESTRAINTS AND OPPORTUNITIES: GLOBALFOREIGN EXCHANGE SERVICES MARKET
FIGURE 10. FOREIGN EXCHANGE SERVICES MARKET, BY SERVICES, 2021(%)
FIGURE 11. COMPARATIVE SHARE ANALYSIS OF FOREIGN EXCHANGE SERVICES MARKET FOR CURRENCY EXCHANGE, BY COUNTRY 2021 AND 2031(%)
FIGURE 12. COMPARATIVE SHARE ANALYSIS OF FOREIGN EXCHANGE SERVICES MARKET FOR REMITTANCE SERVICES, BY COUNTRY 2021 AND 2031(%)
FIGURE 13. COMPARATIVE SHARE ANALYSIS OF FOREIGN EXCHANGE SERVICES MARKET FOR FOREIGN CURRENCY ACCOUNTS, BY COUNTRY 2021 AND 2031(%)
FIGURE 14. COMPARATIVE SHARE ANALYSIS OF FOREIGN EXCHANGE SERVICES MARKET FOR OTHERS, BY COUNTRY 2021 AND 2031(%)
FIGURE 15. FOREIGN EXCHANGE SERVICES MARKET, BY PROVIDERS, 2021(%)
FIGURE 16. COMPARATIVE SHARE ANALYSIS OF FOREIGN EXCHANGE SERVICES MARKET FOR BANKS, BY COUNTRY 2021 AND 2031(%)
FIGURE 17. COMPARATIVE SHARE ANALYSIS OF FOREIGN EXCHANGE SERVICES MARKET FOR MONEY TRANSFER OPERATORS, BY COUNTRY 2021 AND 2031(%)
FIGURE 18. COMPARATIVE SHARE ANALYSIS OF FOREIGN EXCHANGE SERVICES MARKET FOR OTHERS, BY COUNTRY 2021 AND 2031(%)
FIGURE 19. FOREIGN EXCHANGE SERVICES MARKET, BY APPLICATION, 2021(%)
FIGURE 20. COMPARATIVE SHARE ANALYSIS OF FOREIGN EXCHANGE SERVICES MARKET FOR BUSINESSES, BY COUNTRY 2021 AND 2031(%)
FIGURE 21. COMPARATIVE SHARE ANALYSIS OF FOREIGN EXCHANGE SERVICES MARKET FOR INDIVIDUALS, BY COUNTRY 2021 AND 2031(%)
FIGURE 22. FOREIGN EXCHANGE SERVICES MARKET BY REGION, 2021
FIGURE 23. U.S. FOREIGN EXCHANGE SERVICES MARKET, 2021-2031 ($MILLION)
FIGURE 24. CANADA FOREIGN EXCHANGE SERVICES MARKET, 2021-2031 ($MILLION)
FIGURE 25. UK FOREIGN EXCHANGE SERVICES MARKET, 2021-2031 ($MILLION)
FIGURE 26. GERMANY FOREIGN EXCHANGE SERVICES MARKET, 2021-2031 ($MILLION)
FIGURE 27. FRANCE FOREIGN EXCHANGE SERVICES MARKET, 2021-2031 ($MILLION)
FIGURE 28. ITALY FOREIGN EXCHANGE SERVICES MARKET, 2021-2031 ($MILLION)
FIGURE 29. SPAIN FOREIGN EXCHANGE SERVICES MARKET, 2021-2031 ($MILLION)
FIGURE 30. REST OF EUROPE FOREIGN EXCHANGE SERVICES MARKET, 2021-2031 ($MILLION)
FIGURE 31. CHINA FOREIGN EXCHANGE SERVICES MARKET, 2021-2031 ($MILLION)
FIGURE 32. JAPAN FOREIGN EXCHANGE SERVICES MARKET, 2021-2031 ($MILLION)
FIGURE 33. INDIA FOREIGN EXCHANGE SERVICES MARKET, 2021-2031 ($MILLION)
FIGURE 34. AUSTRALIA FOREIGN EXCHANGE SERVICES MARKET, 2021-2031 ($MILLION)
FIGURE 35. SOUTH KOREA FOREIGN EXCHANGE SERVICES MARKET, 2021-2031 ($MILLION)
FIGURE 36. REST OF ASIA-PACIFIC FOREIGN EXCHANGE SERVICES MARKET, 2021-2031 ($MILLION)
FIGURE 37. LATIN AMERICA FOREIGN EXCHANGE SERVICES MARKET, 2021-2031 ($MILLION)
FIGURE 38. MIDDLE EAST FOREIGN EXCHANGE SERVICES MARKET, 2021-2031 ($MILLION)
FIGURE 39. AFRICA FOREIGN EXCHANGE SERVICES MARKET, 2021-2031 ($MILLION)
FIGURE 40. TOP WINNING STRATEGIES, BY YEAR
FIGURE 41. TOP WINNING STRATEGIES, BY DEVELOPMENT
FIGURE 42. TOP WINNING STRATEGIES, BY COMPANY
FIGURE 43. PRODUCT MAPPING OF TOP 10 PLAYERS
FIGURE 44. COMPETITIVE DASHBOARD
FIGURE 45. COMPETITIVE HEATMAP: FOREIGN EXCHANGE SERVICES MARKET
FIGURE 46. TOP PLAYER POSITIONING, 2021
FIGURE 47. AMERICAN EXPRESS COMPANY: NET REVENUE, 2019-2021 ($MILLION)
FIGURE 48. AMERICAN EXPRESS COMPANY: REVENUE SHARE BY SEGMENT, 2021 (%)
FIGURE 49. AMERICAN EXPRESS COMPANY: REVENUE SHARE BY REGION, 2021 (%)
FIGURE 50. BARCLAYS: NET REVENUE, 2019-2021 ($MILLION)
FIGURE 51. CITIGROUP INC.: NET REVENUE, 2019-2021 ($MILLION)
FIGURE 52. CITIGROUP INC.: REVENUE SHARE BY SEGMENT, 2021 (%)
FIGURE 53. CITIGROUP INC.: REVENUE SHARE BY REGION, 2021 (%)
FIGURE 54. DEUTSCHE BANK AG: NET REVENUE, 2019-2021 ($MILLION)
FIGURE 55. DEUTSCHE BANK AG: REVENUE SHARE BY SEGMENT, 2021 (%)
FIGURE 56. DEUTSCHE BANK AG: REVENUE SHARE BY REGION, 2021 (%)
FIGURE 57. GOLDMAN SACHS: NET REVENUE, 2019-2021 ($MILLION)
FIGURE 58. GOLDMAN SACHS: REVENUE SHARE BY SEGMENT, 2021 (%)
FIGURE 59. GOLDMAN SACHS: REVENUE SHARE BY REGION, 2021 (%)
FIGURE 60. HSBC GROUP: NET REVENUE, 2019-2021 ($MILLION)
FIGURE 61. HSBC GROUP: REVENUE SHARE BY SEGMENT, 2021 (%)
FIGURE 62. HSBC GROUP: REVENUE SHARE BY REGION, 2021 (%)
FIGURE 63. JPMORGAN CHASE & CO.: NET REVENUE, 2019-2021 ($MILLION)
FIGURE 64. STANDARD CHARTERED: NET REVENUE, 2019-2021 ($MILLION)
FIGURE 65. STANDARD CHARTERED: REVENUE SHARE BY SEGMENT, 2021 (%)
FIGURE 66. STANDARD CHARTERED: REVENUE SHARE BY REGION, 2021 (%)
FIGURE 67. WESTERN UNION HOLDINGS: NET REVENUE, 2019-2021 ($MILLION)
FIGURE 68. WESTERN UNION HOLDINGS: REVENUE SHARE BY SEGMENT, 2021 (%)
FIGURE 69. WESTERN UNION HOLDINGS: REVENUE SHARE BY REGION, 2021 (%)
FIGURE 70. WELLS FARGO: NET REVENUE, 2019-2021 ($MILLION)
FIGURE 71. WELLS FARGO: REVENUE SHARE BY SEGMENT, 2021 (%
SELECT A FORMAT
Added to Cart
Electronic (PDF)

$5730

This license allows only one user to access the PDF.
Electronic (PDF)

$6450

This license allows 1 - 5 user to access the PDF, license is suitable for small groups of 5 users working together
Electronic (PDF)

$9600

This license allows users/teams in a same Enterprise to use this report, various departments within an enterpise can use this report
Electronic (PDF)

$3840

This license just provides quantitative data in a excel sheet
Add to Cart
Buy Now (15% Discount)

OUR CUSTOMER

Nano String

SIMILAR REPORTS