0
U.S. (TOLL FREE)
+1 (315) 215-3225
Automative

0
U.S. (TOLL FREE)
+1 (315) 215-3225
Cruise Tourism Market By Type (River Cruise, Ocean Cruise, Expedition Cruise, Theme Cruise, Adventure Cruise, Others), By Duration (1-3 days, 4-6 days, 7 days, 8 to 13 days, 14 days, 15-20 days, More than 21 days), By Passenger Age (Less than 12 Years, 13-19 Years, 20-29 Years, 30-39 years, 40-49 years, 50-59 years, Above 60 years): Global Opportunity Analysis and Industry Forecast, 2021-2031
Published Date: April 2023
|
Report Code: ALLI-Auto-1J953
Home | Market Reports | Travel| Cruises & Charters
Cruise Tourism Market By Type River Cruise Ocean Cruise Expedition Cruise Theme Cruise Adventure Cruise Others By Duration 1 3 days 4 6 days 7 days 8 to 13 days 14 days 15 20 days More than 21 days By Passenger Age Less than 12 Years 13 19 Years 20 29 Years 30 39 years 40 49 years 50 59 years Above 60 years Global Opportunity Analysis and Industry Forecast 2021 2031
BUY CHAPTERS

Cruise Tourism Market By Type (River Cruise, Ocean Cruise, Expedition Cruise, Theme Cruise, Adventure Cruise, Others), By Duration (1-3 days, 4-6 days, 7 days, 8 to 13 days, 14 days, 15-20 days, More than 21 days), By Passenger Age (Less than 12 Years, 13-19 Years, 20-29 Years, 30-39 years, 40-49 years, 50-59 years, Above 60 years): Global Opportunity Analysis and Industry Forecast, 2021-2031

Code: ALLI-Auto-1J953
Report
April 2023
Pages:290
Allied Market Research
Buy Now with 15% Discount
DESCRIPTION
TABLE OF CONTENT
TABLES & FIGURES

Cruise Tourism Market Size

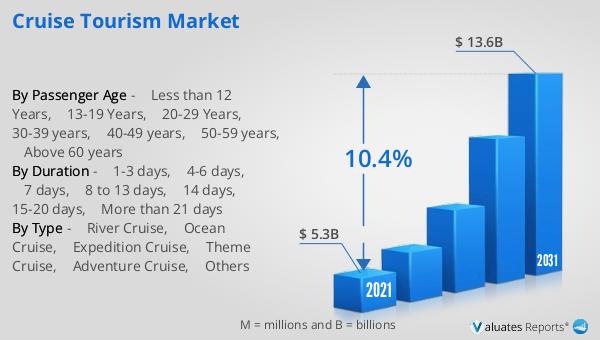
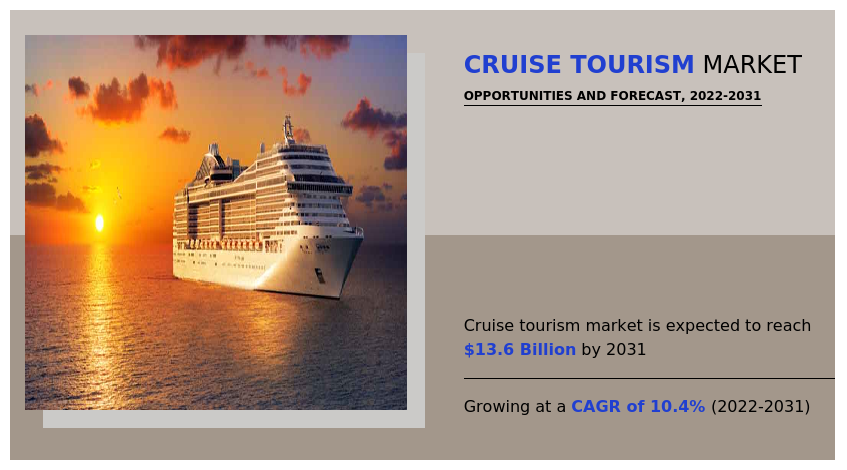
According to a new report published by , titled, “Cruise Tourism Market," The cruise tourism market was valued at $5.3 billion in 2021, and is estimated to reach $13.6 billion by 2031, growing at a CAGR of 10.4% from 2022 to 2031. 

Cruise Tourism Market

Cruise Tourism Market

Cruise tourism is a form of enclave tourism that offers accommodation, hospitality services, and an all-inclusive holiday on a cruise. Cruise tourism enables travelers to experience a multi-center holiday during which the travelers can spend time at multiple ports or destinations during their trip. The cruise ships used for tourism can vary from small yachts to mega-ships. Cruise tourism is quite popular Caribbean, Arctic, and Mediterranean destinations.
The cruise tourism market growth is driven by rapid growth in the tourism sector. Cruise shipping is regarded as one of the fastest growing and dynamic industry in the world. This is because cruise tourism help travelers in exploring unseen or untouched places on the earth in their natural habitat. For instance, during cruise shipping, the travelers can enjoy mesmerizing coastlines, idyllic islands, along with historical and cultural heritage of any country. Rise in the number of middle class-population, rise in disposable income have led to increase in spending on leisure activities which is driving the cruise tourism industry demand in the recent years. Various initiatives have been taken by several countries across the world to boost the cruise tourism sector. For instance, in India, The Cruise Shipping Policy of the Ministry of Shipping, has been into existence since 2008.  This policy aims to make India the attractive cruise tourism destination that will attract large number of domestic as well as foreign travelers.
The availability of distinct forms of cruise tourism such as expedition cruises, theme cruises, sea cruises, river cruises, transit cruises, and others is anticipated to drive the cruise tourism market share during the analysis timeframe. For instance, expedition cruises involve target group of people comprising of highly educated, curious, adventurous, and nature-focused individuals. Additionally, theme cruises are becoming quite popular as these cruises are based on specific themes throughout the journey. Some of examples of theme cruises are cooking cruises, golfing cruises, wine cruises, music & celebrity cruises, and others. These theme-cruises are quite popular among Generation Z and millennials. Some of the popular theme cruises in the world are sci-fi sea cruises, poker cruises, dance cruises, Disney theme cruises, and others.
Financial crisis and natural disasters such as tsunamis, terrorist attacks, and others that cannot be controlled by humans is estimated to restrain the growth of cruise tourism market. Additionally, the uncertainties led by COVID-19 pandemic have led to drastic decline in the number of travelers especially for cruise tourism. As per our secondary analysis, during the COVID-19 pandemic the cruise passenger traffic has been reduced by almost 80.2% resulting in huge revenue losses.
Cruise tourism is one of the fastest evolving tourism sector with Caribbean Island being most demanded and visited cruise destination. The Caribbean islands stand out of all cruise destinations owing to their stereotyped perception of paradise that is composed of scenic views of sand, sun, and sea. Additionally, various initiatives taken by the regulatory authorities is driving the cruise tourism market size. For instance, India International Cruise Conference was held in 2022 to provide an impetus to the tourism industry.  The aim of this conference was to boost the cruise passenger traffic and to develop the economic potential of cruise tourism in the coming years. The government of India have also set up a Task Force for the development of cruise tourism.  Additionally, initiatives such as modernization of ports, lighthouse and island development, Namami Gange Project to clean the river and to boost the river cruise tourism has been implemented.
The cruise tourism market is segmented on the basis of type, duration, passenger age, and region. By type, the market is divided into river cruise, ocean cruise, expedition cruise, theme cruise, adventure cruise, and others. Based on the duration, the market is classified into 1-3 days, 4-6 days, 7 days, 8 to 13 days, 14 days, 15-20 days, and more than 21 days. By passenger age, the market is divided into less than 12 years, 13-19 years, 20-29 years, 30-39 years, 40-49 years, 50-59 years, and above 60 years. Region wise, it is analyzed across North America (the U.S., Canada, and Mexico), Europe (Germany, UK, France, Spain, Italy, and Rest of Europe), Asia-Pacific (China, Thailand, India, South Korea, Malaysia, and rest of Asia-Pacific), and LAMEA (Brazil, Saudi Arabia, UAE, South Africa, and rest of LAMEA).
The key players profiled in the study include Ambassador Cruise Holidays Limited., AmaWaterways, Carnival Corporation & plc, PONANT, Cosmos Tours Ltd., Kerala Shipping and Inland Navigation Corporation Ltd, Mediterranean Shipping Company S.A., Norwegian Cruise Line, Silversea Cruises, and Seabourn Cruise Line. The major players in the market have been actively engaged in the adoption of various strategies such as acquisition, business expansion, technological advancements, and new initiatives. For instance, in March 2023, Ambassador Cruise Holidays Limited., the leading company in cruise tourism, has taken a new initiative to launch new spring offers with free cabin upgrades, wide range of itineraries, and seasonal offers.
Key Market Insights
By type, the ocean cruise segment was the highest revenue contributor to the market in 2021 and is estimated to be the fastest growing during the forecast period
By duration, the 7 days segment was the highest revenue contributor to the market in 2021 and it is projected to be the fastest growing during the forecast period
By passenger age, the 40-49 years segment was the highest revenue contributor to the market in 2021 and 30-39 years segment is predicted to be the fastest growing during the forecast period
Based on region, North America was the highest revenue contributor in the market in 2021, accounting for $2,538.6, and is anticipated to generate a CAGR of 10.7% during the forecast period

Overview

The global cruise tourism market was valued at $5,288.8 million in 2021 and is projected to grow with a CAGR of 10.4%, by generating revenue of $13,641.4 million by 2031.  Cruise tourism is a popular form of tourism that provides travelers with exotic view of the picturesque destinations in the world. The U.S., Europe, and Southeast Asian countries are popular cruise tourism destinations in the world. For instance, Singapore the island city is one of the well-known destinations for cruise tourism that attracts large number of travelers globally. This is because Singapore is an easily navigable city with large number of exploration sites that amaze the travelers. There are a large number of cruise tourism companies operating globally. Some of these are Cunard, Royal Caribbean, Norwegian Cruise Line, P&O Cruises, Princess Cruises, and others.
The growing popularity of river cruising and ocean cruising is anticipated to drive the cruise tourism market growth. Some of the world-famous rivers opted by the travelers for cruising are Douro, Danube, Rhone, Rhine, Main, Mekong, Seine, and others. Cruise tourism companies offer all-inclusive luxury cruising experience to the travelers that comprises scenic sun lounges, wellness programs, excellent meals, premium international drinks, and personalized experiences to the readers.
The environmental impact associated with cruise tourism that leads to air and water pollution owing to emission of harmful gases such as carbon dioxide is estimated to hamper the cruise tourism market growth in the coming years.
Increase in the number of passengers opting for cruise tourism is anticipated to generate excellent opportunity in the market. Additionally, the availability of diverse cruise tourism types such as expedition cruise, river cruise, sea cruise, mini cruise, theme cruise, world cruise, and others is projected to drive the market growth. For instance, sea cruises are quite popular and cover larger distances. They offer a wide range of facilities and amenities onboard for the passengers. Expedition cruises are usually meant for small group of people that comprises nature-focused adventurous individuals, and highly-focused professionals. Similarly, on river cruise, people can spend several nights enjoying the natural and scenic beauty of any location that they are visiting.
Globally, the onset of COVID-19 pandemic had a drastic impact on the cruise tourism sector that resulted in the halt in the tourism activities due to a ban on unnecessary travel. All the ports, ships, and cruises were closed owing to lockdown restrictions that has resulted in huge financial losses for the cruise companies. Also, ban on unnecessary travel has resulted in drastic decline in the number of travelers across the globe. Cruise tourism is a capital intensive sector and due to economic uncertainties, many cruise tourism companies had to shut down their operations resulting in job losses. Hence, the COVID-19 pandemic has a huge impact on the cruise tourism market growth.
The key players profiled in this report include Ambassador Cruise Holidays Limited., AmaWaterways, Carnival Corporation & plc, PONANT, Cosmos Tours Ltd., Kerala Shipping and Inland Navigation Corporation Ltd, Mediterranean Shipping Company S.A., Norwegian Cruise Line, Silversea Cruises, and Seabourn Cruise Line.

Key Benefits For Stakeholders

●This report provides a quantitative analysis of the market segments, current trends, estimations, and dynamics of the cruise tourism market analysis from 2021 to 2031 to identify the prevailing cruise tourism market opportunities.
●The market research is offered along with information related to key drivers, restraints, and opportunities.
●Porter's five forces analysis highlights the potency of buyers and suppliers to enable stakeholders make profit-oriented business decisions and strengthen their supplier-buyer network.
●In-depth analysis of the cruise tourism market segmentation assists to determine the prevailing market opportunities.
●Major countries in each region are mapped according to their revenue contribution to the global market.
●Market player positioning facilitates benchmarking and provides a clear understanding of the present position of the market players.
●The report includes the analysis of the regional as well as global cruise tourism market trends, key players, market segments, application areas, and market growth strategies.
Key Market Segments
○ Norwegian Cruise Lin

Scope of Cruise Tourism Market Report

Report Metric Details
Report Name Cruise Tourism Market
Accounted market size in 2021 $ 5.3 billion
Forecasted market size in 2031 $ 13.6 billion
CAGR 10.4%
Base Year 2021
Forecasted years 2024 - 2031
By Type ● River Cruise
● Ocean Cruise
● Expedition Cruise
● Theme Cruise
● Adventure Cruise
● Others
By Duration ● 1-3 days
● 4-6 days
● 7 days
● 8 to 13 days
● 14 days
● 15-20 days
● More than 21 days
By Passenger Age ● Less than 12 Years
● 13-19 Years
● 20-29 Years
● 30-39 years
● 40-49 years
● 50-59 years
● Above 60 years
By Region
  • North America (United States, Canada)
  • Europe (Germany, France, UK, Italy, Russia) Rest of Europe
  • Nordic Countries
  • Asia-Pacific (China, Japan, South Korea)
  • Southeast Asia (India, Australia)
  • Rest of Asia
  • Latin America (Mexico, Brazil)
  • Rest of Latin America
  • Middle East & Africa (Turkey, Saudi Arabia, UAE, Rest of MEA)
Forecast units USD million in value
Report coverage Revenue and volume forecast, company share, competitive landscape, growth factors and trends

FAQ for this report

How fast is Cruise Tourism Market growing?

Ans: The Cruise Tourism Market witnessing a CAGR of 10.4% during the forecast period 2024-2031.

What is the Cruise Tourism Market size in 2031?

Ans: The Cruise Tourism Market size in 2031 will be $ 13.6 billion.

What are the Type segmentation covered in the Cruise Tourism Market report?

Ans: The Types covered in the Cruise Tourism Market report are ● River Cruise, ● Ocean Cruise, ● Expedition Cruise, ● Theme Cruise, ● Adventure Cruise, ● Others

CHAPTER 1: INTRODUCTION
1.1. Report description
1.2. Key market segments
1.3. Key benefits to the stakeholders
1.4. Research Methodology
1.4.1. Primary research
1.4.2. Secondary research
1.4.3. Analyst tools and models
CHAPTER 2: EXECUTIVE SUMMARY
2.1. CXO Perspective
CHAPTER 3: MARKET OVERVIEW
3.1. Market definition and scope
3.2. Key findings
3.2.1. Top impacting factors
3.2.2. Top investment pockets
3.3. Porter’s five forces analysis
3.4. Market dynamics
3.4.1. Drivers
3.4.2. Restraints
3.4.3. Opportunities
3.5. COVID-19 Impact Analysis on the market
3.6. Brand Share Analysis
3.7. Key Regulation Analysis
3.8. Market Share Analysis
3.9. Patent Landscape
3.10. Regulatory Guidelines
3.11. Value Chain Analysis
CHAPTER 4: CRUISE TOURISM MARKET, BY TYPE
4.1. Overview
4.1.1. Market size and forecast
4.2. River Cruise
4.2.1. Key market trends, growth factors and opportunities
4.2.2. Market size and forecast, by region
4.2.3. Market share analysis by country
4.3. Ocean Cruise
4.3.1. Key market trends, growth factors and opportunities
4.3.2. Market size and forecast, by region
4.3.3. Market share analysis by country
4.4. Expedition Cruise
4.4.1. Key market trends, growth factors and opportunities
4.4.2. Market size and forecast, by region
4.4.3. Market share analysis by country
4.5. Theme Cruise
4.5.1. Key market trends, growth factors and opportunities
4.5.2. Market size and forecast, by region
4.5.3. Market share analysis by country
4.6. Adventure Cruise
4.6.1. Key market trends, growth factors and opportunities
4.6.2. Market size and forecast, by region
4.6.3. Market share analysis by country
4.7. Others
4.7.1. Key market trends, growth factors and opportunities
4.7.2. Market size and forecast, by region
4.7.3. Market share analysis by country
CHAPTER 5: CRUISE TOURISM MARKET, BY DURATION
5.1. Overview
5.1.1. Market size and forecast
5.2. 1-3 days
5.2.1. Key market trends, growth factors and opportunities
5.2.2. Market size and forecast, by region
5.2.3. Market share analysis by country
5.3. 4-6 days
5.3.1. Key market trends, growth factors and opportunities
5.3.2. Market size and forecast, by region
5.3.3. Market share analysis by country
5.4. 7 days
5.4.1. Key market trends, growth factors and opportunities
5.4.2. Market size and forecast, by region
5.4.3. Market share analysis by country
5.5. 8 to 13 days
5.5.1. Key market trends, growth factors and opportunities
5.5.2. Market size and forecast, by region
5.5.3. Market share analysis by country
5.6. 14 days
5.6.1. Key market trends, growth factors and opportunities
5.6.2. Market size and forecast, by region
5.6.3. Market share analysis by country
5.7. 15-20 days
5.7.1. Key market trends, growth factors and opportunities
5.7.2. Market size and forecast, by region
5.7.3. Market share analysis by country
5.8. More than 21 days
5.8.1. Key market trends, growth factors and opportunities
5.8.2. Market size and forecast, by region
5.8.3. Market share analysis by country
CHAPTER 6: CRUISE TOURISM MARKET, BY PASSENGER AGE
6.1. Overview
6.1.1. Market size and forecast
6.2. Less than 12 Years
6.2.1. Key market trends, growth factors and opportunities
6.2.2. Market size and forecast, by region
6.2.3. Market share analysis by country
6.3. 13-19 Years
6.3.1. Key market trends, growth factors and opportunities
6.3.2. Market size and forecast, by region
6.3.3. Market share analysis by country
6.4. 20-29 Years
6.4.1. Key market trends, growth factors and opportunities
6.4.2. Market size and forecast, by region
6.4.3. Market share analysis by country
6.5. 30-39 years
6.5.1. Key market trends, growth factors and opportunities
6.5.2. Market size and forecast, by region
6.5.3. Market share analysis by country
6.6. 40-49 years
6.6.1. Key market trends, growth factors and opportunities
6.6.2. Market size and forecast, by region
6.6.3. Market share analysis by country
6.7. 50-59 years
6.7.1. Key market trends, growth factors and opportunities
6.7.2. Market size and forecast, by region
6.7.3. Market share analysis by country
6.8. Above 60 years
6.8.1. Key market trends, growth factors and opportunities
6.8.2. Market size and forecast, by region
6.8.3. Market share analysis by country
CHAPTER 7: CRUISE TOURISM MARKET, BY REGION
7.1. Overview
7.1.1. Market size and forecast By Region
7.2. North America
7.2.1. Key trends and opportunities
7.2.2. Market size and forecast, by Type
7.2.3. Market size and forecast, by Duration
7.2.4. Market size and forecast, by Passenger Age
7.2.5. Market size and forecast, by country
7.2.5.1. U.S.
7.2.5.1.1. Key market trends, growth factors and opportunities
7.2.5.1.2. Market size and forecast, by Type
7.2.5.1.3. Market size and forecast, by Duration
7.2.5.1.4. Market size and forecast, by Passenger Age
7.2.5.2. Canada
7.2.5.2.1. Key market trends, growth factors and opportunities
7.2.5.2.2. Market size and forecast, by Type
7.2.5.2.3. Market size and forecast, by Duration
7.2.5.2.4. Market size and forecast, by Passenger Age
7.2.5.3. Mexico
7.2.5.3.1. Key market trends, growth factors and opportunities
7.2.5.3.2. Market size and forecast, by Type
7.2.5.3.3. Market size and forecast, by Duration
7.2.5.3.4. Market size and forecast, by Passenger Age
7.3. Europe
7.3.1. Key trends and opportunities
7.3.2. Market size and forecast, by Type
7.3.3. Market size and forecast, by Duration
7.3.4. Market size and forecast, by Passenger Age
7.3.5. Market size and forecast, by country
7.3.5.1. Germany
7.3.5.1.1. Key market trends, growth factors and opportunities
7.3.5.1.2. Market size and forecast, by Type
7.3.5.1.3. Market size and forecast, by Duration
7.3.5.1.4. Market size and forecast, by Passenger Age
7.3.5.2. UK
7.3.5.2.1. Key market trends, growth factors and opportunities
7.3.5.2.2. Market size and forecast, by Type
7.3.5.2.3. Market size and forecast, by Duration
7.3.5.2.4. Market size and forecast, by Passenger Age
7.3.5.3. France
7.3.5.3.1. Key market trends, growth factors and opportunities
7.3.5.3.2. Market size and forecast, by Type
7.3.5.3.3. Market size and forecast, by Duration
7.3.5.3.4. Market size and forecast, by Passenger Age
7.3.5.4. Spain
7.3.5.4.1. Key market trends, growth factors and opportunities
7.3.5.4.2. Market size and forecast, by Type
7.3.5.4.3. Market size and forecast, by Duration
7.3.5.4.4. Market size and forecast, by Passenger Age
7.3.5.5. Italy
7.3.5.5.1. Key market trends, growth factors and opportunities
7.3.5.5.2. Market size and forecast, by Type
7.3.5.5.3. Market size and forecast, by Duration
7.3.5.5.4. Market size and forecast, by Passenger Age
7.3.5.6. Rest of Europe
7.3.5.6.1. Key market trends, growth factors and opportunities
7.3.5.6.2. Market size and forecast, by Type
7.3.5.6.3. Market size and forecast, by Duration
7.3.5.6.4. Market size and forecast, by Passenger Age
7.4. Asia-Pacific
7.4.1. Key trends and opportunities
7.4.2. Market size and forecast, by Type
7.4.3. Market size and forecast, by Duration
7.4.4. Market size and forecast, by Passenger Age
7.4.5. Market size and forecast, by country
7.4.5.1. China
7.4.5.1.1. Key market trends, growth factors and opportunities
7.4.5.1.2. Market size and forecast, by Type
7.4.5.1.3. Market size and forecast, by Duration
7.4.5.1.4. Market size and forecast, by Passenger Age
7.4.5.2. Thailand
7.4.5.2.1. Key market trends, growth factors and opportunities
7.4.5.2.2. Market size and forecast, by Type
7.4.5.2.3. Market size and forecast, by Duration
7.4.5.2.4. Market size and forecast, by Passenger Age
7.4.5.3. India
7.4.5.3.1. Key market trends, growth factors and opportunities
7.4.5.3.2. Market size and forecast, by Type
7.4.5.3.3. Market size and forecast, by Duration
7.4.5.3.4. Market size and forecast, by Passenger Age
7.4.5.4. South Korea
7.4.5.4.1. Key market trends, growth factors and opportunities
7.4.5.4.2. Market size and forecast, by Type
7.4.5.4.3. Market size and forecast, by Duration
7.4.5.4.4. Market size and forecast, by Passenger Age
7.4.5.5. Malaysia
7.4.5.5.1. Key market trends, growth factors and opportunities
7.4.5.5.2. Market size and forecast, by Type
7.4.5.5.3. Market size and forecast, by Duration
7.4.5.5.4. Market size and forecast, by Passenger Age
7.4.5.6. Rest of Asia-Pacific
7.4.5.6.1. Key market trends, growth factors and opportunities
7.4.5.6.2. Market size and forecast, by Type
7.4.5.6.3. Market size and forecast, by Duration
7.4.5.6.4. Market size and forecast, by Passenger Age
7.5. LAMEA
7.5.1. Key trends and opportunities
7.5.2. Market size and forecast, by Type
7.5.3. Market size and forecast, by Duration
7.5.4. Market size and forecast, by Passenger Age
7.5.5. Market size and forecast, by country
7.5.5.1. Brazil
7.5.5.1.1. Key market trends, growth factors and opportunities
7.5.5.1.2. Market size and forecast, by Type
7.5.5.1.3. Market size and forecast, by Duration
7.5.5.1.4. Market size and forecast, by Passenger Age
7.5.5.2. United Arab Emirates
7.5.5.2.1. Key market trends, growth factors and opportunities
7.5.5.2.2. Market size and forecast, by Type
7.5.5.2.3. Market size and forecast, by Duration
7.5.5.2.4. Market size and forecast, by Passenger Age
7.5.5.3. Saudi Arabia
7.5.5.3.1. Key market trends, growth factors and opportunities
7.5.5.3.2. Market size and forecast, by Type
7.5.5.3.3. Market size and forecast, by Duration
7.5.5.3.4. Market size and forecast, by Passenger Age
7.5.5.4. South Africa
7.5.5.4.1. Key market trends, growth factors and opportunities
7.5.5.4.2. Market size and forecast, by Type
7.5.5.4.3. Market size and forecast, by Duration
7.5.5.4.4. Market size and forecast, by Passenger Age
7.5.5.5. Rest of LAMEA
7.5.5.5.1. Key market trends, growth factors and opportunities
7.5.5.5.2. Market size and forecast, by Type
7.5.5.5.3. Market size and forecast, by Duration
7.5.5.5.4. Market size and forecast, by Passenger Age
CHAPTER 8: COMPETITIVE LANDSCAPE
8.1. Introduction
8.2. Top winning strategies
8.3. Product Mapping of Top 10 Player
8.4. Competitive Dashboard
8.5. Competitive Heatmap
8.6. Top player positioning, 2021
CHAPTER 9: COMPANY PROFILES
9.1. Silversea Cruises
9.1.1. Company overview
9.1.2. Key Executives
9.1.3. Company snapshot
9.2. seabourn cruise line
9.2.1. Company overview
9.2.2. Key Executives
9.2.3. Company snapshot
9.3. Ambassador Cruise Holidays Limited.
9.3.1. Company overview
9.3.2. Key Executives
9.3.3. Company snapshot
9.4. AmaWaterways
9.4.1. Company overview
9.4.2. Key Executives
9.4.3. Company snapshot
9.5. Carnival Corporation & plc
9.5.1. Company overview
9.5.2. Key Executives
9.5.3. Company snapshot
9.6. Cosmos Tours Ltd.
9.6.1. Company overview
9.6.2. Key Executives
9.6.3. Company snapshot
9.7. Kerala Shipping and Inland Navigation Corporation Ltd
9.7.1. Company overview
9.7.2. Key Executives
9.7.3. Company snapshot
9.8. PONANT
9.8.1. Company overview
9.8.2. Key Executives
9.8.3. Company snapshot
9.9. Mediterranean Shipping Company S.A.
9.9.1. Company overview
9.9.2. Key Executives
9.9.3. Company snapshot
9.10. Norwegian Cruise Line
9.10.1. Company overview
9.10.2. Key Executives
9.10.3. Company snapsho
LIST OF TABLES
TABLE 01. GLOBAL CRUISE TOURISM MARKET, BY TYPE, 2021-2031 ($MILLION)
TABLE 02. CRUISE TOURISM MARKET FOR RIVER CRUISE, BY REGION, 2021-2031 ($MILLION)
TABLE 03. CRUISE TOURISM MARKET FOR OCEAN CRUISE, BY REGION, 2021-2031 ($MILLION)
TABLE 04. CRUISE TOURISM MARKET FOR EXPEDITION CRUISE, BY REGION, 2021-2031 ($MILLION)
TABLE 05. CRUISE TOURISM MARKET FOR THEME CRUISE, BY REGION, 2021-2031 ($MILLION)
TABLE 06. CRUISE TOURISM MARKET FOR ADVENTURE CRUISE, BY REGION, 2021-2031 ($MILLION)
TABLE 07. CRUISE TOURISM MARKET FOR OTHERS, BY REGION, 2021-2031 ($MILLION)
TABLE 08. GLOBAL CRUISE TOURISM MARKET, BY DURATION, 2021-2031 ($MILLION)
TABLE 09. CRUISE TOURISM MARKET FOR 1-3 DAYS, BY REGION, 2021-2031 ($MILLION)
TABLE 10. CRUISE TOURISM MARKET FOR 4-6 DAYS, BY REGION, 2021-2031 ($MILLION)
TABLE 11. CRUISE TOURISM MARKET FOR 7 DAYS, BY REGION, 2021-2031 ($MILLION)
TABLE 12. CRUISE TOURISM MARKET FOR 8 TO 13 DAYS, BY REGION, 2021-2031 ($MILLION)
TABLE 13. CRUISE TOURISM MARKET FOR 14 DAYS, BY REGION, 2021-2031 ($MILLION)
TABLE 14. CRUISE TOURISM MARKET FOR 15-20 DAYS, BY REGION, 2021-2031 ($MILLION)
TABLE 15. CRUISE TOURISM MARKET FOR MORE THAN 21 DAYS, BY REGION, 2021-2031 ($MILLION)
TABLE 16. GLOBAL CRUISE TOURISM MARKET, BY PASSENGER AGE, 2021-2031 ($MILLION)
TABLE 17. CRUISE TOURISM MARKET FOR LESS THAN 12 YEARS, BY REGION, 2021-2031 ($MILLION)
TABLE 18. CRUISE TOURISM MARKET FOR 13-19 YEARS, BY REGION, 2021-2031 ($MILLION)
TABLE 19. CRUISE TOURISM MARKET FOR 20-29 YEARS, BY REGION, 2021-2031 ($MILLION)
TABLE 20. CRUISE TOURISM MARKET FOR 30-39 YEARS, BY REGION, 2021-2031 ($MILLION)
TABLE 21. CRUISE TOURISM MARKET FOR 40-49 YEARS, BY REGION, 2021-2031 ($MILLION)
TABLE 22. CRUISE TOURISM MARKET FOR 50-59 YEARS, BY REGION, 2021-2031 ($MILLION)
TABLE 23. CRUISE TOURISM MARKET FOR ABOVE 60 YEARS, BY REGION, 2021-2031 ($MILLION)
TABLE 24. CRUISE TOURISM MARKET, BY REGION, 2021-2031 ($MILLION)
TABLE 25. NORTH AMERICA CRUISE TOURISM MARKET, BY TYPE, 2021-2031 ($MILLION)
TABLE 26. NORTH AMERICA CRUISE TOURISM MARKET, BY DURATION, 2021-2031 ($MILLION)
TABLE 27. NORTH AMERICA CRUISE TOURISM MARKET, BY PASSENGER AGE, 2021-2031 ($MILLION)
TABLE 28. NORTH AMERICA CRUISE TOURISM MARKET, BY COUNTRY, 2021-2031 ($MILLION)
TABLE 29. U.S. CRUISE TOURISM MARKET, BY TYPE, 2021-2031 ($MILLION)
TABLE 30. U.S. CRUISE TOURISM MARKET, BY DURATION, 2021-2031 ($MILLION)
TABLE 31. U.S. CRUISE TOURISM MARKET, BY PASSENGER AGE, 2021-2031 ($MILLION)
TABLE 32. CANADA CRUISE TOURISM MARKET, BY TYPE, 2021-2031 ($MILLION)
TABLE 33. CANADA CRUISE TOURISM MARKET, BY DURATION, 2021-2031 ($MILLION)
TABLE 34. CANADA CRUISE TOURISM MARKET, BY PASSENGER AGE, 2021-2031 ($MILLION)
TABLE 35. MEXICO CRUISE TOURISM MARKET, BY TYPE, 2021-2031 ($MILLION)
TABLE 36. MEXICO CRUISE TOURISM MARKET, BY DURATION, 2021-2031 ($MILLION)
TABLE 37. MEXICO CRUISE TOURISM MARKET, BY PASSENGER AGE, 2021-2031 ($MILLION)
TABLE 38. EUROPE CRUISE TOURISM MARKET, BY TYPE, 2021-2031 ($MILLION)
TABLE 39. EUROPE CRUISE TOURISM MARKET, BY DURATION, 2021-2031 ($MILLION)
TABLE 40. EUROPE CRUISE TOURISM MARKET, BY PASSENGER AGE, 2021-2031 ($MILLION)
TABLE 41. EUROPE CRUISE TOURISM MARKET, BY COUNTRY, 2021-2031 ($MILLION)
TABLE 42. GERMANY CRUISE TOURISM MARKET, BY TYPE, 2021-2031 ($MILLION)
TABLE 43. GERMANY CRUISE TOURISM MARKET, BY DURATION, 2021-2031 ($MILLION)
TABLE 44. GERMANY CRUISE TOURISM MARKET, BY PASSENGER AGE, 2021-2031 ($MILLION)
TABLE 45. UK CRUISE TOURISM MARKET, BY TYPE, 2021-2031 ($MILLION)
TABLE 46. UK CRUISE TOURISM MARKET, BY DURATION, 2021-2031 ($MILLION)
TABLE 47. UK CRUISE TOURISM MARKET, BY PASSENGER AGE, 2021-2031 ($MILLION)
TABLE 48. FRANCE CRUISE TOURISM MARKET, BY TYPE, 2021-2031 ($MILLION)
TABLE 49. FRANCE CRUISE TOURISM MARKET, BY DURATION, 2021-2031 ($MILLION)
TABLE 50. FRANCE CRUISE TOURISM MARKET, BY PASSENGER AGE, 2021-2031 ($MILLION)
TABLE 51. SPAIN CRUISE TOURISM MARKET, BY TYPE, 2021-2031 ($MILLION)
TABLE 52. SPAIN CRUISE TOURISM MARKET, BY DURATION, 2021-2031 ($MILLION)
TABLE 53. SPAIN CRUISE TOURISM MARKET, BY PASSENGER AGE, 2021-2031 ($MILLION)
TABLE 54. ITALY CRUISE TOURISM MARKET, BY TYPE, 2021-2031 ($MILLION)
TABLE 55. ITALY CRUISE TOURISM MARKET, BY DURATION, 2021-2031 ($MILLION)
TABLE 56. ITALY CRUISE TOURISM MARKET, BY PASSENGER AGE, 2021-2031 ($MILLION)
TABLE 57. REST OF EUROPE CRUISE TOURISM MARKET, BY TYPE, 2021-2031 ($MILLION)
TABLE 58. REST OF EUROPE CRUISE TOURISM MARKET, BY DURATION, 2021-2031 ($MILLION)
TABLE 59. REST OF EUROPE CRUISE TOURISM MARKET, BY PASSENGER AGE, 2021-2031 ($MILLION)
TABLE 60. ASIA-PACIFIC CRUISE TOURISM MARKET, BY TYPE, 2021-2031 ($MILLION)
TABLE 61. ASIA-PACIFIC CRUISE TOURISM MARKET, BY DURATION, 2021-2031 ($MILLION)
TABLE 62. ASIA-PACIFIC CRUISE TOURISM MARKET, BY PASSENGER AGE, 2021-2031 ($MILLION)
TABLE 63. ASIA-PACIFIC CRUISE TOURISM MARKET, BY COUNTRY, 2021-2031 ($MILLION)
TABLE 64. CHINA CRUISE TOURISM MARKET, BY TYPE, 2021-2031 ($MILLION)
TABLE 65. CHINA CRUISE TOURISM MARKET, BY DURATION, 2021-2031 ($MILLION)
TABLE 66. CHINA CRUISE TOURISM MARKET, BY PASSENGER AGE, 2021-2031 ($MILLION)
TABLE 67. THAILAND CRUISE TOURISM MARKET, BY TYPE, 2021-2031 ($MILLION)
TABLE 68. THAILAND CRUISE TOURISM MARKET, BY DURATION, 2021-2031 ($MILLION)
TABLE 69. THAILAND CRUISE TOURISM MARKET, BY PASSENGER AGE, 2021-2031 ($MILLION)
TABLE 70. INDIA CRUISE TOURISM MARKET, BY TYPE, 2021-2031 ($MILLION)
TABLE 71. INDIA CRUISE TOURISM MARKET, BY DURATION, 2021-2031 ($MILLION)
TABLE 72. INDIA CRUISE TOURISM MARKET, BY PASSENGER AGE, 2021-2031 ($MILLION)
TABLE 73. SOUTH KOREA CRUISE TOURISM MARKET, BY TYPE, 2021-2031 ($MILLION)
TABLE 74. SOUTH KOREA CRUISE TOURISM MARKET, BY DURATION, 2021-2031 ($MILLION)
TABLE 75. SOUTH KOREA CRUISE TOURISM MARKET, BY PASSENGER AGE, 2021-2031 ($MILLION)
TABLE 76. MALAYSIA CRUISE TOURISM MARKET, BY TYPE, 2021-2031 ($MILLION)
TABLE 77. MALAYSIA CRUISE TOURISM MARKET, BY DURATION, 2021-2031 ($MILLION)
TABLE 78. MALAYSIA CRUISE TOURISM MARKET, BY PASSENGER AGE, 2021-2031 ($MILLION)
TABLE 79. REST OF ASIA-PACIFIC CRUISE TOURISM MARKET, BY TYPE, 2021-2031 ($MILLION)
TABLE 80. REST OF ASIA-PACIFIC CRUISE TOURISM MARKET, BY DURATION, 2021-2031 ($MILLION)
TABLE 81. REST OF ASIA-PACIFIC CRUISE TOURISM MARKET, BY PASSENGER AGE, 2021-2031 ($MILLION)
TABLE 82. LAMEA CRUISE TOURISM MARKET, BY TYPE, 2021-2031 ($MILLION)
TABLE 83. LAMEA CRUISE TOURISM MARKET, BY DURATION, 2021-2031 ($MILLION)
TABLE 84. LAMEA CRUISE TOURISM MARKET, BY PASSENGER AGE, 2021-2031 ($MILLION)
TABLE 85. LAMEA CRUISE TOURISM MARKET, BY COUNTRY, 2021-2031 ($MILLION)
TABLE 86. BRAZIL CRUISE TOURISM MARKET, BY TYPE, 2021-2031 ($MILLION)
TABLE 87. BRAZIL CRUISE TOURISM MARKET, BY DURATION, 2021-2031 ($MILLION)
TABLE 88. BRAZIL CRUISE TOURISM MARKET, BY PASSENGER AGE, 2021-2031 ($MILLION)
TABLE 89. UNITED ARAB EMIRATES CRUISE TOURISM MARKET, BY TYPE, 2021-2031 ($MILLION)
TABLE 90. UNITED ARAB EMIRATES CRUISE TOURISM MARKET, BY DURATION, 2021-2031 ($MILLION)
TABLE 91. UNITED ARAB EMIRATES CRUISE TOURISM MARKET, BY PASSENGER AGE, 2021-2031 ($MILLION)
TABLE 92. SAUDI ARABIA CRUISE TOURISM MARKET, BY TYPE, 2021-2031 ($MILLION)
TABLE 93. SAUDI ARABIA CRUISE TOURISM MARKET, BY DURATION, 2021-2031 ($MILLION)
TABLE 94. SAUDI ARABIA CRUISE TOURISM MARKET, BY PASSENGER AGE, 2021-2031 ($MILLION)
TABLE 95. SOUTH AFRICA CRUISE TOURISM MARKET, BY TYPE, 2021-2031 ($MILLION)
TABLE 96. SOUTH AFRICA CRUISE TOURISM MARKET, BY DURATION, 2021-2031 ($MILLION)
TABLE 97. SOUTH AFRICA CRUISE TOURISM MARKET, BY PASSENGER AGE, 2021-2031 ($MILLION)
TABLE 98. REST OF LAMEA CRUISE TOURISM MARKET, BY TYPE, 2021-2031 ($MILLION)
TABLE 99. REST OF LAMEA CRUISE TOURISM MARKET, BY DURATION, 2021-2031 ($MILLION)
TABLE 100. REST OF LAMEA CRUISE TOURISM MARKET, BY PASSENGER AGE, 2021-2031 ($MILLION)
TABLE 101. SILVERSEA CRUISES: KEY EXECUTIVES
TABLE 102. SILVERSEA CRUISES: COMPANY SNAPSHOT
TABLE 103. SEABOURN CRUISE LINE: KEY EXECUTIVES
TABLE 104. SEABOURN CRUISE LINE: COMPANY SNAPSHOT
TABLE 105. AMBASSADOR CRUISE HOLIDAYS LIMITED.: KEY EXECUTIVES
TABLE 106. AMBASSADOR CRUISE HOLIDAYS LIMITED.: COMPANY SNAPSHOT
TABLE 107. AMAWATERWAYS: KEY EXECUTIVES
TABLE 108. AMAWATERWAYS: COMPANY SNAPSHOT
TABLE 109. CARNIVAL CORPORATION & PLC: KEY EXECUTIVES
TABLE 110. CARNIVAL CORPORATION & PLC: COMPANY SNAPSHOT
TABLE 111. COSMOS TOURS LTD.: KEY EXECUTIVES
TABLE 112. COSMOS TOURS LTD.: COMPANY SNAPSHOT
TABLE 113. KERALA SHIPPING AND INLAND NAVIGATION CORPORATION LTD: KEY EXECUTIVES
TABLE 114. KERALA SHIPPING AND INLAND NAVIGATION CORPORATION LTD: COMPANY SNAPSHOT
TABLE 115. PONANT: KEY EXECUTIVES
TABLE 116. PONANT: COMPANY SNAPSHOT
TABLE 117. MEDITERRANEAN SHIPPING COMPANY S.A.: KEY EXECUTIVES
TABLE 118. MEDITERRANEAN SHIPPING COMPANY S.A.: COMPANY SNAPSHOT
TABLE 119. NORWEGIAN CRUISE LINE: KEY EXECUTIVES
TABLE 120. NORWEGIAN CRUISE LINE: COMPANY SNAPSHOT LIST OF FIGURES
FIGURE 01. CRUISE TOURISM MARKET, 2021-2031
FIGURE 02. SEGMENTATION OF CRUISE TOURISM MARKET, 2021-2031
FIGURE 03. TOP INVESTMENT POCKETS IN CRUISE TOURISM MARKET (2022-2031)
FIGURE 04. PORTER FIVE-1
FIGURE 05. PORTER FIVE-2
FIGURE 06. PORTER FIVE-3
FIGURE 07. PORTER FIVE-4
FIGURE 08. PORTER FIVE-5
FIGURE 09. DRIVERS, RESTRAINTS AND OPPORTUNITIES: GLOBALCRUISE TOURISM MARKET
FIGURE 10. IMPACT OF KEY REGULATION: CRUISE TOURISM MARKET
FIGURE 11. MARKET SHARE ANALYSIS: CRUISE TOURISM MARKET
FIGURE 12. PATENT ANALYSIS BY COMPANY
FIGURE 13. PATENT ANALYSIS BY COUNTRY
FIGURE 14. REGULATORY GUIDELINES: CRUISE TOURISM MARKET
FIGURE 15. VALUE CHAIN ANALYSIS: CRUISE TOURISM MARKET
FIGURE 16. CRUISE TOURISM MARKET, BY TYPE, 2021(%)
FIGURE 17. COMPARATIVE SHARE ANALYSIS OF CRUISE TOURISM MARKET FOR RIVER CRUISE, BY COUNTRY 2021 AND 2031(%)
FIGURE 18. COMPARATIVE SHARE ANALYSIS OF CRUISE TOURISM MARKET FOR OCEAN CRUISE, BY COUNTRY 2021 AND 2031(%)
FIGURE 19. COMPARATIVE SHARE ANALYSIS OF CRUISE TOURISM MARKET FOR EXPEDITION CRUISE, BY COUNTRY 2021 AND 2031(%)
FIGURE 20. COMPARATIVE SHARE ANALYSIS OF CRUISE TOURISM MARKET FOR THEME CRUISE, BY COUNTRY 2021 AND 2031(%)
FIGURE 21. COMPARATIVE SHARE ANALYSIS OF CRUISE TOURISM MARKET FOR ADVENTURE CRUISE, BY COUNTRY 2021 AND 2031(%)
FIGURE 22. COMPARATIVE SHARE ANALYSIS OF CRUISE TOURISM MARKET FOR OTHERS, BY COUNTRY 2021 AND 2031(%)
FIGURE 23. CRUISE TOURISM MARKET, BY DURATION, 2021(%)
FIGURE 24. COMPARATIVE SHARE ANALYSIS OF CRUISE TOURISM MARKET FOR 1-3 DAYS, BY COUNTRY 2021 AND 2031(%)
FIGURE 25. COMPARATIVE SHARE ANALYSIS OF CRUISE TOURISM MARKET FOR 4-6 DAYS, BY COUNTRY 2021 AND 2031(%)
FIGURE 26. COMPARATIVE SHARE ANALYSIS OF CRUISE TOURISM MARKET FOR 7 DAYS, BY COUNTRY 2021 AND 2031(%)
FIGURE 27. COMPARATIVE SHARE ANALYSIS OF CRUISE TOURISM MARKET FOR 8 TO 13 DAYS, BY COUNTRY 2021 AND 2031(%)
FIGURE 28. COMPARATIVE SHARE ANALYSIS OF CRUISE TOURISM MARKET FOR 14 DAYS, BY COUNTRY 2021 AND 2031(%)
FIGURE 29. COMPARATIVE SHARE ANALYSIS OF CRUISE TOURISM MARKET FOR 15-20 DAYS, BY COUNTRY 2021 AND 2031(%)
FIGURE 30. COMPARATIVE SHARE ANALYSIS OF CRUISE TOURISM MARKET FOR MORE THAN 21 DAYS, BY COUNTRY 2021 AND 2031(%)
FIGURE 31. CRUISE TOURISM MARKET, BY PASSENGER AGE, 2021(%)
FIGURE 32. COMPARATIVE SHARE ANALYSIS OF CRUISE TOURISM MARKET FOR LESS THAN 12 YEARS, BY COUNTRY 2021 AND 2031(%)
FIGURE 33. COMPARATIVE SHARE ANALYSIS OF CRUISE TOURISM MARKET FOR 13-19 YEARS, BY COUNTRY 2021 AND 2031(%)
FIGURE 34. COMPARATIVE SHARE ANALYSIS OF CRUISE TOURISM MARKET FOR 20-29 YEARS, BY COUNTRY 2021 AND 2031(%)
FIGURE 35. COMPARATIVE SHARE ANALYSIS OF CRUISE TOURISM MARKET FOR 30-39 YEARS, BY COUNTRY 2021 AND 2031(%)
FIGURE 36. COMPARATIVE SHARE ANALYSIS OF CRUISE TOURISM MARKET FOR 40-49 YEARS, BY COUNTRY 2021 AND 2031(%)
FIGURE 37. COMPARATIVE SHARE ANALYSIS OF CRUISE TOURISM MARKET FOR 50-59 YEARS, BY COUNTRY 2021 AND 2031(%)
FIGURE 38. COMPARATIVE SHARE ANALYSIS OF CRUISE TOURISM MARKET FOR ABOVE 60 YEARS, BY COUNTRY 2021 AND 2031(%)
FIGURE 39. CRUISE TOURISM MARKET BY REGION, 2021
FIGURE 40. U.S. CRUISE TOURISM MARKET, 2021-2031 ($MILLION)
FIGURE 41. CANADA CRUISE TOURISM MARKET, 2021-2031 ($MILLION)
FIGURE 42. MEXICO CRUISE TOURISM MARKET, 2021-2031 ($MILLION)
FIGURE 43. GERMANY CRUISE TOURISM MARKET, 2021-2031 ($MILLION)
FIGURE 44. UK CRUISE TOURISM MARKET, 2021-2031 ($MILLION)
FIGURE 45. FRANCE CRUISE TOURISM MARKET, 2021-2031 ($MILLION)
FIGURE 46. SPAIN CRUISE TOURISM MARKET, 2021-2031 ($MILLION)
FIGURE 47. ITALY CRUISE TOURISM MARKET, 2021-2031 ($MILLION)
FIGURE 48. REST OF EUROPE CRUISE TOURISM MARKET, 2021-2031 ($MILLION)
FIGURE 49. CHINA CRUISE TOURISM MARKET, 2021-2031 ($MILLION)
FIGURE 50. THAILAND CRUISE TOURISM MARKET, 2021-2031 ($MILLION)
FIGURE 51. INDIA CRUISE TOURISM MARKET, 2021-2031 ($MILLION)
FIGURE 52. SOUTH KOREA CRUISE TOURISM MARKET, 2021-2031 ($MILLION)
FIGURE 53. MALAYSIA CRUISE TOURISM MARKET, 2021-2031 ($MILLION)
FIGURE 54. REST OF ASIA-PACIFIC CRUISE TOURISM MARKET, 2021-2031 ($MILLION)
FIGURE 55. BRAZIL CRUISE TOURISM MARKET, 2021-2031 ($MILLION)
FIGURE 56. UNITED ARAB EMIRATES CRUISE TOURISM MARKET, 2021-2031 ($MILLION)
FIGURE 57. SAUDI ARABIA CRUISE TOURISM MARKET, 2021-2031 ($MILLION)
FIGURE 58. SOUTH AFRICA CRUISE TOURISM MARKET, 2021-2031 ($MILLION)
FIGURE 59. REST OF LAMEA CRUISE TOURISM MARKET, 2021-2031 ($MILLION)
FIGURE 60. TOP WINNING STRATEGIES, BY YEAR
FIGURE 61. TOP WINNING STRATEGIES, BY DEVELOPMENT
FIGURE 62. TOP WINNING STRATEGIES, BY COMPANY
FIGURE 63. PRODUCT MAPPING OF TOP 10 PLAYERS
FIGURE 64. COMPETITIVE DASHBOARD
FIGURE 65. COMPETITIVE HEATMAP: CRUISE TOURISM MARKET
FIGURE 66. TOP PLAYER POSITIONING, 202
SELECT A FORMAT
Added to Cart
Electronic (PDF)

$5820

This license allows only one user to access the PDF.
Electronic (PDF)

$6540

This license allows 1 - 5 user to access the PDF, license is suitable for small groups of 5 users working together
Electronic (PDF)

$9870

This license allows users/teams in a same Enterprise to use this report, various departments within an enterpise can use this report
Electronic (PDF)

$3930

This license just provides quantitative data in a excel sheet
Add to Cart
Buy Now (15% Discount)

OUR CUSTOMER

SecuX Technology Inc

SIMILAR REPORTS


RELATED REPORTS

Global Commercial Luxury and Military RIBs Market Research Report 2024

120 Pages
Type: Report
Code: QYRE-Auto-30E18317
Tue Nov 19 00:00:00 UTC 2024

Add to Cart

Global Cruise Elevators Market Research Report 2024

120 Pages
Type: Report
Code: QYRE-Auto-22H18239
Wed Oct 16 00:00:00 UTC 2024

Add to Cart

Global Private Cruise Charter Market Research Report 2024

120 Pages
Type: Report
Code: QYRE-Auto-2O18481
Sat Oct 05 00:00:00 UTC 2024

Add to Cart

Global Boat Rental and Maintenance Service Market Research Report 2024

120 Pages
Type: Report
Code: QYRE-Auto-9J18259
Mon Sep 02 00:00:00 UTC 2024

Add to Cart