2
U.S. (TOLL FREE)
+1 (315) 215-3225
Automative

2
U.S. (TOLL FREE)
+1 (315) 215-3225
Optical Amplifier Market By Type (Semiconductor Optical Amplifier, Fiber Amplifier, Others), By Function (Booster Amplifier, In-line Amplifier, Pre-Amplifier), By Industry Vertical (IT and Telecommunication, Industrial, Government and Defense, Healthcare and Life Sciences, Others): Global Opportunity Analysis and Industry Forecast, 2021-2031
Published Date: March 2023
|
Report Code: ALLI-Auto-1L748
Home | Market Reports | Computers & Electronics| Electronics & Electrical
Optical Amplifier Market By Type Semiconductor Optical Amplifier Fiber Amplifier Others By Function Booster Amplifier In line Amplifier Pre Amplifier By Industry Vertical IT and Telecommunication Industrial Government and Defense Healthcare and Life Sciences Others Global Opportunity Analysis and Industry Forecast 2021 2031
BUY CHAPTERS

Optical Amplifier Market By Type (Semiconductor Optical Amplifier, Fiber Amplifier, Others), By Function (Booster Amplifier, In-line Amplifier, Pre-Amplifier), By Industry Vertical (IT and Telecommunication, Industrial, Government and Defense, Healthcare and Life Sciences, Others): Global Opportunity Analysis and Industry Forecast, 2021-2031

Code: ALLI-Auto-1L748
Report
March 2023
Pages:256
Allied Market Research
Buy Now with 15% Discount
DESCRIPTION
TABLE OF CONTENT
TABLES & FIGURES

Optical Amplifier Market Size

According to a new report published by , titled, “Optical Amplifier Market," The optical amplifier market was valued at $916.37 million in 2021, and is estimated to reach $1.8 billion by 2031, growing at a CAGR of 6.9% from 2022 to 2031.

Optical Amplifier Market

Optical Amplifier Market

An optical amplifier may be defined as a device that amplifies optical signals directly. The optical signal does not need to be converted into an electrical signal with the use of an optical amplifier. Optical amplifiers are also considered lasers without optical cavities or lasers in which the feedback from a cavity is suppressed. A typical optical communication link consists of a transmitter, a receiver, and an optical fiber cable that connects them. Optical amplifiers are placed either after the transmitter, or before the receiver, or in the optical fiber cable between the transmitter and receiver. In comparison to other mediums such as copper, signals transmitted through optical fiber face much less attenuation. However, the distance that a signal may travel before becoming too noisy to detect is still around 100 km.
Key factors driving the growth of optical amplifier market include their requirement in data centers and increasing demand for data centers, rising deployment of smart cities and smart homes, and the rising demand for high-speed data transfer. The increase in the use of cloud services,  and the growth of e-commerce, and big data analytics have led to an increase in demand for data centers because these trends have resulted in an exponential increase in the amount of data that needs to be processed and stored. Data centers require high-speed and reliable communication networks to transfer large amounts of data quickly and efficiently. In optical transmissions, the signals show more and more noise the farther they travel, so eventually, the signals become indistinguishable from noise. Optical amplifiers play a crucial role in the communication system of the data center, as they help to boost the signal strength and stop it from becoming indistinguishable. Hence, the demand for optical amplifiers increases with the increase in the demand for data centers.
In terms of growth opportunities, the increased use of hyper-converged infrastructure is creating opportunities for the optical amplifier market. Optical amplifiers play a critical role in supporting the networking component of HCI as they are used to boost the signal strength in optical fiber cables, enabling high speed and data transfer over long distances. The increase in the use of HCI is increase creating new opportunities for the optical amplifier market, as data centers look for solutions to support high-speed and reliable connectivity between resources. The growth of the optical amplifier market is expected to benefit from this trend as the demand for HCI continues.
The optical amplifier market is segmented on the basis of type, function, industry vertical, and region. On the basis of type, it is classified into semiconductor optical amplifier, fiber amplifier, and others. On the basis of function, it is classified into booster amplifier, in-line amplifier, and pre-amplifier. On the basis of industry vertical, it is classified into IT and telecommunications, industrial, government and defense, healthcare and life sciences, and others.
On the basis of region, it is analyzed across North America (the U.S., Canada, and Mexico), Europe (the UK, Germany, France, and Rest of Europe), Asia-Pacific (China, Japan, India, South Korea, and Rest of Asia-Pacific), and LAMEA (Latin America, the Middle East, and Africa).
Key Market Insights
In 2021, the fiber amplifier segment in the type segmentation accounted for highest revenue and is expected to reach $892.3 million by 2031 at a CAGR of 5.6%, while the semiconductor optical amplifier segment is projected to expand at the fastest CAGR of 8.7% during the forecast period.
In 2021, the in-line amplifier segment in the function segmentation accounted for maximum revenue and is likely to touch $670.11 million at 5.3% CAGR by 2031, while the pre-amplifier segment is estimated to grow at the fastest CAGR of 8.2% during the forecast period.
In 2021, the IT and telecommunication segment in the industry vertical segmentation garnered the largest market share and is estimated to be at $736.29 million by 2031 at 8.1% CAGR, and is also anticipated to witness the highest expansion rate during the forecast period.
In 2021, North America contributed for a significant share of the optical amplifier market and is expected to touch $690.44 million at 8.0% CAGR, and it is also expected to expand at the fastest rate during the forecast years.
The optical amplifier market players profiled in the report include Broadcom Inc., Coherent Corporation, Furukawa Co. Ltd., NEC Corporation, Source Photonics, APE Angewandte Physik und Elektronik GmbH, EMCOR Group Inc., IPG Photonics Corporation, Lumentum Operations LLC, and Sumitomo Electric Industries, Ltd. Market players have adopted various strategies, such as product launches, collaborations & partnerships, joint ventures, and acquisitions to expand their foothold in the digital multimeter market.

Overview

The optical amplifier market size was valued at $916.37 million in 2021, and is projected to reach $1,792.88 million by 2031, registering a CAGR of 6.9%. An optical amplifier may be defined as a device that receives light as an input signal and then generates an output signal with high optical power. Typically, laser beams are used as input and output signals, propagating either as Gaussian beams in fiber or free space. An external source is required for amplification, which takes place in a so-called gain medium that needs to be provided with energy i.e. pumped. Most optical amplifiers are either electrically or optically pumped.
The scope of the report discusses the potential opportunities for the key players to enter the optical amplifier market. Furthermore, it provides an in-depth analysis of the market, outlining current trends, key driving factors, and key areas of investment. The report includes Porter’s five forces analysis to understand the competitive scenario of the industry and role of each stakeholder in the value chain. Moreover, it features the strategies adopted by key market players to maintain their foothold in the market.
The optical amplifier market is segmented on the basis of type, function, industry vertical, and region. On the basis of type, it is classified into semiconductor optical amplifier, fiber amplifier, and others. On the basis of function, it is classified into booster amplifier, in-line amplifier, and pre-amplifier. On the basis of industry vertical, it is classified into IT and telecommunications, industrial, government and defense, healthcare and life sciences, and others. By region, the market is analyzed across North America, Europe, Asia-Pacific, and LAMEA.
The growth of the global optical amplifier market is driven by its usage in data centers and by the increase in the requirement for data centers. More data centers are required now due to the rise in the use of cloud services,  e-commerce, and big data analytics. The deployment of smart cities and smart homes is also an important development for the optical amplifier market. The technologies on which smart cities are built, need to deploy optical amplifiers to ensure proper transmission of large amounts of data. Furthermore, the higher use of bandwidth by companies also drives the optical amplifier market. However, optical amplifiers are expensive to purchase and install. Their costs are highly affected by various scenarios and circumstances. In addition, the adoption of hyper-converged infrastructure (HCI) is expected to generate new opportunities for the optical amplifier market.
The key players operating in the optical amplifier market are Broadcom Inc., Coherent Corporation, Furukawa Co. Ltd., NEC Corporation, Source Photonics, APE Angewandte Physik und Elektronik GmbH, EMCOR Group Inc., IPG Photonics Corporation, Lumentum Operations LLC, and Sumitomo Electric Industries, Ltd. These key players adopt several strategies such as new product launch and development, acquisition, partnership and collaboration and business expansion to increase their market share in the global digital multimeter market during the forecast period.

Key Benefits For Stakeholders

●This report provides a quantitative analysis of the market segments, current trends, estimations, and dynamics of the optical amplifier market analysis from 2021 to 2031 to identify the prevailing optical amplifier market opportunities.
●The market research is offered along with information related to key drivers, restraints, and opportunities.
●Porter's five forces analysis highlights the potency of buyers and suppliers to enable stakeholders make profit-oriented business decisions and strengthen their supplier-buyer network.
●In-depth analysis of the optical amplifier market segmentation assists to determine the prevailing market opportunities.
●Major countries in each region are mapped according to their revenue contribution to the global market.
●Market player positioning facilitates benchmarking and provides a clear understanding of the present position of the market players.
●The report includes the analysis of the regional as well as global optical amplifier market trends, key players, market segments, application areas, and market growth strategies.
Key Market Segments
○ APE Angewandte Physik und Elektronik Gmb

Scope of Optical Amplifier Market Report

Report Metric Details
Report Name Optical Amplifier Market
Accounted market size in 2021 $ 916.37 million
Forecasted market size in 2031 $ 1.8 billion
CAGR 6.9%
Base Year 2021
Forecasted years 2024 - 2031
By Type ● Semiconductor Optical Amplifier
● Fiber Amplifier
● Others
By Function ● Booster Amplifier
● In-line Amplifier
● Pre-Amplifier
By Industry Vertical ● Others
● IT and Telecommunication
● Industrial
● Government and Defense
● Healthcare and Life Sciences
By Region
  • North America (United States, Canada)
  • Europe (Germany, France, UK, Italy, Russia) Rest of Europe
  • Nordic Countries
  • Asia-Pacific (China, Japan, South Korea)
  • Southeast Asia (India, Australia)
  • Rest of Asia
  • Latin America (Mexico, Brazil)
  • Rest of Latin America
  • Middle East & Africa (Turkey, Saudi Arabia, UAE, Rest of MEA)
Forecast units USD million in value
Report coverage Revenue and volume forecast, company share, competitive landscape, growth factors and trends

FAQ for this report

How fast is Optical Amplifier Market growing?

Ans: The Optical Amplifier Market witnessing a CAGR of 6.9% during the forecast period 2024-2031.

What is the Optical Amplifier Market size in 2031?

Ans: The Optical Amplifier Market size in 2031 will be $ 1.8 billion.

What are the Type segmentation covered in the Optical Amplifier Market report?

Ans: The Types covered in the Optical Amplifier Market report are ● Semiconductor Optical Amplifier, ● Fiber Amplifier, ● Others

CHAPTER 1: INTRODUCTION
1.1. Report description
1.2. Key market segments
1.3. Key benefits to the stakeholders
1.4. Research Methodology
1.4.1. Primary research
1.4.2. Secondary research
1.4.3. Analyst tools and models
CHAPTER 2: EXECUTIVE SUMMARY
2.1. CXO Perspective
CHAPTER 3: MARKET OVERVIEW
3.1. Market definition and scope
3.2. Key findings
3.2.1. Top impacting factors
3.2.2. Top investment pockets
3.3. Porter’s five forces analysis
3.3.1. Bargaining power of suppliers
3.3.2. Bargaining power of buyers
3.3.3. Threat of substitutes
3.3.4. Threat of new entrants
3.3.5. Intensity of rivalry
3.4. Market dynamics
3.4.1. Drivers
3.4.1.1. Development of data centers to boost demand
3.4.1.2. Increase in deployment of smart cities and smart homes
3.4.1.3. Increase in demand for high-speed data transfer
3.4.2. Restraints
3.4.2.1. High initial investment
3.4.3. Opportunities
3.4.3.1. Increase in use of Hyper-converged Infrastructure (HCI)
3.5. COVID-19 Impact Analysis on the market
CHAPTER 4: OPTICAL AMPLIFIER MARKET, BY TYPE
4.1. Overview
4.1.1. Market size and forecast
4.2. Semiconductor Optical Amplifier
4.2.1. Key market trends, growth factors and opportunities
4.2.2. Market size and forecast, by region
4.2.3. Market share analysis by country
4.3. Fiber Amplifier
4.3.1. Key market trends, growth factors and opportunities
4.3.2. Market size and forecast, by region
4.3.3. Market share analysis by country
4.4. Others
4.4.1. Key market trends, growth factors and opportunities
4.4.2. Market size and forecast, by region
4.4.3. Market share analysis by country
CHAPTER 5: OPTICAL AMPLIFIER MARKET, BY FUNCTION
5.1. Overview
5.1.1. Market size and forecast
5.2. Booster Amplifier
5.2.1. Key market trends, growth factors and opportunities
5.2.2. Market size and forecast, by region
5.2.3. Market share analysis by country
5.3. In-line Amplifier
5.3.1. Key market trends, growth factors and opportunities
5.3.2. Market size and forecast, by region
5.3.3. Market share analysis by country
5.4. Pre-Amplifier
5.4.1. Key market trends, growth factors and opportunities
5.4.2. Market size and forecast, by region
5.4.3. Market share analysis by country
CHAPTER 6: OPTICAL AMPLIFIER MARKET, BY INDUSTRY VERTICAL
6.1. Overview
6.1.1. Market size and forecast
6.2. IT and Telecommunication
6.2.1. Key market trends, growth factors and opportunities
6.2.2. Market size and forecast, by region
6.2.3. Market share analysis by country
6.3. Industrial
6.3.1. Key market trends, growth factors and opportunities
6.3.2. Market size and forecast, by region
6.3.3. Market share analysis by country
6.4. Government and Defense
6.4.1. Key market trends, growth factors and opportunities
6.4.2. Market size and forecast, by region
6.4.3. Market share analysis by country
6.5. Healthcare and Life Sciences
6.5.1. Key market trends, growth factors and opportunities
6.5.2. Market size and forecast, by region
6.5.3. Market share analysis by country
6.6. Others
6.6.1. Key market trends, growth factors and opportunities
6.6.2. Market size and forecast, by region
6.6.3. Market share analysis by country
CHAPTER 7: OPTICAL AMPLIFIER MARKET, BY REGION
7.1. Overview
7.1.1. Market size and forecast By Region
7.2. North America
7.2.1. Key trends and opportunities
7.2.2. Market size and forecast, by Type
7.2.3. Market size and forecast, by Function
7.2.4. Market size and forecast, by Industry Vertical
7.2.5. Market size and forecast, by country
7.2.5.1. U.S.
7.2.5.1.1. Key market trends, growth factors and opportunities
7.2.5.1.2. Market size and forecast, by Type
7.2.5.1.3. Market size and forecast, by Function
7.2.5.1.4. Market size and forecast, by Industry Vertical
7.2.5.2. Canada
7.2.5.2.1. Key market trends, growth factors and opportunities
7.2.5.2.2. Market size and forecast, by Type
7.2.5.2.3. Market size and forecast, by Function
7.2.5.2.4. Market size and forecast, by Industry Vertical
7.2.5.3. Mexico
7.2.5.3.1. Key market trends, growth factors and opportunities
7.2.5.3.2. Market size and forecast, by Type
7.2.5.3.3. Market size and forecast, by Function
7.2.5.3.4. Market size and forecast, by Industry Vertical
7.3. Europe
7.3.1. Key trends and opportunities
7.3.2. Market size and forecast, by Type
7.3.3. Market size and forecast, by Function
7.3.4. Market size and forecast, by Industry Vertical
7.3.5. Market size and forecast, by country
7.3.5.1. UK
7.3.5.1.1. Key market trends, growth factors and opportunities
7.3.5.1.2. Market size and forecast, by Type
7.3.5.1.3. Market size and forecast, by Function
7.3.5.1.4. Market size and forecast, by Industry Vertical
7.3.5.2. Germany
7.3.5.2.1. Key market trends, growth factors and opportunities
7.3.5.2.2. Market size and forecast, by Type
7.3.5.2.3. Market size and forecast, by Function
7.3.5.2.4. Market size and forecast, by Industry Vertical
7.3.5.3. France
7.3.5.3.1. Key market trends, growth factors and opportunities
7.3.5.3.2. Market size and forecast, by Type
7.3.5.3.3. Market size and forecast, by Function
7.3.5.3.4. Market size and forecast, by Industry Vertical
7.3.5.4. Rest of Europe
7.3.5.4.1. Key market trends, growth factors and opportunities
7.3.5.4.2. Market size and forecast, by Type
7.3.5.4.3. Market size and forecast, by Function
7.3.5.4.4. Market size and forecast, by Industry Vertical
7.4. Asia-Pacific
7.4.1. Key trends and opportunities
7.4.2. Market size and forecast, by Type
7.4.3. Market size and forecast, by Function
7.4.4. Market size and forecast, by Industry Vertical
7.4.5. Market size and forecast, by country
7.4.5.1. China
7.4.5.1.1. Key market trends, growth factors and opportunities
7.4.5.1.2. Market size and forecast, by Type
7.4.5.1.3. Market size and forecast, by Function
7.4.5.1.4. Market size and forecast, by Industry Vertical
7.4.5.2. Japan
7.4.5.2.1. Key market trends, growth factors and opportunities
7.4.5.2.2. Market size and forecast, by Type
7.4.5.2.3. Market size and forecast, by Function
7.4.5.2.4. Market size and forecast, by Industry Vertical
7.4.5.3. India
7.4.5.3.1. Key market trends, growth factors and opportunities
7.4.5.3.2. Market size and forecast, by Type
7.4.5.3.3. Market size and forecast, by Function
7.4.5.3.4. Market size and forecast, by Industry Vertical
7.4.5.4. South Korea
7.4.5.4.1. Key market trends, growth factors and opportunities
7.4.5.4.2. Market size and forecast, by Type
7.4.5.4.3. Market size and forecast, by Function
7.4.5.4.4. Market size and forecast, by Industry Vertical
7.4.5.5. Rest of Asia-Pacific
7.4.5.5.1. Key market trends, growth factors and opportunities
7.4.5.5.2. Market size and forecast, by Type
7.4.5.5.3. Market size and forecast, by Function
7.4.5.5.4. Market size and forecast, by Industry Vertical
7.5. LAMEA
7.5.1. Key trends and opportunities
7.5.2. Market size and forecast, by Type
7.5.3. Market size and forecast, by Function
7.5.4. Market size and forecast, by Industry Vertical
7.5.5. Market size and forecast, by country
7.5.5.1. Latin America
7.5.5.1.1. Key market trends, growth factors and opportunities
7.5.5.1.2. Market size and forecast, by Type
7.5.5.1.3. Market size and forecast, by Function
7.5.5.1.4. Market size and forecast, by Industry Vertical
7.5.5.2. Middle East
7.5.5.2.1. Key market trends, growth factors and opportunities
7.5.5.2.2. Market size and forecast, by Type
7.5.5.2.3. Market size and forecast, by Function
7.5.5.2.4. Market size and forecast, by Industry Vertical
7.5.5.3. Africa
7.5.5.3.1. Key market trends, growth factors and opportunities
7.5.5.3.2. Market size and forecast, by Type
7.5.5.3.3. Market size and forecast, by Function
7.5.5.3.4. Market size and forecast, by Industry Vertical
CHAPTER 8: COMPETITIVE LANDSCAPE
8.1. Introduction
8.2. Top winning strategies
8.3. Product Mapping of Top 10 Player
8.4. Competitive Dashboard
8.5. Competitive Heatmap
8.6. Top player positioning, 2021
CHAPTER 9: COMPANY PROFILES
9.1. Broadcom Inc.
9.1.1. Company overview
9.1.2. Key Executives
9.1.3. Company snapshot
9.1.4. Operating business segments
9.1.5. Product portfolio
9.1.6. Business performance
9.2. Coherent Corporation
9.2.1. Company overview
9.2.2. Key Executives
9.2.3. Company snapshot
9.2.4. Operating business segments
9.2.5. Product portfolio
9.2.6. Business performance
9.3. Furukawa Co. Ltd.
9.3.1. Company overview
9.3.2. Key Executives
9.3.3. Company snapshot
9.3.4. Operating business segments
9.3.5. Product portfolio
9.3.6. Business performance
9.3.7. Key strategic moves and developments
9.4. NEC Corporation
9.4.1. Company overview
9.4.2. Key Executives
9.4.3. Company snapshot
9.4.4. Operating business segments
9.4.5. Product portfolio
9.4.6. Business performance
9.5. Source Photonics Inc.
9.5.1. Company overview
9.5.2. Key Executives
9.5.3. Company snapshot
9.5.4. Operating business segments
9.5.5. Product portfolio
9.6. APE Angewandte Physik und Elektronik GmbH
9.6.1. Company overview
9.6.2. Key Executives
9.6.3. Company snapshot
9.6.4. Operating business segments
9.6.5. Product portfolio
9.7. EMCOR Group Inc.
9.7.1. Company overview
9.7.2. Key Executives
9.7.3. Company snapshot
9.7.4. Operating business segments
9.7.5. Product portfolio
9.7.6. Business performance
9.7.7. Key strategic moves and developments
9.8. IPG Photonics Corporation
9.8.1. Company overview
9.8.2. Key Executives
9.8.3. Company snapshot
9.8.4. Operating business segments
9.8.5. Product portfolio
9.8.6. Business performance
9.9. Lumentum Operations LLC
9.9.1. Company overview
9.9.2. Key Executives
9.9.3. Company snapshot
9.9.4. Operating business segments
9.9.5. Product portfolio
9.9.6. Business performance
9.10. Sumitomo Electric Industries, Ltd.
9.10.1. Company overview
9.10.2. Key Executives
9.10.3. Company snapshot
9.10.4. Operating business segments
9.10.5. Product portfolio
9.10.6. Business performanc
LIST OF TABLES
TABLE 01. GLOBAL OPTICAL AMPLIFIER MARKET, BY TYPE, 2021-2031 ($MILLION)
TABLE 02. OPTICAL AMPLIFIER MARKET FOR SEMICONDUCTOR OPTICAL AMPLIFIER, BY REGION, 2021-2031 ($MILLION)
TABLE 03. OPTICAL AMPLIFIER MARKET FOR FIBER AMPLIFIER, BY REGION, 2021-2031 ($MILLION)
TABLE 04. OPTICAL AMPLIFIER MARKET FOR OTHERS, BY REGION, 2021-2031 ($MILLION)
TABLE 05. GLOBAL OPTICAL AMPLIFIER MARKET, BY FUNCTION, 2021-2031 ($MILLION)
TABLE 06. OPTICAL AMPLIFIER MARKET FOR BOOSTER AMPLIFIER, BY REGION, 2021-2031 ($MILLION)
TABLE 07. OPTICAL AMPLIFIER MARKET FOR IN-LINE AMPLIFIER, BY REGION, 2021-2031 ($MILLION)
TABLE 08. OPTICAL AMPLIFIER MARKET FOR PRE-AMPLIFIER, BY REGION, 2021-2031 ($MILLION)
TABLE 09. GLOBAL OPTICAL AMPLIFIER MARKET, BY INDUSTRY VERTICAL, 2021-2031 ($MILLION)
TABLE 10. OPTICAL AMPLIFIER MARKET FOR IT AND TELECOMMUNICATION, BY REGION, 2021-2031 ($MILLION)
TABLE 11. OPTICAL AMPLIFIER MARKET FOR INDUSTRIAL, BY REGION, 2021-2031 ($MILLION)
TABLE 12. OPTICAL AMPLIFIER MARKET FOR GOVERNMENT AND DEFENSE, BY REGION, 2021-2031 ($MILLION)
TABLE 13. OPTICAL AMPLIFIER MARKET FOR HEALTHCARE AND LIFE SCIENCES, BY REGION, 2021-2031 ($MILLION)
TABLE 14. OPTICAL AMPLIFIER MARKET FOR OTHERS, BY REGION, 2021-2031 ($MILLION)
TABLE 15. OPTICAL AMPLIFIER MARKET, BY REGION, 2021-2031 ($MILLION)
TABLE 16. NORTH AMERICA OPTICAL AMPLIFIER MARKET, BY TYPE, 2021-2031 ($MILLION)
TABLE 17. NORTH AMERICA OPTICAL AMPLIFIER MARKET, BY FUNCTION, 2021-2031 ($MILLION)
TABLE 18. NORTH AMERICA OPTICAL AMPLIFIER MARKET, BY INDUSTRY VERTICAL, 2021-2031 ($MILLION)
TABLE 19. NORTH AMERICA OPTICAL AMPLIFIER MARKET, BY COUNTRY, 2021-2031 ($MILLION)
TABLE 20. U.S. OPTICAL AMPLIFIER MARKET, BY TYPE, 2021-2031 ($MILLION)
TABLE 21. U.S. OPTICAL AMPLIFIER MARKET, BY FUNCTION, 2021-2031 ($MILLION)
TABLE 22. U.S. OPTICAL AMPLIFIER MARKET, BY INDUSTRY VERTICAL, 2021-2031 ($MILLION)
TABLE 23. CANADA OPTICAL AMPLIFIER MARKET, BY TYPE, 2021-2031 ($MILLION)
TABLE 24. CANADA OPTICAL AMPLIFIER MARKET, BY FUNCTION, 2021-2031 ($MILLION)
TABLE 25. CANADA OPTICAL AMPLIFIER MARKET, BY INDUSTRY VERTICAL, 2021-2031 ($MILLION)
TABLE 26. MEXICO OPTICAL AMPLIFIER MARKET, BY TYPE, 2021-2031 ($MILLION)
TABLE 27. MEXICO OPTICAL AMPLIFIER MARKET, BY FUNCTION, 2021-2031 ($MILLION)
TABLE 28. MEXICO OPTICAL AMPLIFIER MARKET, BY INDUSTRY VERTICAL, 2021-2031 ($MILLION)
TABLE 29. EUROPE OPTICAL AMPLIFIER MARKET, BY TYPE, 2021-2031 ($MILLION)
TABLE 30. EUROPE OPTICAL AMPLIFIER MARKET, BY FUNCTION, 2021-2031 ($MILLION)
TABLE 31. EUROPE OPTICAL AMPLIFIER MARKET, BY INDUSTRY VERTICAL, 2021-2031 ($MILLION)
TABLE 32. EUROPE OPTICAL AMPLIFIER MARKET, BY COUNTRY, 2021-2031 ($MILLION)
TABLE 33. UK OPTICAL AMPLIFIER MARKET, BY TYPE, 2021-2031 ($MILLION)
TABLE 34. UK OPTICAL AMPLIFIER MARKET, BY FUNCTION, 2021-2031 ($MILLION)
TABLE 35. UK OPTICAL AMPLIFIER MARKET, BY INDUSTRY VERTICAL, 2021-2031 ($MILLION)
TABLE 36. GERMANY OPTICAL AMPLIFIER MARKET, BY TYPE, 2021-2031 ($MILLION)
TABLE 37. GERMANY OPTICAL AMPLIFIER MARKET, BY FUNCTION, 2021-2031 ($MILLION)
TABLE 38. GERMANY OPTICAL AMPLIFIER MARKET, BY INDUSTRY VERTICAL, 2021-2031 ($MILLION)
TABLE 39. FRANCE OPTICAL AMPLIFIER MARKET, BY TYPE, 2021-2031 ($MILLION)
TABLE 40. FRANCE OPTICAL AMPLIFIER MARKET, BY FUNCTION, 2021-2031 ($MILLION)
TABLE 41. FRANCE OPTICAL AMPLIFIER MARKET, BY INDUSTRY VERTICAL, 2021-2031 ($MILLION)
TABLE 42. REST OF EUROPE OPTICAL AMPLIFIER MARKET, BY TYPE, 2021-2031 ($MILLION)
TABLE 43. REST OF EUROPE OPTICAL AMPLIFIER MARKET, BY FUNCTION, 2021-2031 ($MILLION)
TABLE 44. REST OF EUROPE OPTICAL AMPLIFIER MARKET, BY INDUSTRY VERTICAL, 2021-2031 ($MILLION)
TABLE 45. ASIA-PACIFIC OPTICAL AMPLIFIER MARKET, BY TYPE, 2021-2031 ($MILLION)
TABLE 46. ASIA-PACIFIC OPTICAL AMPLIFIER MARKET, BY FUNCTION, 2021-2031 ($MILLION)
TABLE 47. ASIA-PACIFIC OPTICAL AMPLIFIER MARKET, BY INDUSTRY VERTICAL, 2021-2031 ($MILLION)
TABLE 48. ASIA-PACIFIC OPTICAL AMPLIFIER MARKET, BY COUNTRY, 2021-2031 ($MILLION)
TABLE 49. CHINA OPTICAL AMPLIFIER MARKET, BY TYPE, 2021-2031 ($MILLION)
TABLE 50. CHINA OPTICAL AMPLIFIER MARKET, BY FUNCTION, 2021-2031 ($MILLION)
TABLE 51. CHINA OPTICAL AMPLIFIER MARKET, BY INDUSTRY VERTICAL, 2021-2031 ($MILLION)
TABLE 52. JAPAN OPTICAL AMPLIFIER MARKET, BY TYPE, 2021-2031 ($MILLION)
TABLE 53. JAPAN OPTICAL AMPLIFIER MARKET, BY FUNCTION, 2021-2031 ($MILLION)
TABLE 54. JAPAN OPTICAL AMPLIFIER MARKET, BY INDUSTRY VERTICAL, 2021-2031 ($MILLION)
TABLE 55. INDIA OPTICAL AMPLIFIER MARKET, BY TYPE, 2021-2031 ($MILLION)
TABLE 56. INDIA OPTICAL AMPLIFIER MARKET, BY FUNCTION, 2021-2031 ($MILLION)
TABLE 57. INDIA OPTICAL AMPLIFIER MARKET, BY INDUSTRY VERTICAL, 2021-2031 ($MILLION)
TABLE 58. SOUTH KOREA OPTICAL AMPLIFIER MARKET, BY TYPE, 2021-2031 ($MILLION)
TABLE 59. SOUTH KOREA OPTICAL AMPLIFIER MARKET, BY FUNCTION, 2021-2031 ($MILLION)
TABLE 60. SOUTH KOREA OPTICAL AMPLIFIER MARKET, BY INDUSTRY VERTICAL, 2021-2031 ($MILLION)
TABLE 61. REST OF ASIA-PACIFIC OPTICAL AMPLIFIER MARKET, BY TYPE, 2021-2031 ($MILLION)
TABLE 62. REST OF ASIA-PACIFIC OPTICAL AMPLIFIER MARKET, BY FUNCTION, 2021-2031 ($MILLION)
TABLE 63. REST OF ASIA-PACIFIC OPTICAL AMPLIFIER MARKET, BY INDUSTRY VERTICAL, 2021-2031 ($MILLION)
TABLE 64. LAMEA OPTICAL AMPLIFIER MARKET, BY TYPE, 2021-2031 ($MILLION)
TABLE 65. LAMEA OPTICAL AMPLIFIER MARKET, BY FUNCTION, 2021-2031 ($MILLION)
TABLE 66. LAMEA OPTICAL AMPLIFIER MARKET, BY INDUSTRY VERTICAL, 2021-2031 ($MILLION)
TABLE 67. LAMEA OPTICAL AMPLIFIER MARKET, BY COUNTRY, 2021-2031 ($MILLION)
TABLE 68. LATIN AMERICA OPTICAL AMPLIFIER MARKET, BY TYPE, 2021-2031 ($MILLION)
TABLE 69. LATIN AMERICA OPTICAL AMPLIFIER MARKET, BY FUNCTION, 2021-2031 ($MILLION)
TABLE 70. LATIN AMERICA OPTICAL AMPLIFIER MARKET, BY INDUSTRY VERTICAL, 2021-2031 ($MILLION)
TABLE 71. MIDDLE EAST OPTICAL AMPLIFIER MARKET, BY TYPE, 2021-2031 ($MILLION)
TABLE 72. MIDDLE EAST OPTICAL AMPLIFIER MARKET, BY FUNCTION, 2021-2031 ($MILLION)
TABLE 73. MIDDLE EAST OPTICAL AMPLIFIER MARKET, BY INDUSTRY VERTICAL, 2021-2031 ($MILLION)
TABLE 74. AFRICA OPTICAL AMPLIFIER MARKET, BY TYPE, 2021-2031 ($MILLION)
TABLE 75. AFRICA OPTICAL AMPLIFIER MARKET, BY FUNCTION, 2021-2031 ($MILLION)
TABLE 76. AFRICA OPTICAL AMPLIFIER MARKET, BY INDUSTRY VERTICAL, 2021-2031 ($MILLION)
TABLE 77. BROADCOM INC.: KEY EXECUTIVES
TABLE 78. BROADCOM INC.: COMPANY SNAPSHOT
TABLE 79. BROADCOM INC.: SERVICE SEGMENTS
TABLE 80. BROADCOM INC.: PRODUCT PORTFOLIO
TABLE 81. COHERENT CORPORATION: KEY EXECUTIVES
TABLE 82. COHERENT CORPORATION: COMPANY SNAPSHOT
TABLE 83. COHERENT CORPORATION: PRODUCT SEGMENTS
TABLE 84. COHERENT CORPORATION: PRODUCT PORTFOLIO
TABLE 85. FURUKAWA CO. LTD.: KEY EXECUTIVES
TABLE 86. FURUKAWA CO. LTD.: COMPANY SNAPSHOT
TABLE 87. FURUKAWA CO. LTD.: PRODUCT SEGMENTS
TABLE 88. FURUKAWA CO. LTD.: PRODUCT PORTFOLIO
TABLE 89. FURUKAWA CO. LTD.: KEY STRATERGIES
TABLE 90. NEC CORPORATION: KEY EXECUTIVES
TABLE 91. NEC CORPORATION: COMPANY SNAPSHOT
TABLE 92. NEC CORPORATION: SERVICE SEGMENTS
TABLE 93. NEC CORPORATION: PRODUCT PORTFOLIO
TABLE 94. SOURCE PHOTONICS INC.: KEY EXECUTIVES
TABLE 95. SOURCE PHOTONICS INC.: COMPANY SNAPSHOT
TABLE 96. SOURCE PHOTONICS INC.: PRODUCT SEGMENTS
TABLE 97. SOURCE PHOTONICS INC.: PRODUCT PORTFOLIO
TABLE 98. APE ANGEWANDTE PHYSIK UND ELEKTRONIK GMBH: KEY EXECUTIVES
TABLE 99. APE ANGEWANDTE PHYSIK UND ELEKTRONIK GMBH: COMPANY SNAPSHOT
TABLE 100. APE ANGEWANDTE PHYSIK UND ELEKTRONIK GMBH: PRODUCT SEGMENTS
TABLE 101. APE ANGEWANDTE PHYSIK UND ELEKTRONIK GMBH: PRODUCT PORTFOLIO
TABLE 102. EMCOR GROUP INC.: KEY EXECUTIVES
TABLE 103. EMCOR GROUP INC.: COMPANY SNAPSHOT
TABLE 104. EMCOR GROUP INC.: PRODUCT SEGMENTS
TABLE 105. EMCOR GROUP INC.: PRODUCT PORTFOLIO
TABLE 106. EMCOR GROUP INC.: KEY STRATERGIES
TABLE 107. IPG PHOTONICS CORPORATION: KEY EXECUTIVES
TABLE 108. IPG PHOTONICS CORPORATION: COMPANY SNAPSHOT
TABLE 109. IPG PHOTONICS CORPORATION: PRODUCT SEGMENTS
TABLE 110. IPG PHOTONICS CORPORATION: PRODUCT PORTFOLIO
TABLE 111. LUMENTUM OPERATIONS LLC: KEY EXECUTIVES
TABLE 112. LUMENTUM OPERATIONS LLC: COMPANY SNAPSHOT
TABLE 113. LUMENTUM OPERATIONS LLC: PRODUCT SEGMENTS
TABLE 114. LUMENTUM OPERATIONS LLC: PRODUCT PORTFOLIO
TABLE 115. SUMITOMO ELECTRIC INDUSTRIES, LTD.: KEY EXECUTIVES
TABLE 116. SUMITOMO ELECTRIC INDUSTRIES, LTD.: COMPANY SNAPSHOT
TABLE 117. SUMITOMO ELECTRIC INDUSTRIES, LTD.: PRODUCT SEGMENTS
TABLE 118. SUMITOMO ELECTRIC INDUSTRIES, LTD.: PRODUCT PORTFOLIO LIST OF FIGURES
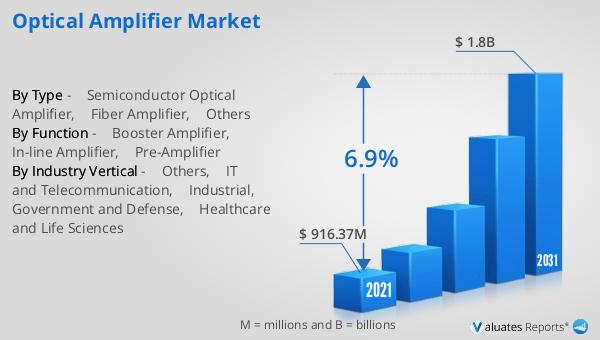
FIGURE 01. OPTICAL AMPLIFIER MARKET, 2021-2031
FIGURE 02. SEGMENTATION OF OPTICAL AMPLIFIER MARKET, 2021-2031
FIGURE 03. TOP INVESTMENT POCKETS IN OPTICAL AMPLIFIER MARKET (2022-2031)
FIGURE 04. HIGH BARGAINING POWER OF SUPPLIERS
FIGURE 05. MEDIUM BARGAINING POWER OF BUYERS
FIGURE 06. MEDIUM THREAT OF SUBSTITUTES
FIGURE 07. MEDIUM THREAT OF NEW ENTRANTS
FIGURE 08. HIGH INTENSITY OF RIVALRY
FIGURE 09. DRIVERS, RESTRAINTS AND OPPORTUNITIES: GLOBALOPTICAL AMPLIFIER MARKET
FIGURE 10. OPTICAL AMPLIFIER MARKET, BY TYPE, 2021(%)
FIGURE 11. COMPARATIVE SHARE ANALYSIS OF OPTICAL AMPLIFIER MARKET FOR SEMICONDUCTOR OPTICAL AMPLIFIER, BY COUNTRY 2021 AND 2031(%)
FIGURE 12. COMPARATIVE SHARE ANALYSIS OF OPTICAL AMPLIFIER MARKET FOR FIBER AMPLIFIER, BY COUNTRY 2021 AND 2031(%)
FIGURE 13. COMPARATIVE SHARE ANALYSIS OF OPTICAL AMPLIFIER MARKET FOR OTHERS, BY COUNTRY 2021 AND 2031(%)
FIGURE 14. OPTICAL AMPLIFIER MARKET, BY FUNCTION, 2021(%)
FIGURE 15. COMPARATIVE SHARE ANALYSIS OF OPTICAL AMPLIFIER MARKET FOR BOOSTER AMPLIFIER, BY COUNTRY 2021 AND 2031(%)
FIGURE 16. COMPARATIVE SHARE ANALYSIS OF OPTICAL AMPLIFIER MARKET FOR IN-LINE AMPLIFIER, BY COUNTRY 2021 AND 2031(%)
FIGURE 17. COMPARATIVE SHARE ANALYSIS OF OPTICAL AMPLIFIER MARKET FOR PRE-AMPLIFIER, BY COUNTRY 2021 AND 2031(%)
FIGURE 18. OPTICAL AMPLIFIER MARKET, BY INDUSTRY VERTICAL, 2021(%)
FIGURE 19. COMPARATIVE SHARE ANALYSIS OF OPTICAL AMPLIFIER MARKET FOR IT AND TELECOMMUNICATION, BY COUNTRY 2021 AND 2031(%)
FIGURE 20. COMPARATIVE SHARE ANALYSIS OF OPTICAL AMPLIFIER MARKET FOR INDUSTRIAL, BY COUNTRY 2021 AND 2031(%)
FIGURE 21. COMPARATIVE SHARE ANALYSIS OF OPTICAL AMPLIFIER MARKET FOR GOVERNMENT AND DEFENSE, BY COUNTRY 2021 AND 2031(%)
FIGURE 22. COMPARATIVE SHARE ANALYSIS OF OPTICAL AMPLIFIER MARKET FOR HEALTHCARE AND LIFE SCIENCES, BY COUNTRY 2021 AND 2031(%)
FIGURE 23. COMPARATIVE SHARE ANALYSIS OF OPTICAL AMPLIFIER MARKET FOR OTHERS, BY COUNTRY 2021 AND 2031(%)
FIGURE 24. OPTICAL AMPLIFIER MARKET BY REGION, 2021
FIGURE 25. U.S. OPTICAL AMPLIFIER MARKET, 2021-2031 ($MILLION)
FIGURE 26. CANADA OPTICAL AMPLIFIER MARKET, 2021-2031 ($MILLION)
FIGURE 27. MEXICO OPTICAL AMPLIFIER MARKET, 2021-2031 ($MILLION)
FIGURE 28. UK OPTICAL AMPLIFIER MARKET, 2021-2031 ($MILLION)
FIGURE 29. GERMANY OPTICAL AMPLIFIER MARKET, 2021-2031 ($MILLION)
FIGURE 30. FRANCE OPTICAL AMPLIFIER MARKET, 2021-2031 ($MILLION)
FIGURE 31. REST OF EUROPE OPTICAL AMPLIFIER MARKET, 2021-2031 ($MILLION)
FIGURE 32. CHINA OPTICAL AMPLIFIER MARKET, 2021-2031 ($MILLION)
FIGURE 33. JAPAN OPTICAL AMPLIFIER MARKET, 2021-2031 ($MILLION)
FIGURE 34. INDIA OPTICAL AMPLIFIER MARKET, 2021-2031 ($MILLION)
FIGURE 35. SOUTH KOREA OPTICAL AMPLIFIER MARKET, 2021-2031 ($MILLION)
FIGURE 36. REST OF ASIA-PACIFIC OPTICAL AMPLIFIER MARKET, 2021-2031 ($MILLION)
FIGURE 37. LATIN AMERICA OPTICAL AMPLIFIER MARKET, 2021-2031 ($MILLION)
FIGURE 38. MIDDLE EAST OPTICAL AMPLIFIER MARKET, 2021-2031 ($MILLION)
FIGURE 39. AFRICA OPTICAL AMPLIFIER MARKET, 2021-2031 ($MILLION)
FIGURE 40. TOP WINNING STRATEGIES, BY YEAR
FIGURE 41. TOP WINNING STRATEGIES, BY DEVELOPMENT
FIGURE 42. TOP WINNING STRATEGIES, BY COMPANY
FIGURE 43. PRODUCT MAPPING OF TOP 10 PLAYERS
FIGURE 44. COMPETITIVE DASHBOARD
FIGURE 45. COMPETITIVE HEATMAP: OPTICAL AMPLIFIER MARKET
FIGURE 46. TOP PLAYER POSITIONING, 2021
FIGURE 47. BROADCOM INC.: NET REVENUE, 2020-2022 ($MILLION)
FIGURE 48. BROADCOM INC.: RESEARCH & DEVELOPMENT EXPENDITURE, 2020-2022 ($MILLION)
FIGURE 49. BROADCOM INC.: REVENUE SHARE BY SEGMENT, 2022 (%)
FIGURE 50. BROADCOM INC.: REVENUE SHARE BY SEGMENT, 2021 (%)
FIGURE 51. COHERENT CORPORATION: NET REVENUE, 2020-2022 ($MILLION)
FIGURE 52. COHERENT CORPORATION: RESEARCH & DEVELOPMENT EXPENDITURE, 2020-2022 ($MILLION)
FIGURE 53. COHERENT CORPORATION: REVENUE SHARE BY SEGMENT, 2022 (%)
FIGURE 54. FURUKAWA CO. LTD.: NET SALES, 2020-2022 ($MILLION)
FIGURE 55. FURUKAWA CO. LTD.: RESEARCH & DEVELOPMENT EXPENDITURE, 2020-2022 ($MILLION)
FIGURE 56. FURUKAWA CO. LTD.: REVENUE SHARE BY SEGMENT, 2022 (%)
FIGURE 57. NEC CORPORATION: NET REVENUE, 2020-2022 ($MILLION)
FIGURE 58. NEC CORPORATION: REVENUE SHARE BY SEGMENT, 2022 (%)
FIGURE 59. NEC CORPORATION: REVENUE SHARE BY REGION, 2022 (%)
FIGURE 60. EMCOR GROUP INC.: NET REVENUE, 2020-2022 ($MILLION)
FIGURE 61. EMCOR GROUP INC.: RESEARCH & DEVELOPMENT EXPENDITURE, 2020-2022 ($MILLION)
FIGURE 62. EMCOR GROUP INC.: REVENUE SHARE BY SEGMENT, 2022 (%)
FIGURE 63. IPG PHOTONICS CORPORATION: NET SALES, 2019-2021 ($MILLION)
FIGURE 64. IPG PHOTONICS CORPORATION: RESEARCH & DEVELOPMENT EXPENDITURE, 2019-2021 ($MILLION)
FIGURE 65. IPG PHOTONICS CORPORATION: REVENUE SHARE BY REGION, 2021 (%)
FIGURE 66. LUMENTUM OPERATIONS LLC: NET REVENUE, 2020-2022 ($MILLION)
FIGURE 67. LUMENTUM OPERATIONS LLC: RESEARCH & DEVELOPMENT EXPENDITURE, 2020-2022 ($MILLION)
FIGURE 68. LUMENTUM OPERATIONS LLC: REVENUE SHARE BY SEGMENT, 2022 (%)
FIGURE 69. LUMENTUM OPERATIONS LLC: REVENUE SHARE BY REGION, 2022 (%)
FIGURE 70. SUMITOMO ELECTRIC INDUSTRIES, LTD.: NET REVENUE, 2019-2021 ($MILLION)
FIGURE 71. SUMITOMO ELECTRIC INDUSTRIES, LTD.: RESEARCH & DEVELOPMENT EXPENDITURE, 2019-2021
FIGURE 72. SUMITOMO ELECTRIC INDUSTRIES, LTD.: REVENUE SHARE BY SEGMENT, 2021 (%)
FIGURE 73. SUMITOMO ELECTRIC INDUSTRIES, LTD.: REVENUE SHARE BY REGION, 2021 (%
SELECT A FORMAT
Added to Cart
Electronic (PDF)

$5730

This license allows only one user to access the PDF.
Electronic (PDF)

$6450

This license allows 1 - 5 user to access the PDF, license is suitable for small groups of 5 users working together
Electronic (PDF)

$9600

This license allows users/teams in a same Enterprise to use this report, various departments within an enterpise can use this report
Electronic (PDF)

$3840

This license just provides quantitative data in a excel sheet
Add to Cart
Buy Now (15% Discount)

OUR CUSTOMER

Samsung SD

SIMILAR REPORTS


RELATED REPORTS

Global Thyristor Discs Market Research Report 2025

120 Pages
Type: Report
Code: QYRE-Auto-14J20228
Wed Dec 03 00:00:00 UTC 2025

Add to Cart

Global IMU Attitude Sensor Market Research Report 2025

120 Pages
Type: Report
Code: QYRE-Auto-2L20271
Wed Dec 03 00:00:00 UTC 2025

Add to Cart

Global High Voltage Electrical Swivels Market Research Report 2025

120 Pages
Type: Report
Code: QYRE-Auto-12P20208
Wed Dec 03 00:00:00 UTC 2025

Add to Cart

Global Thyristor Drives Market Research Report 2025

120 Pages
Type: Report
Code: QYRE-Auto-27X19827
Wed Dec 03 00:00:00 UTC 2025

Add to Cart