0
U.S. (TOLL FREE)
+1 (315) 215-3225
Automative

0
U.S. (TOLL FREE)
+1 (315) 215-3225
Hackleback Caviar Market By Type (Malossol Caviar, Pressed Caviar, Salted Caviar, Others), By Application (Restaurants, Household): Global Opportunity Analysis and Industry Forecast, 2023-2032
Published Date: 2023-07-01
|
Report Code: ALLI-Auto-1N711
Home | Market Reports | Food & Drink| Food| Meat & Seafood
Hackleback Caviar Market By Type Malossol Caviar Pressed Caviar Salted Caviar Others By Application Restaurants Household Global Opportunity Analysis and Industry Forecast 2023 2032
BUY CHAPTERS

Hackleback Caviar Market By Type (Malossol Caviar, Pressed Caviar, Salted Caviar, Others), By Application (Restaurants, Household): Global Opportunity Analysis and Industry Forecast, 2023-2032

Code: ALLI-Auto-1N711
Report
2023-07-01
Pages:298
Allied Market Research
Buy Now with 15% Discount
DESCRIPTION
TABLE OF CONTENT
TABLES & FIGURES

Hackleback Caviar Market Size

According to a new report published by , titled, “Hackleback Caviar Market," The hackleback caviar market was valued at $96.70 million in 2022, and is estimated to reach $160.1 million by 2032, growing at a CAGR of 5.3% from 2023 to 2032.

Hackleback Caviar Market

Hackleback Caviar Market

Hackleback caviar, also known as shovelnose sturgeon caviar, refers to the roe (eggs) harvested from the shovelnose sturgeon (Scaphirhynchus platorynchus) species. It is named after the distinctive hackle or hair on the back of the sturgeon, which distinguish it from other caviar-producing sturgeon species. As consumers are exposed to different culinary experiences through television shows, social media, and food blogs, the awareness and appreciation for caviar, including Hackleback caviar, have increased. This exposure has generated curiosity and a desire to try new and exotic ingredients, contributing to the demand for Hackleback caviar. Caviar, including Hackleback caviar, has become a symbol of indulgence and luxury, fitting into the evolving food trends that prioritize high-quality ingredients and refined dining experiences. 
Hackleback caviar is known for its distinct flavor and texture. It offers a nutty and buttery taste with small beads that pop in the mouth. This unique flavor profile sets it apart from other types of caviar and appeals to consumers who appreciate its delicate yet flavorful experience. Compared to other sturgeon caviar varieties like Beluga or Osetra, Hackleback caviar is relatively more accessible and affordable. This makes it an attractive option for consumers who want to enjoy the luxury of caviar without the high price tag associated with rarer and more expensive varieties. 
Hackleback caviar is known for its small to medium-sized grains, ranging in color from dark gray to black. It has a unique flavor profile, often described as nutty, buttery, and delicate, with a hint of sweetness. The texture of the eggs is smooth, and they have a pleasing pop when consumed. Hackleback caviar pairs well with various seafood, such as smoked salmon, lobster, or crab. It adds a layer of complexity and enhances the flavors of the seafood.  Consumers have become more knowledgeable and discerning about food quality and flavors. They seek unique and premium food products that offer exceptional taste experiences. Caviar, with its distinct flavor profile and texture, appeals to consumers who look for exquisite and indulgent culinary options. 
Effective marketing and promotion efforts by caviar producers and suppliers have helped raise awareness and generate interest in caviar among consumers. Through various channels such as advertisements, culinary events, and collaborations with chefs, caviar brands have successfully created a strong presence in the market and increased demand.  As disposable income levels rise in Asian and middle east countries, consumers have greater purchasing power to indulge in luxury food items. Caviar, being a premium and high-value product, can attract affluent consumers who are looking to experience exquisite and rare culinary delights. The increasing affluence in Asian markets presents an opportunity for caviar producers to tap into this growing consumer segment. 
Europe is geographically close to caviar-producing regions such as Russia, Iran, and the Caspian Sea area. This proximity facilitates the import and distribution of caviar, including Hackleback caviar, to European markets. The accessibility and availability of Hackleback caviar contribute to its market demand in European countries.  Despite the challenges posed by the pandemic, the resilience and adaptability of businesses, coupled with changing consumer habits, have allowed the Hackleback caviar industry to navigate through these difficult times and find new opportunities for growth and sustainability. 
The Hackleback Caviar market are segmented on the basis of product type, application, and region. By product type, the market is divided into malossol caviar, pressed caviar, salted caviar, and others. By application, the market is divided into restaurants, and household. By region, the market is analyzed across North America (U.S., Canada, Mexico), Europe (UK, Germany, France, Italy, Spain, Russia, and the Rest of Europe), Asia-Pacific (China, Japan, India, Australia, South Korea, Indonesia, and Rest of Asia-Pacific), and LAMEA (Brazil, Argentina, UAE, South Africa, Saudi Arabia, and Rest of LAMEA).  
The major players operating in the market focus on key market strategies, such as mergers, product launches, acquisitions, collaborations, and partnerships. They have also been focusing on strengthening their market reach to maintain their goodwill in the ever-competitive market. Some of the key players in the Hackleback Caviar market include Russian Caviar House LLP, Agroittica Lombarda Spa, California Caviar Company, North American Caviar, Inc, Marky's Caviar, DR Delicacy, Warsaw Caviar, LLC, Great Atlantic Trading Inc, OLMA Star LLC, and Black Diamond Caviar.  
 
KEY FINDINGS OF THE STUDY       
By product type, the pressed caviar segment witness a major growth rate during the forecast period 
By application, the restaurant segment was the highest revenue contributor to the market in 2022 and is expected to grow at a significant CAGR during the forecast period.  
Region wise, the North America region was the highest revenue contributor to the market in 2022 and is expected to grow at a significant CAGR during the forecast period.  

Overview

The global hackleback caviar market was valued at $96.7 million in 2022, and is projected to reach $160.1 million by 2032, growing at a CAGR of 5.3% from 2023 to 2032.
Hackleback caviar is known for its small to medium-sized grains, ranging in color from dark gray to black. It has a unique flavor profile, often described as nutty, buttery, and delicate, with a hint of sweetness. The texture of the eggs is smooth, and they have a pleasing pop when consumed.  Hackleback caviar is often used as a garnish for appetizers, canapés, and seafood dishes. Its distinctive appearance and flavor add an elegant touch to a wide range of dishes. It can also be used as a topping for sushi rolls, nigiri, and sashimi. Its flavor and texture complement the freshness of raw fish and enhance the overall taste experience. It is important to note that Hackleback caviar should be handled and stored properly to maintain its freshness and quality. It is typically served chilled and should be consumed soon after opening to enjoy its optimal flavor. 
As disposable income levels rise, consumers have more purchasing power to indulge in luxury food items such as caviar. Higher income levels allow a larger consumer base that can afford premium products, driving the demand for caviar. Caviar has long been associated with luxury, prestige, and exclusivity. It is often perceived as a symbol of sophistication and high social status. Many consumers are drawn to caviar as a way to enhance their dining experiences and display their affluence, contributing to its demand in the market. With advancements in transportation and logistics, caviar has become more accessible to consumers worldwide. Improved distribution networks and the availability of caviar through online platforms have made it easier for consumers to purchase and enjoy this luxury food item, contributing to its market growth. 
The hospitality industry, including high-end restaurants, hotels, and catering services, plays a significant role in driving the demand for caviar. Caviar is often featured in upscale dining establishments and is a sought-after ingredient for special events and celebrations, bolstering its market demand.  Asian countries, including China, Japan, South Korea, and India, have experienced rapid economic growth and an expanding middle class. As a result, there is an increase in demand for luxury and high-end food products. Caviar, with its association with prestige and exclusivity, can tap into this emerging market and cater to the growing demand for gourmet delicacies. 
Asian countries, such as China, Thailand, and the Maldives, attract a large number of international tourists, including luxury travelers. The tourism and hospitality industry provides an avenue for caviar producers to showcase their products in upscale resorts, cruise ships, and high-end dining establishments catering to affluent travelers. Collaborations with luxury hotels and resorts can create opportunities for caviar brands to establish a presence and generate demand among both domestic and international tourists. European countries have a rich culinary tradition and a strong appreciation for gourmet food. Caviar, including Hackleback caviar, is highly regarded as a delicacy and is often associated with luxury and indulgence. The European market values high-quality ingredients and unique flavors, making Hackleback caviar an appealing choice for discerning consumers. 
Europe attracts a significant number of tourists who seek culinary experiences and gastronomic delights. Many European countries, such as France, Italy, and Spain are renowned for their vibrant food scenes. Hackleback caviar, with its unique flavor profile and reputation as a premium ingredient, can capture the attention of tourists and become a sought-after gourmet item.  
The Hackleback caviar market are segmented on the basis of product type, application, and region. By product type, the market is divided into malossol caviar, pressed caviar, salted caviar, and others. By application, the market is divided into restaurants, and household. By region, the market is analyzed across North America (U.S., Canada, Mexico), Europe (UK, Germany, France, Italy, Spain, Russia, and the rest of Europe), Asia-Pacific (China, Japan, India, Australia, South Korea, Indonesia, and rest of Asia-Pacific), and LAMEA (Brazil, Argentina, UAE, South Africa, Saudi Arabia, and rest of LAMEA).  
The major players operating in the market focus on key market strategies, such as mergers, product launches, acquisitions, collaborations, and partnerships. They have also been focusing on strengthening their market reach to maintain their goodwill in the ever-competitive market. Some of the key players in the Hackleback Caviar market include Russian Caviar House LLP, Agroittica Lombarda Spa, California Caviar Company, North American Caviar, Inc, Marky's Caviar, DR Delicacy, Warsaw Caviar, LLC, Great Atlantic Trading Inc, OLMA Star LLC, and Black Diamond Caviar.  
 

KEY BENEFITS FOR STAKEHOLDERS      

This report provides a quantitative analysis of the market segments, current trends, estimations, and dynamics of the Hackleback Caviar analysis from 2022 to 2032 to identify the prevailing market opportunities. 
The market research is offered along with information related to key drivers, restraints, and Hackleback Caviar market opportunities. 
Porter’s five forces analysis highlights the potency of buyers and suppliers to enable stakeholders to make profit-oriented business decisions and strengthen their supplier-buyer network. 
In-depth analysis of the Hackleback Caviar segmentation assists to determine the prevailing market opportunities. 
Major countries in each region are mapped according to their revenue contribution to the global Hackleback Caviar industry. 
Market player positioning facilitates benchmarking and provides a clear understanding of the present position of the market players. 
The report includes the analysis of the regional as well as global Hackleback Caviar market trends, key players, market segments, distribution channel areas, and growth strategies.

Additional benefits you will get with this purchase are:

● Quarterly Update and* (only available with a corporate license, on listed price)
● 5 additional Company Profile of client Choice pre- or Post-purchase, as a free update.
● Free Upcoming Version on the Purchase of Five and Enterprise User License.
● 16 analyst hours of support* (post-purchase, if you find additional data requirements upon review of the report, you may receive support amounting to 16 analyst hours to solve questions, and post-sale queries)
● 15% Free Customization* (in case the scope or segment of the report does not match your requirements, 20% is equivalent to 3 working days of free work, applicable once)
● Free data Pack on the Five and Enterprise User License. (Excel version of the report)
● Free Updated report if the report is 6-12 months old or older.
● 24-hour priority response*
● Free Industry updates and white papers.
Possible Customization with this report (with additional cost and timeline talk to the sales executive to know more)
● Product Life Cycles
● Go To Market Strategy
● Regulatory Guidelines
● Strategic Recommedations
Key Market Segments
○ Warsaw Caviar, LL

Scope of Hackleback Caviar Market Report

Report Metric Details
Report Name Hackleback Caviar Market
Accounted market size in 2022 $ 96.70 in million
Forecasted market size in 2032 $ 160.1 million
CAGR 5.3%
Base Year 2022
Forecasted years 2024 - 2032
By Type ● Malossol Caviar
● Pressed Caviar
● Salted Caviar
● Others
By Application ● Restaurants
● Household
By Region
  • North America (United States, Canada)
  • Europe (Germany, France, UK, Italy, Russia) Rest of Europe
  • Nordic Countries
  • Asia-Pacific (China, Japan, South Korea)
  • Southeast Asia (India, Australia)
  • Rest of Asia
  • Latin America (Mexico, Brazil)
  • Rest of Latin America
  • Middle East & Africa (Turkey, Saudi Arabia, UAE, Rest of MEA)
Forecast units USD million in value
Report coverage Revenue and volume forecast, company share, competitive landscape, growth factors and trends

FAQ for this report

How fast is Hackleback Caviar Market growing?

Ans: The Hackleback Caviar Market witnessing a CAGR of 5.3% during the forecast period 2024-2032.

What is the Hackleback Caviar Market size in 2032?

Ans: The Hackleback Caviar Market size in 2032 will be $ 160.1 million.

What are the Application segmentation covered in the Hackleback Caviar Market report?

Ans: The Applications covered in the Hackleback Caviar Market report are ● Restaurants, ● Household

What are the Type segmentation covered in the Hackleback Caviar Market report?

Ans: The Types covered in the Hackleback Caviar Market report are ● Malossol Caviar, ● Pressed Caviar, ● Salted Caviar, ● Others

CHAPTER 1: INTRODUCTION
1.1. Report description
1.2. Key market segments
1.3. Key benefits to the stakeholders
1.4. Research Methodology
1.4.1. Primary research
1.4.2. Secondary research
1.4.3. Analyst tools and models
CHAPTER 2: EXECUTIVE SUMMARY
2.1. CXO Perspective
CHAPTER 3: MARKET OVERVIEW
3.1. Market definition and scope
3.2. Key findings
3.2.1. Top impacting factors
3.2.2. Top investment pockets
3.3. Porter’s five forces analysis
3.3.1. Low bargaining power of suppliers
3.3.2. Low threat of new entrants
3.3.3. Low threat of substitutes
3.3.4. Low intensity of rivalry
3.3.5. Low bargaining power of buyers
3.4. Market dynamics
3.4.1. Drivers
3.4.1.1. Growing Awareness and Exposure in caviar industry
3.4.1.2. Unique Flavor, Texture, Accessibility and Affordability
3.4.2. Restraints
3.4.2.1. Limited Availability
3.4.2.2. Environmental Concerns
3.4.3. Opportunities
3.4.3.1. Rise of e-commerce and online platforms
3.4.3.2. Unique Flavor, Texture, Accessibility and Affordability
3.5. COVID-19 Impact Analysis on the market
CHAPTER 4: HACKLEBACK CAVIAR MARKET, BY TYPE
4.1. Overview
4.1.1. Market size and forecast
4.2. Malossol Caviar
4.2.1. Key market trends, growth factors and opportunities
4.2.2. Market size and forecast, by region
4.2.3. Market share analysis by country
4.3. Pressed Caviar
4.3.1. Key market trends, growth factors and opportunities
4.3.2. Market size and forecast, by region
4.3.3. Market share analysis by country
4.4. Salted Caviar
4.4.1. Key market trends, growth factors and opportunities
4.4.2. Market size and forecast, by region
4.4.3. Market share analysis by country
4.5. Others
4.5.1. Key market trends, growth factors and opportunities
4.5.2. Market size and forecast, by region
4.5.3. Market share analysis by country
CHAPTER 5: HACKLEBACK CAVIAR MARKET, BY APPLICATION
5.1. Overview
5.1.1. Market size and forecast
5.2. Restaurants
5.2.1. Key market trends, growth factors and opportunities
5.2.2. Market size and forecast, by region
5.2.3. Market share analysis by country
5.3. Household
5.3.1. Key market trends, growth factors and opportunities
5.3.2. Market size and forecast, by region
5.3.3. Market share analysis by country
CHAPTER 6: HACKLEBACK CAVIAR MARKET, BY REGION
6.1. Overview
6.1.1. Market size and forecast By Region
6.2. North America
6.2.1. Key trends and opportunities
6.2.2. Market size and forecast, by Type
6.2.3. Market size and forecast, by Application
6.2.4. Market size and forecast, by country
6.2.4.1. U.S.
6.2.4.1.1. Key market trends, growth factors and opportunities
6.2.4.1.2. Market size and forecast, by Type
6.2.4.1.3. Market size and forecast, by Application
6.2.4.2. Canada
6.2.4.2.1. Key market trends, growth factors and opportunities
6.2.4.2.2. Market size and forecast, by Type
6.2.4.2.3. Market size and forecast, by Application
6.2.4.3. Mexico
6.2.4.3.1. Key market trends, growth factors and opportunities
6.2.4.3.2. Market size and forecast, by Type
6.2.4.3.3. Market size and forecast, by Application
6.3. Europe
6.3.1. Key trends and opportunities
6.3.2. Market size and forecast, by Type
6.3.3. Market size and forecast, by Application
6.3.4. Market size and forecast, by country
6.3.4.1. Germany
6.3.4.1.1. Key market trends, growth factors and opportunities
6.3.4.1.2. Market size and forecast, by Type
6.3.4.1.3. Market size and forecast, by Application
6.3.4.2. France
6.3.4.2.1. Key market trends, growth factors and opportunities
6.3.4.2.2. Market size and forecast, by Type
6.3.4.2.3. Market size and forecast, by Application
6.3.4.3. UK
6.3.4.3.1. Key market trends, growth factors and opportunities
6.3.4.3.2. Market size and forecast, by Type
6.3.4.3.3. Market size and forecast, by Application
6.3.4.4. Italy
6.3.4.4.1. Key market trends, growth factors and opportunities
6.3.4.4.2. Market size and forecast, by Type
6.3.4.4.3. Market size and forecast, by Application
6.3.4.5. Spain
6.3.4.5.1. Key market trends, growth factors and opportunities
6.3.4.5.2. Market size and forecast, by Type
6.3.4.5.3. Market size and forecast, by Application
6.3.4.6. Russia
6.3.4.6.1. Key market trends, growth factors and opportunities
6.3.4.6.2. Market size and forecast, by Type
6.3.4.6.3. Market size and forecast, by Application
6.3.4.7. Rest of Europe
6.3.4.7.1. Key market trends, growth factors and opportunities
6.3.4.7.2. Market size and forecast, by Type
6.3.4.7.3. Market size and forecast, by Application
6.4. Asia-Pacific
6.4.1. Key trends and opportunities
6.4.2. Market size and forecast, by Type
6.4.3. Market size and forecast, by Application
6.4.4. Market size and forecast, by country
6.4.4.1. China
6.4.4.1.1. Key market trends, growth factors and opportunities
6.4.4.1.2. Market size and forecast, by Type
6.4.4.1.3. Market size and forecast, by Application
6.4.4.2. Japan
6.4.4.2.1. Key market trends, growth factors and opportunities
6.4.4.2.2. Market size and forecast, by Type
6.4.4.2.3. Market size and forecast, by Application
6.4.4.3. India
6.4.4.3.1. Key market trends, growth factors and opportunities
6.4.4.3.2. Market size and forecast, by Type
6.4.4.3.3. Market size and forecast, by Application
6.4.4.4. Australia
6.4.4.4.1. Key market trends, growth factors and opportunities
6.4.4.4.2. Market size and forecast, by Type
6.4.4.4.3. Market size and forecast, by Application
6.4.4.5. South Korea
6.4.4.5.1. Key market trends, growth factors and opportunities
6.4.4.5.2. Market size and forecast, by Type
6.4.4.5.3. Market size and forecast, by Application
6.4.4.6. Indonesia
6.4.4.6.1. Key market trends, growth factors and opportunities
6.4.4.6.2. Market size and forecast, by Type
6.4.4.6.3. Market size and forecast, by Application
6.4.4.7. Rest of Asia-Pacific
6.4.4.7.1. Key market trends, growth factors and opportunities
6.4.4.7.2. Market size and forecast, by Type
6.4.4.7.3. Market size and forecast, by Application
6.5. LAMEA
6.5.1. Key trends and opportunities
6.5.2. Market size and forecast, by Type
6.5.3. Market size and forecast, by Application
6.5.4. Market size and forecast, by country
6.5.4.1. Brazil
6.5.4.1.1. Key market trends, growth factors and opportunities
6.5.4.1.2. Market size and forecast, by Type
6.5.4.1.3. Market size and forecast, by Application
6.5.4.2. Argentina
6.5.4.2.1. Key market trends, growth factors and opportunities
6.5.4.2.2. Market size and forecast, by Type
6.5.4.2.3. Market size and forecast, by Application
6.5.4.3. UAE
6.5.4.3.1. Key market trends, growth factors and opportunities
6.5.4.3.2. Market size and forecast, by Type
6.5.4.3.3. Market size and forecast, by Application
6.5.4.4. South Africa
6.5.4.4.1. Key market trends, growth factors and opportunities
6.5.4.4.2. Market size and forecast, by Type
6.5.4.4.3. Market size and forecast, by Application
6.5.4.5. Saudi Arabia
6.5.4.5.1. Key market trends, growth factors and opportunities
6.5.4.5.2. Market size and forecast, by Type
6.5.4.5.3. Market size and forecast, by Application
6.5.4.6. Rest of LAMEA
6.5.4.6.1. Key market trends, growth factors and opportunities
6.5.4.6.2. Market size and forecast, by Type
6.5.4.6.3. Market size and forecast, by Application
CHAPTER 7: COMPETITIVE LANDSCAPE
7.1. Introduction
7.2. Top winning strategies
7.3. Product Mapping of Top 10 Player
7.4. Competitive Dashboard
7.5. Competitive Heatmap
7.6. Top player positioning, 2022
CHAPTER 8: COMPANY PROFILES
8.1. Agroittica Lombarda Spa
8.1.1. Company overview
8.1.2. Key Executives
8.1.3. Company snapshot
8.1.4. Operating business segments
8.1.5. Product portfolio
8.2. Russian Caviar House LLP
8.2.1. Company overview
8.2.2. Key Executives
8.2.3. Company snapshot
8.2.4. Operating business segments
8.2.5. Product portfolio
8.3. California Caviar Company
8.3.1. Company overview
8.3.2. Key Executives
8.3.3. Company snapshot
8.3.4. Operating business segments
8.3.5. Product portfolio
8.4. Great Atlantic Trading Inc.
8.4.1. Company overview
8.4.2. Key Executives
8.4.3. Company snapshot
8.4.4. Operating business segments
8.4.5. Product portfolio
8.5. North American Caviar, Inc.
8.5.1. Company overview
8.5.2. Key Executives
8.5.3. Company snapshot
8.5.4. Operating business segments
8.5.5. Product portfolio
8.6. Marky's Caviar
8.6.1. Company overview
8.6.2. Key Executives
8.6.3. Company snapshot
8.6.4. Operating business segments
8.6.5. Product portfolio
8.7. DR Delicacy
8.7.1. Company overview
8.7.2. Key Executives
8.7.3. Company snapshot
8.7.4. Operating business segments
8.7.5. Product portfolio
8.8. OLMA Star LLC
8.8.1. Company overview
8.8.2. Key Executives
8.8.3. Company snapshot
8.8.4. Operating business segments
8.8.5. Product portfolio
8.9. Warsaw Caviar, LLC
8.9.1. Company overview
8.9.2. Key Executives
8.9.3. Company snapshot
8.9.4. Operating business segments
8.9.5. Product portfolio
8.10. Black Diamond Caviar
8.10.1. Company overview
8.10.2. Key Executives
8.10.3. Company snapshot
8.10.4. Operating business segments
8.10.5. Product portfoli
LIST OF TABLES
TABLE 01. GLOBAL HACKLEBACK CAVIAR MARKET, BY TYPE, 2022-2032 ($MILLION)
TABLE 02. HACKLEBACK CAVIAR MARKET FOR MALOSSOL CAVIAR, BY REGION, 2022-2032 ($MILLION)
TABLE 03. HACKLEBACK CAVIAR MARKET FOR PRESSED CAVIAR, BY REGION, 2022-2032 ($MILLION)
TABLE 04. HACKLEBACK CAVIAR MARKET FOR SALTED CAVIAR, BY REGION, 2022-2032 ($MILLION)
TABLE 05. HACKLEBACK CAVIAR MARKET FOR OTHERS, BY REGION, 2022-2032 ($MILLION)
TABLE 06. GLOBAL HACKLEBACK CAVIAR MARKET, BY APPLICATION, 2022-2032 ($MILLION)
TABLE 07. HACKLEBACK CAVIAR MARKET FOR RESTAURANTS, BY REGION, 2022-2032 ($MILLION)
TABLE 08. HACKLEBACK CAVIAR MARKET FOR HOUSEHOLD, BY REGION, 2022-2032 ($MILLION)
TABLE 09. HACKLEBACK CAVIAR MARKET, BY REGION, 2022-2032 ($MILLION)
TABLE 10. NORTH AMERICA HACKLEBACK CAVIAR MARKET, BY TYPE, 2022-2032 ($MILLION)
TABLE 11. NORTH AMERICA HACKLEBACK CAVIAR MARKET, BY APPLICATION, 2022-2032 ($MILLION)
TABLE 12. NORTH AMERICA HACKLEBACK CAVIAR MARKET, BY COUNTRY, 2022-2032 ($MILLION)
TABLE 13. U.S. HACKLEBACK CAVIAR MARKET, BY TYPE, 2022-2032 ($MILLION)
TABLE 14. U.S. HACKLEBACK CAVIAR MARKET, BY APPLICATION, 2022-2032 ($MILLION)
TABLE 15. CANADA HACKLEBACK CAVIAR MARKET, BY TYPE, 2022-2032 ($MILLION)
TABLE 16. CANADA HACKLEBACK CAVIAR MARKET, BY APPLICATION, 2022-2032 ($MILLION)
TABLE 17. MEXICO HACKLEBACK CAVIAR MARKET, BY TYPE, 2022-2032 ($MILLION)
TABLE 18. MEXICO HACKLEBACK CAVIAR MARKET, BY APPLICATION, 2022-2032 ($MILLION)
TABLE 19. EUROPE HACKLEBACK CAVIAR MARKET, BY TYPE, 2022-2032 ($MILLION)
TABLE 20. EUROPE HACKLEBACK CAVIAR MARKET, BY APPLICATION, 2022-2032 ($MILLION)
TABLE 21. EUROPE HACKLEBACK CAVIAR MARKET, BY COUNTRY, 2022-2032 ($MILLION)
TABLE 22. GERMANY HACKLEBACK CAVIAR MARKET, BY TYPE, 2022-2032 ($MILLION)
TABLE 23. GERMANY HACKLEBACK CAVIAR MARKET, BY APPLICATION, 2022-2032 ($MILLION)
TABLE 24. FRANCE HACKLEBACK CAVIAR MARKET, BY TYPE, 2022-2032 ($MILLION)
TABLE 25. FRANCE HACKLEBACK CAVIAR MARKET, BY APPLICATION, 2022-2032 ($MILLION)
TABLE 26. UK HACKLEBACK CAVIAR MARKET, BY TYPE, 2022-2032 ($MILLION)
TABLE 27. UK HACKLEBACK CAVIAR MARKET, BY APPLICATION, 2022-2032 ($MILLION)
TABLE 28. ITALY HACKLEBACK CAVIAR MARKET, BY TYPE, 2022-2032 ($MILLION)
TABLE 29. ITALY HACKLEBACK CAVIAR MARKET, BY APPLICATION, 2022-2032 ($MILLION)
TABLE 30. SPAIN HACKLEBACK CAVIAR MARKET, BY TYPE, 2022-2032 ($MILLION)
TABLE 31. SPAIN HACKLEBACK CAVIAR MARKET, BY APPLICATION, 2022-2032 ($MILLION)
TABLE 32. RUSSIA HACKLEBACK CAVIAR MARKET, BY TYPE, 2022-2032 ($MILLION)
TABLE 33. RUSSIA HACKLEBACK CAVIAR MARKET, BY APPLICATION, 2022-2032 ($MILLION)
TABLE 34. REST OF EUROPE HACKLEBACK CAVIAR MARKET, BY TYPE, 2022-2032 ($MILLION)
TABLE 35. REST OF EUROPE HACKLEBACK CAVIAR MARKET, BY APPLICATION, 2022-2032 ($MILLION)
TABLE 36. ASIA-PACIFIC HACKLEBACK CAVIAR MARKET, BY TYPE, 2022-2032 ($MILLION)
TABLE 37. ASIA-PACIFIC HACKLEBACK CAVIAR MARKET, BY APPLICATION, 2022-2032 ($MILLION)
TABLE 38. ASIA-PACIFIC HACKLEBACK CAVIAR MARKET, BY COUNTRY, 2022-2032 ($MILLION)
TABLE 39. CHINA HACKLEBACK CAVIAR MARKET, BY TYPE, 2022-2032 ($MILLION)
TABLE 40. CHINA HACKLEBACK CAVIAR MARKET, BY APPLICATION, 2022-2032 ($MILLION)
TABLE 41. JAPAN HACKLEBACK CAVIAR MARKET, BY TYPE, 2022-2032 ($MILLION)
TABLE 42. JAPAN HACKLEBACK CAVIAR MARKET, BY APPLICATION, 2022-2032 ($MILLION)
TABLE 43. INDIA HACKLEBACK CAVIAR MARKET, BY TYPE, 2022-2032 ($MILLION)
TABLE 44. INDIA HACKLEBACK CAVIAR MARKET, BY APPLICATION, 2022-2032 ($MILLION)
TABLE 45. AUSTRALIA HACKLEBACK CAVIAR MARKET, BY TYPE, 2022-2032 ($MILLION)
TABLE 46. AUSTRALIA HACKLEBACK CAVIAR MARKET, BY APPLICATION, 2022-2032 ($MILLION)
TABLE 47. SOUTH KOREA HACKLEBACK CAVIAR MARKET, BY TYPE, 2022-2032 ($MILLION)
TABLE 48. SOUTH KOREA HACKLEBACK CAVIAR MARKET, BY APPLICATION, 2022-2032 ($MILLION)
TABLE 49. INDONESIA HACKLEBACK CAVIAR MARKET, BY TYPE, 2022-2032 ($MILLION)
TABLE 50. INDONESIA HACKLEBACK CAVIAR MARKET, BY APPLICATION, 2022-2032 ($MILLION)
TABLE 51. REST OF ASIA-PACIFIC HACKLEBACK CAVIAR MARKET, BY TYPE, 2022-2032 ($MILLION)
TABLE 52. REST OF ASIA-PACIFIC HACKLEBACK CAVIAR MARKET, BY APPLICATION, 2022-2032 ($MILLION)
TABLE 53. LAMEA HACKLEBACK CAVIAR MARKET, BY TYPE, 2022-2032 ($MILLION)
TABLE 54. LAMEA HACKLEBACK CAVIAR MARKET, BY APPLICATION, 2022-2032 ($MILLION)
TABLE 55. LAMEA HACKLEBACK CAVIAR MARKET, BY COUNTRY, 2022-2032 ($MILLION)
TABLE 56. BRAZIL HACKLEBACK CAVIAR MARKET, BY TYPE, 2022-2032 ($MILLION)
TABLE 57. BRAZIL HACKLEBACK CAVIAR MARKET, BY APPLICATION, 2022-2032 ($MILLION)
TABLE 58. ARGENTINA HACKLEBACK CAVIAR MARKET, BY TYPE, 2022-2032 ($MILLION)
TABLE 59. ARGENTINA HACKLEBACK CAVIAR MARKET, BY APPLICATION, 2022-2032 ($MILLION)
TABLE 60. UAE HACKLEBACK CAVIAR MARKET, BY TYPE, 2022-2032 ($MILLION)
TABLE 61. UAE HACKLEBACK CAVIAR MARKET, BY APPLICATION, 2022-2032 ($MILLION)
TABLE 62. SOUTH AFRICA HACKLEBACK CAVIAR MARKET, BY TYPE, 2022-2032 ($MILLION)
TABLE 63. SOUTH AFRICA HACKLEBACK CAVIAR MARKET, BY APPLICATION, 2022-2032 ($MILLION)
TABLE 64. SAUDI ARABIA HACKLEBACK CAVIAR MARKET, BY TYPE, 2022-2032 ($MILLION)
TABLE 65. SAUDI ARABIA HACKLEBACK CAVIAR MARKET, BY APPLICATION, 2022-2032 ($MILLION)
TABLE 66. REST OF LAMEA HACKLEBACK CAVIAR MARKET, BY TYPE, 2022-2032 ($MILLION)
TABLE 67. REST OF LAMEA HACKLEBACK CAVIAR MARKET, BY APPLICATION, 2022-2032 ($MILLION)
TABLE 68. AGROITTICA LOMBARDA SPA: KEY EXECUTIVES
TABLE 69. AGROITTICA LOMBARDA SPA: COMPANY SNAPSHOT
TABLE 70. AGROITTICA LOMBARDA SPA: PRODUCT SEGMENTS
TABLE 71. AGROITTICA LOMBARDA SPA: PRODUCT PORTFOLIO
TABLE 72. RUSSIAN CAVIAR HOUSE LLP: KEY EXECUTIVES
TABLE 73. RUSSIAN CAVIAR HOUSE LLP: COMPANY SNAPSHOT
TABLE 74. RUSSIAN CAVIAR HOUSE LLP: PRODUCT SEGMENTS
TABLE 75. RUSSIAN CAVIAR HOUSE LLP: PRODUCT PORTFOLIO
TABLE 76. CALIFORNIA CAVIAR COMPANY: KEY EXECUTIVES
TABLE 77. CALIFORNIA CAVIAR COMPANY: COMPANY SNAPSHOT
TABLE 78. CALIFORNIA CAVIAR COMPANY: PRODUCT SEGMENTS
TABLE 79. CALIFORNIA CAVIAR COMPANY: PRODUCT PORTFOLIO
TABLE 80. GREAT ATLANTIC TRADING INC.: KEY EXECUTIVES
TABLE 81. GREAT ATLANTIC TRADING INC.: COMPANY SNAPSHOT
TABLE 82. GREAT ATLANTIC TRADING INC.: PRODUCT SEGMENTS
TABLE 83. GREAT ATLANTIC TRADING INC.: PRODUCT PORTFOLIO
TABLE 84. NORTH AMERICAN CAVIAR, INC.: KEY EXECUTIVES
TABLE 85. NORTH AMERICAN CAVIAR, INC.: COMPANY SNAPSHOT
TABLE 86. NORTH AMERICAN CAVIAR, INC.: PRODUCT SEGMENTS
TABLE 87. NORTH AMERICAN CAVIAR, INC.: PRODUCT PORTFOLIO
TABLE 88. MARKY'S CAVIAR: KEY EXECUTIVES
TABLE 89. MARKY'S CAVIAR: COMPANY SNAPSHOT
TABLE 90. MARKY'S CAVIAR: PRODUCT SEGMENTS
TABLE 91. MARKY'S CAVIAR: PRODUCT PORTFOLIO
TABLE 92. DR DELICACY: KEY EXECUTIVES
TABLE 93. DR DELICACY: COMPANY SNAPSHOT
TABLE 94. DR DELICACY: PRODUCT SEGMENTS
TABLE 95. DR DELICACY: PRODUCT PORTFOLIO
TABLE 96. OLMA STAR LLC: KEY EXECUTIVES
TABLE 97. OLMA STAR LLC: COMPANY SNAPSHOT
TABLE 98. OLMA STAR LLC: PRODUCT SEGMENTS
TABLE 99. OLMA STAR LLC: PRODUCT PORTFOLIO
TABLE 100. WARSAW CAVIAR, LLC: KEY EXECUTIVES
TABLE 101. WARSAW CAVIAR, LLC: COMPANY SNAPSHOT
TABLE 102. WARSAW CAVIAR, LLC: PRODUCT SEGMENTS
TABLE 103. WARSAW CAVIAR, LLC: PRODUCT PORTFOLIO
TABLE 104. BLACK DIAMOND CAVIAR: KEY EXECUTIVES
TABLE 105. BLACK DIAMOND CAVIAR: COMPANY SNAPSHOT
TABLE 106. BLACK DIAMOND CAVIAR: PRODUCT SEGMENTS
TABLE 107. BLACK DIAMOND CAVIAR: PRODUCT PORTFOLIO LIST OF FIGURES
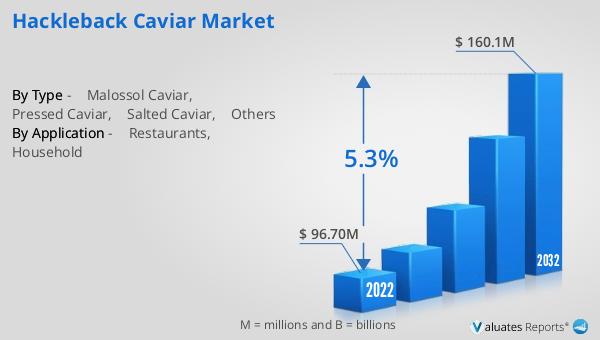
FIGURE 01. HACKLEBACK CAVIAR MARKET, 2022-2032
FIGURE 02. SEGMENTATION OF HACKLEBACK CAVIAR MARKET, 2022-2032
FIGURE 03. TOP INVESTMENT POCKETS IN HACKLEBACK CAVIAR MARKET (2023-2032)
FIGURE 04. LOW BARGAINING POWER OF SUPPLIERS
FIGURE 05. LOW THREAT OF NEW ENTRANTS
FIGURE 06. LOW THREAT OF SUBSTITUTES
FIGURE 07. LOW INTENSITY OF RIVALRY
FIGURE 08. LOW BARGAINING POWER OF BUYERS
FIGURE 09. DRIVERS, RESTRAINTS AND OPPORTUNITIES: GLOBALHACKLEBACK CAVIAR MARKET
FIGURE 09. HACKLEBACK CAVIAR MARKET, BY TYPE, 2022(%)
FIGURE 10. COMPARATIVE SHARE ANALYSIS OF HACKLEBACK CAVIAR MARKET FOR MALOSSOL CAVIAR, BY COUNTRY 2022 AND 2032(%)
FIGURE 11. COMPARATIVE SHARE ANALYSIS OF HACKLEBACK CAVIAR MARKET FOR PRESSED CAVIAR, BY COUNTRY 2022 AND 2032(%)
FIGURE 12. COMPARATIVE SHARE ANALYSIS OF HACKLEBACK CAVIAR MARKET FOR SALTED CAVIAR, BY COUNTRY 2022 AND 2032(%)
FIGURE 13. COMPARATIVE SHARE ANALYSIS OF HACKLEBACK CAVIAR MARKET FOR OTHERS, BY COUNTRY 2022 AND 2032(%)
FIGURE 14. HACKLEBACK CAVIAR MARKET, BY APPLICATION, 2022(%)
FIGURE 15. COMPARATIVE SHARE ANALYSIS OF HACKLEBACK CAVIAR MARKET FOR RESTAURANTS, BY COUNTRY 2022 AND 2032(%)
FIGURE 16. COMPARATIVE SHARE ANALYSIS OF HACKLEBACK CAVIAR MARKET FOR HOUSEHOLD, BY COUNTRY 2022 AND 2032(%)
FIGURE 17. HACKLEBACK CAVIAR MARKET BY REGION, 2022
FIGURE 18. U.S. HACKLEBACK CAVIAR MARKET, 2022-2032 ($MILLION)
FIGURE 19. CANADA HACKLEBACK CAVIAR MARKET, 2022-2032 ($MILLION)
FIGURE 20. MEXICO HACKLEBACK CAVIAR MARKET, 2022-2032 ($MILLION)
FIGURE 21. GERMANY HACKLEBACK CAVIAR MARKET, 2022-2032 ($MILLION)
FIGURE 22. FRANCE HACKLEBACK CAVIAR MARKET, 2022-2032 ($MILLION)
FIGURE 23. UK HACKLEBACK CAVIAR MARKET, 2022-2032 ($MILLION)
FIGURE 24. ITALY HACKLEBACK CAVIAR MARKET, 2022-2032 ($MILLION)
FIGURE 25. SPAIN HACKLEBACK CAVIAR MARKET, 2022-2032 ($MILLION)
FIGURE 26. RUSSIA HACKLEBACK CAVIAR MARKET, 2022-2032 ($MILLION)
FIGURE 27. REST OF EUROPE HACKLEBACK CAVIAR MARKET, 2022-2032 ($MILLION)
FIGURE 28. CHINA HACKLEBACK CAVIAR MARKET, 2022-2032 ($MILLION)
FIGURE 29. JAPAN HACKLEBACK CAVIAR MARKET, 2022-2032 ($MILLION)
FIGURE 30. INDIA HACKLEBACK CAVIAR MARKET, 2022-2032 ($MILLION)
FIGURE 31. AUSTRALIA HACKLEBACK CAVIAR MARKET, 2022-2032 ($MILLION)
FIGURE 32. SOUTH KOREA HACKLEBACK CAVIAR MARKET, 2022-2032 ($MILLION)
FIGURE 33. INDONESIA HACKLEBACK CAVIAR MARKET, 2022-2032 ($MILLION)
FIGURE 34. REST OF ASIA-PACIFIC HACKLEBACK CAVIAR MARKET, 2022-2032 ($MILLION)
FIGURE 35. BRAZIL HACKLEBACK CAVIAR MARKET, 2022-2032 ($MILLION)
FIGURE 36. ARGENTINA HACKLEBACK CAVIAR MARKET, 2022-2032 ($MILLION)
FIGURE 37. UAE HACKLEBACK CAVIAR MARKET, 2022-2032 ($MILLION)
FIGURE 38. SOUTH AFRICA HACKLEBACK CAVIAR MARKET, 2022-2032 ($MILLION)
FIGURE 39. SAUDI ARABIA HACKLEBACK CAVIAR MARKET, 2022-2032 ($MILLION)
FIGURE 40. REST OF LAMEA HACKLEBACK CAVIAR MARKET, 2022-2032 ($MILLION)
FIGURE 41. TOP WINNING STRATEGIES, BY YEAR
FIGURE 42. TOP WINNING STRATEGIES, BY DEVELOPMENT
FIGURE 43. TOP WINNING STRATEGIES, BY COMPANY
FIGURE 44. PRODUCT MAPPING OF TOP 10 PLAYERS
FIGURE 45. COMPETITIVE DASHBOARD
FIGURE 46. COMPETITIVE HEATMAP: HACKLEBACK CAVIAR MARKET
FIGURE 47. TOP PLAYER POSITIONING, 202
SELECT A FORMAT
Added to Cart
Electronic

$5730

Single User License
Electronic

$6450

Multi User License
Electronic

$9600

Enterprise License
Electronic

$3840

Data Pack License
Add to Cart
Buy Now (15% Discount)

OUR CUSTOMER

Samsung SD

SIMILAR REPORTS